New Semester
Started
Get
50% OFF
Study Help!
--h --m --s
Claim Now
Question Answers
Textbooks
Find textbooks, questions and answers
Oops, something went wrong!
Change your search query and then try again
S
Books
FREE
Study Help
Expert Questions
Accounting
General Management
Mathematics
Finance
Organizational Behaviour
Law
Physics
Operating System
Management Leadership
Sociology
Programming
Marketing
Database
Computer Network
Economics
Textbooks Solutions
Accounting
Managerial Accounting
Management Leadership
Cost Accounting
Statistics
Business Law
Corporate Finance
Finance
Economics
Auditing
Tutors
Online Tutors
Find a Tutor
Hire a Tutor
Become a Tutor
AI Tutor
AI Study Planner
NEW
Sell Books
Search
Search
Sign In
Register
study help
business
statistics informed decisions using data
Statistics Without Maths For Psychology Using Spss For Windows 4th Edition Christine P. Dancey, John Reidy - Solutions
Sample means are:(a) Point estimates of sample means(b) Interval estimates of population means(c) Interval estimates of sample means(d) Point estimates of population means
All other things being equal, the more powerful the statistical test:(a) The wider the confidence intervals(b) The more likely the confidence interval will include zero(c) The narrower the confidence interval(d) The smaller the sample size
Power can be calculated by a knowledge of:(a) The statistical test, the type of design and the effect size(b) The statistical test, the criterion significance level and the effect size(c) The criterion significance level, the effect size and the type of design(d) The criterion significance level,
A power level of 0.3 means:(a) You have a 30% chance of detecting an effect(b) You have a 49% chance of detecting an effect(c) You have a 70% chance of detecting an effect(d) You have a 0.7% chance of detecting an effect
Look at the following output for an independent t-test:Which is the most appropriate answer?We can be 95% confident that:(a) The population mean difference is 27.7 (b) The population mean will fall between 19.18 and 36.21 (c) The population mean will fall between 19.46 and 35.93 (d) The results
A researcher has found a correlation coefficient of r = +0.30, CI(95%) = −0.2 − (+0.7).Which is the most sensible conclusion? We are 95% confident that the population regression line would be:(a) Positive (+0.30)(b) Zero(c) Negative (−0.2)(d) Between −0.2 and +0.7
Look at the following output from a paired t-test analysis:Which is the most sensible answer?(a) The sample mean difference is −0.15, and we are 95% confident that the population mean difference will fall between −0.32 and 0.02 (b) The sample mean difference is 0.76, and we are 95% confident
It is more important to know the power of a study when:(a) The study has large participant numbers and is statistically significant(b) The study has large participant numbers and is not statistically significant(c) The study has small participant numbers and is statistically significant(d) The
Relative to large effect sizes, small effect sizes are:(a) Easier to detect(b) Harder to detect(c) As easy to detect(d) As difficult to detect
What are your chances of finding an effect (if one exists) when power = 0.6?(a) 50:50(b) 60:40(c) 40:60(d) 60:60
Confidence intervals around a mean value gives you:(a) A range within which the population mean is likely to fall(b) A range within which the sample mean is likely to fall(c) A point estimate of the population mean(d) A point estimate of the sample mean
As your statistical test grows more powerful, does your confidence interval become:(a) Wider(b) Narrower(c) It makes no difference
If d = 0.89, then the effect size is said to be:(a) Zero(b) Weak(c) Moderate(d) Strong
When is a knowledge of power more important?(a) When you find an effect(b) When you don’t find an effect(c) It makes no difference
Fisher’s Exact Probability Test is used when:(a) The calculations for χ2 are too difficult(b) You have more than 25% of cells with expected frequencies of less than 5 in a 2 × 2 design(c) You have more than 25% of cells with expected frequencies of less than 5 in a 3 × 2 contingency table(d)
Cramer’s V is:(a) A victory sign made after performing Cramer’s statistical test(b) A measure of effect based on standardised scores(c) A correlational measure of effect converted from χ2(d) A measure of difference
How many women were in the Tuesday morning group?(a) 127(b) 43(c) 99(d) 210
Pearson’s χ2 has an associated probability of:(a) < 0.001(b) 0.00004(c) 0.00124(d) None of these
The number of people in this analysis is:(a) 231(b) 170(c) 124(d) 525
290 people are asked which of five types of cola they prefer. Results are as follows:Coca Cola Pepsi Diet Coke Cheapo Pepsi Lite 67 83 77 6 57 What are the expected frequencies for the cells:(a) 57 (b) 58 (c) 290 (d) None of the above
Look at the following output:χ2 has an associated probability of:(a) 0.00005 (b) 0.00004 (c) 0.00200 (d) 0.00050 Chi-Square Tests Value df Asymp, Sig, (2-sided) Pearson Chi-Square 14,3212 1 .00050 Likelihood Ratio 14,3722 1 .00004 Linear-by-Linear Association 14.3521 1 .00005
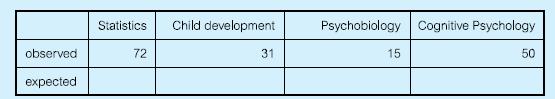
Look at the following table:What is the value of the expected frequencies?(a) 32 (b) 50 (c) 42 (d) 25 observed expected Statistics 72 Child development 31 Psychobiology Cognitive Psychology 15 50
A one-variable χ2 is also called:(a) Goodness-of-fit test(b) χ2 test of independence(c) χ2 4 × 2(d) 2 × 2 χ2
The value of χ2 will always be:(a) Positive(b) Negative(c) High(d) It depends
The Yates’ correction is sometimes used by researchers when:(a) Cell sizes are huge(b) Cell sizes are small(c) They analyse data from 2 × 2 contingency tables(d) Both (b) and (c) above
The χ2 value is:(a) 12.162(b) 21.516(c) 22.305(d) 525
The χ2 value has an exact probability level of:(a) 0.0004(b) 0.05(c) 0.01055(d) 0.00796
The value of Cramer’s V is:(a) 0.05(b) 0.008(c) 0.099(d) 0.010
Look at the following 2 × 2 contingency table, taken from 150 participants:Drink tea Drink coffee Feel terrific 70 50 Feel lousy 30 80 There is something wrong with the above, in that the numbers in the cells should:(a) Add up to 150(b) Add up to 100(c) Be equal(d) Be analysed by a 4 × 3 χ2
485 people are asked which of five types of bird pictures they prefer to be put on a ‘stop all wars’ campaign. Results are as follows:What are the expected frequencies for the cells?(a) 79 (b) 97 (c) 485 (d) 5 16 162 84 57 94 94 88
In order to find out the effect size after performing a χ2 analysis, we:(a) convert Cramers V to χ2(b) convert χ2 to Cramers V(c) Square the χ2 value(d) convert χ2 to Fisher’s Z
Look at the following table.This is called a:(a) 2 × 2 contingency table (b) 3 × 2 contingency table (c) 1 × 2 chi square table (d) 2 × 2 chi square table Anxious Dreadful job 210 Wonderful job 62 Not anxious 150 52
The general purpose for which a 2 × 2 χ2 analysis is used is to discover whether:(a) There is a significant association between two categorical variables(b) There is an association between two continuous variables(c) Two groups of participants differ on two variables(d) None of the above
If you are performing a 4 × 4 χ2 analysis and find you have broken the assumptions, then you need to:(a) Look at the results for a Fisher’s exact probability test(b) Look to see whether it is possible to collapse categories(c) Investigate the possibility of a t-test(d) Give up
Parametric one-way independent ANOVA is a generalisation of:(a) The paired t-test(b) The independent t-test(c) χ2(d) Pearson’s r
Which is the most appropriate conclusion?(a) There are statistically significant differences between the three groups of students on ENJOYMENT(b) There are important differences between the three groups but these are not statistically significant(c) There are no statistical or important differences
The following is also given with the above printout:What can you conclude from this?(a) The variances of the groups are significantly different from each other (b) The variances of the groups are similar (c) The variances are heterogeneous (d) None of the above Test of Homogeneity of Variances.
Here are the results for the KNOWLEDGE questionnaire, which the students completed after their one-hour lecture:Which is the most sensible conclusion?(a) There are significant differences between the groups on KNOWLEDGE; specifically, Colin Cashew’s group retained more of the lecture than the
The F-ratio is a result of:(a) Within-groups variance/between-groups variance(b) Between-groups variance/within-groups variance(c) Between-groups variance × within-groups variance(d) Between-groups variance + within-groups variance
The relationship between the F-ratio and t-value is explained by:(a) t3 = F(b) F2 = t(c) t2 = F(d) f 3 = t
Professor P. Nutt is examining the differences between the scores of three groups of participants. If the groups show homogeneity of variance, this means that the variances for the groups:(a) Are similar(b) Are dissimilar(c) Are exactly the same(d) Are enormously different
Differences between groups, which result from our experimental manipulation, are called:(a) Individual differences(b) Treatment effects(c) Experiment error(d) Within-participants effects
Herr Hazelnuss is thinking about whether he should use a related or unrelated design for one of his studies. As usual, there are advantages and disadvantages to both. He has four conditions. If, in a related design, he uses 10 participants, how many would he need for an unrelated design?(a) 40(b)
Individual differences within each group of participants are called:(a) Treatment effects(b) Between-participants error(c) Within-participants error(d) Individual biases
Dr Colin Cashew allots each of 96 participants randomly to one of four conditions.As Colin Cashew is very conscientious, he meticulously inspects his histograms and other descriptive statistics, and finds that his data are perfectly normally distributed. In order to analyse the differences between
The assumption of sphericity means that:(a) The variances of all the sample groups should be similar(b) The variances of the population difference scores should be the same for any two conditions(c) The variances of all the population difference scores should be similar(d) The variances of all the
If, in an analysis of variance, you obtain a partial eta2 of 0.52, then how much of the variance in scores on the dependent variable can be accounted for by the independent variable?(a) 9%(b) 52%(c) 25%(d) 27%
Calculating how much of the total variance is due to error and the experimental manipulation is called:(a) Calculating the variance(b) Partitioning the variance(c) Producing the variance(d) Summarising the variance
The following is output relating to a post-hoc test, after a one-way ANOVA:Which groups differ significantly from each other?(a) Clerical and custodial occupations only (b) Custodial and manager occupations only (c) Manager and clerical occupations only (d) Manager and clerical plus manager and
Look at the following output, which relates to a repeated measures ANOVA with three conditions. Assume sphericity has been violated.Which is the most appropriate statement?The difference between the conditions represented by:(a) F(2,12) = 7.82, p = 0.007 (b) F(1,6) = 7.82, p = 0.030 (c) F(2,12) =
Which is the most appropriate answer? The effect size is:(a) 5.7%(b) 57%(c) 0.57%(d) 5%
Which is the most appropriate statement?(a) F(2,12) = 5.62, p = 0.020(b) F(1,6) = 5.62, p = 0.050(c) F(2,12) = 5.62, p = 0.049(d) F(1,6) = 5.62, p = 0.055
Which two conditions show the largest difference?(a) 1 and 2(b) 2 and 3(c) 1 and 4(d) They are identical
Assuming that the null hypothesis is true, the difference between conditions 1 and 2 has a:(a) 5% chance of arising by sampling error(b) 6% chance of arising by sampling error(c) 19% chance of arising by sampling error(d) 20% chance of arising by sampling error
How would you describe a 2 × 2 × 4 ANOVA?(a) One IV with three conditions(b) One IV with four conditions and one IV with two conditions(c) One IV with four conditions and two IVs with two conditions(d) One IV with 16 conditions
ANOVA is useful for:(a) Teasing out the individual effects of factors on an IV(b) Analysing data from research with more than one IV and one DV(c) Analysing correlational data(d) All of the above
What are the various sources of variance in an ANOVA with two between-participants IVs?(a) Variance attributable to the populations(b) Variance attributable to the two IVs and the error(c) Variance attributable to the two IVs, the interaction between the two IVs and the error(d) Both (a) and (c)
η2 is:(a) A measure of the magnitude of the probability that the effects are due to sampling error(b) A measure of magnitude of effect used with ANOVA(c) A left-wing terrorist organisation(d) Both (a) and (b) above
When generating error bar charts for a study with two IVs, each with two conditions, which combination of options should you select in SPSFW?(a) Simple along with Summaries of groups of cases(b) Simple along with Summaries of separate variables(c) Clustered along with Summaries of groups of
What is the obvious conclusion from this printout?(a) That there is a main effect of AREA and an interaction, which are probably not due to sampling error(b) That there is only an interaction between the two IVs, which is probably not due to sampling error(c) That there are no main effects or
What is the p-value for the main effect of CARBUS?(a) 0.003(b) 9.945(c) 0.101(d) None of the above
How is the F-value for the interaction calculated?(a) 4.900 ÷ 12.100(b) 12.100 ÷ 67.600(c) 67.600 ÷ 1.217(d) None of the above
How much variation in driving errors is accounted for by the interaction between CARBUS and AREA?(a) 93%(b) 5.2%(c) 60.7%(d) 65.9%
Look at the following error bar chart. What would be the sensible conclusion?(a) That there are main effects of the two IVs and an interaction, which are probably not attributable to sampling error (b) That there are no main effects or interactions (c) That there is only one main effect (d) That
How many effects are we comparing against their respective null hypotheses in a 2 × 2 ANOVA?(a) 1 (b) 2 (c) 3 (d) 4
The Mauchley sphericity test is:(a) A test of the assumption that the standard errors of the difference between means of the within-participants variables are equal(b) A test that the data used in ANOVA are rounded in nature(c) A well-known test developed at a well-known London psychiatric
How would you describe a 2 × 3 × 5 × 7 × 7 ANOVA?(a) Sensible(b) An ANOVA with two variables with three conditions, five variables with seven conditions and seven variables with one condition(c) An ANOVA with one variable with two conditions, one variable with three conditions, one variable
What are the sources of variance in a completely within-participants design with two IVs?(a) Main effect of IV1 plus error, main effect of IV2 plus the error, interaction between IV1 and IV2 plus error(b) Main effects of IV1, IV2 and the interaction between these two plus the error(c) Main effects
Partial η2 is:(a) A measure of the power of your analyses(b) Equal to η2(c) Usually much greater than η2(d) A measure of magnitude of effect
What is the definition of a simple effect?(a) The effect of one variable on another(b) The difference between two conditions of one IV at one level of another IV(c) The easiest way to get a significant result(d) All of the above
If you had an MS for your main effect of 12.4 and an MS for the error term of 3.1, what would your F-value be?(a) 6.2(b) 4.1(c) 3.1(d) 4
If you had a completely within-participants design, with each IV having two conditions, how would you examine the simple effects?(a) With independent t-tests, being careful to select the correct participants using the Split File command in SPSSFW(b) With independent t-tests, taking care to adjust
How many effects are we comparing against their respective null hypotheses in a 2 × 2 × 2 ANOVA?(a) 3(b) 5(c) 7(d) 8
If you have a 2 × 2 between-participants design what should be the first step before generating descriptive statistics in SPSSFW?(a) Transform your data(b) Split the data file(c) Conduct t-tests(d) Conduct correlational analyses
The line of best fit:(a) Minimises the distance between the scores and the regression line(b) Is the best of all possible lines(c) Maximises the correlation between x and y(d) All of these
In linear regression, where only one variable predicts y, and F is statistically significant at p = 0.049, then:(a) The value of p for t = 0.049(b) The value of p for t = 0.0245(c) The value of p for t = 0.098(d) Cannot tell
In a linear regression analysis, the residuals are:(a) Actual scores minus the predicted scores(b) Actual scores plus the predicted scores(c) The correlation between the actual and predicted scores(d) None of the above
Marks on MRL would be called:(a) The predictor variable(b) The criterion variable(c) The covariate(d) The constant
The exact probability value of the results having occurred by sampling error, assuming the null hypothesis to be true, is:(a) 0.0000(b) 0.05(c) 4.19978(d) 0.048
b is:(a) 2.049(b) 0.31928(c) 0.01659(d) None of these
a is:(a) 1.75772 (b) 1.5455 (c) 4.19978 (d) 0.01659
How many degrees of freedom would you have where the linear regression scatterplot had only ONE datapoint? (very unrealistic we know . . . )(a) Zero(b) One(c) Two(d) Three
Psychologists use regression mainly to:(a) Assess relationships between variables(b) Use the regression formula for further research(c) Look at differences between groups(d) None of the above
The correlation between credit rating and the other variables is:(a) 0.867(b) 0.752(c) 0.711(d) 1.32
For every one standard deviation rise in previous history rating, credit rating:(a) Decreases by 0.5 of standard deviation(b) Increases by 0.5 of a standard deviation(c) Decreases by 0.3 of a standard deviation(d) Increases by 0.3 of a standard deviation
The predictor variables are called:(a) Credit rating and age(b) Credit rating and previous history rating(c) Previous history and age(d) The criterion variables
The achieved significance level associated with the F-value of 18.182 is:(a) 0.824(b) 0.36(c)
The slope of the line (B) for previous history rating is:(a) 0.514(b) 0.790(c) 0.276(d) 0.571
a is:(a) 0.514(b) 0.790(c) 0.276(d) 0.571
Multicollinearity means:(a) There are high intercorrelations among the predictor variables(b) The predictor variables are positively correlated with the criterion variable(c) The variables show a skewed distribution(d) The variables show a peaked distribution
Kieran wants to perform a standard multiple regression using six explanatory variables.He is only interested in the overall R2. According to Tabachnick and Fidell’s formula, how many participants should he recruit?(a) 98(b) 56(c) 240(d) 120
Saeeda doesn’t know about the necessity for large participant numbers in multiple regression. She’s only got 20 participants in her study, and she has 10 explanatory variables. Which is the most appropriate statement? Compared with an analysis using 100 participants, Multiple R will be:(a)
Which is the most appropriate statement? The explanatory variables predicted(a) 6.5% of the variation in blood pressure(b) 42% of the variation in blood pressure(c) 6.5% of the variation in stress(d) 18% of the variation in age
Which is the most appropriate statement?(a) As stress increased by one standard deviation, blood pressure increased by nearly half a standard deviation(b) As stress increased by one standard deviation, age increased by 0.18 of a standard deviation.(c) As age increased by one year, blood pressure
ANCOVA shows us how likely it is that differences between conditions are due to sampling error, once means have been adjusted for the relationship between:(a) The dependent variable and the covariate(b) The independent variable and the covariate(c) The dependent variable and the independent
ANCOVA adjusts the means on the covariate, so that the mean covariate score is:(a) The same for all groups (c) The same for all participants(b) Different for all groups (d) It depends
The use of ANCOVA is sometimes controversial when:(a) Randomly allocating participants to conditions(b) Assumptions have not been met(c) Using intact groups(d) (b) and (c)
The dependent variable is:(a) Beginning Salary (c) Jobcat(b) Prevexp (d) None of the above
The covariate is:(a) Beginning Salary (c) Jobcat(b) Prevexp (d) None of the above
The difference between the groups is:(a) Unlikely to have occurred by sampling error, assuming the null hypothesis to be true (F(2,470) = 387.806; p < 0.001)(b) Unlikely to have occurred by sampling error, assuming the null hypothesis to be true (F(2,470) = 14.565; p < 0.001)(c) Likely to have
Showing 3100 - 3200
of 5564
First
25
26
27
28
29
30
31
32
33
34
35
36
37
38
39
Last
Step by Step Answers