New Semester
Started
Get
50% OFF
Study Help!
--h --m --s
Claim Now
Question Answers
Textbooks
Find textbooks, questions and answers
Oops, something went wrong!
Change your search query and then try again
S
Books
FREE
Study Help
Expert Questions
Accounting
General Management
Mathematics
Finance
Organizational Behaviour
Law
Physics
Operating System
Management Leadership
Sociology
Programming
Marketing
Database
Computer Network
Economics
Textbooks Solutions
Accounting
Managerial Accounting
Management Leadership
Cost Accounting
Statistics
Business Law
Corporate Finance
Finance
Economics
Auditing
Tutors
Online Tutors
Find a Tutor
Hire a Tutor
Become a Tutor
AI Tutor
AI Study Planner
NEW
Sell Books
Search
Search
Sign In
Register
study help
business
statistics informed decisions using data
Foundations Of Statistics For Data Scientists With R And Python 1st Edition Alan Agresti - Solutions
Considerthestandarderror»π(1 − π)~n of asampleproportion ˆπ of successes in n binary trials.(a) Reportthestandarderrorwhen π = 0 or π = 1. Whywouldthisvaluemakesensetoyou evenifyoudidnotknowthestandarderrorformula?(b) Forfixed n, showthatthestandarderrorisgreatestwhen π = 0.50.
Whensampledata wereusedtorankstatesbybraincancerrates,Ellenberg(2014)noted that thehighestrankingstate(SouthDakota)andthenearlylowestrankingstate(North Dakota)hadrelativelysmallsamplesizes.Also,whenschoolsinNorthCarolinawereranked
Simulatewhatwouldhappenifeveryoneinacollegewith1000studentsflippedafaircoin100 times andobservedtheproportionofheads.Whatdoyougetforthemeanandthestandard deviation ofthe1000proportions?Whataretheirtheoreticalvalues?
Construct a populationdistributionthatisplausiblefor Y = numberofalcoholicdrinksinthe past day.(a) Simulateasinglerandomsampleofsize n = 1000 from thispopulationtoreflectresults of atypicalsamplesurvey.Summarizehowthesamplemeanandstandarddeviation
Usingsoftware,simulatetakingsimplerandomsamplesfromabimodalpopulationdistribu-tion. (Alternatively,youcanuseanappsuchasthe Sampling DistributionfortheSample Mean(ContinuousPopulation) app at www.artofstat.com/web-apps and selectthebimodal populationdistributionwithshape1.)(a)
Using software,simulateformingsampleproportionsforsimplerandomsamplesofsize n = 100 when π = 0.50. (Alternatively,youcanuseanapp,suchasthe Sampling Distributionforthe Sample Proportion app at www.artofstat.com/web-apps.)(a) Simulateonceandreportthecountsandtheproportionsforthetwocategories.Didyou
Inyourschool,supposethatGPAhasanapproximatenormaldistributionwith μ = 3.0, σ = 0.40.Not knowing μ, yourandomlysample n = 25 studentstoestimateit.Usingsimulationfor this application,illustratethedifferencebetweenasampledatadistributionandthesampling distribution of Y .
Toapproximatethemean μ of aprobabilitydistributionthatdescribesarandomphenomenon, yousimulate n observationsfromthedistributionandfind y. Explainhowto assess howclose y is likelytobe to μ.
GenerateamillionindependentPoissonrandomvariableswithparameter(i) μ = 9, (ii) μ =100, (iii) μ = 100000. Showhowtoconstructtransformedvaluesthathaveaboutthesame variabilityineachcase.
SunshineCity,whichattractsprimarilyretiredpeople,has90,000residentswithameanage of 72yearsandastandarddeviationof12years.Theagedistributionisskewedtotheleft.A random sampleof100residentsofSunshineCityhas y = 70 and s = 11.(a) Describethecenter
Atauniversity,60%ofthe7400studentsarefemale.Thestudentnewspaperreportsresultsof a surveyofasimplerandomsampleof50students,18femalesand32males,tostudyalcohol abuse, suchasbingedrinking.(a) Setupavariable Y to representgender,andidentifyitsprobabilitydistributionforthe
andastandarddeviationof1.5.SupposetheCensusBureauinsteadhadestimatedthis mean usingarandomsampleof225homes,andthatsamplehadameanof2.4andstandard deviation of1.4.Describethecenterandspreadofthe(a) populationdistribution,(b) sample data distribution,(c) samplingdistributionofthesamplemeanfor225homes.
AccordingtotheU.S.CensusBureau,thenumberofpeopleinahouseholdhasameanof
AccordingtoaGeneralSocialSurvey,intheUnitedStatesthepopulationdistributionof Y =numberofgoodfriends(notincludingfamilymembers)hasameanofabout5.5andastandard deviation ofabout3.9.(a) Isitplausiblethatthispopulationdistributionisnormal?Explain.(b)
Oneachbetinasequenceofbets,youwin$1withprobability0.50andlose$1(i.e.,win−$1) withprobability0.50.Let Y denote thetotalofyourwinningsandlosingsafter100bets.Giving yourreasoning,statetheapproximatedistributionof Y .
Simulaterandomsamplingfromauniformpopulationdistributionwithseveral n valuesto illustrate theCentralLimitTheorem.
Simulaterandomsamplingfromanormalpopulationdistributionwithseveral n valuesto illustrate thelawoflargenumbers.
Simulatetakingarandomsampleofsize n from aPoissondistributionwith μ = 5. Find y for n = 10, n = 1000, n = 100, 000, and n = 10, 000, 000 to illustrate thelawoflargenumbers.
Refertothepreviousexercise.For n rolls ofthedice,let X = max(y1, y2, ...,yn).(a) Constructthe sampling distributionof X when n = 2.(b) Whatdoyouexpectfortheappearanceofthesamplingdistributionof X when n is large?(If youlike,conductasimulationtoinvestigate.)Thisillustratesthatnoteverystatistic has
speculatedabouttheshapeofthesamplingdistribution of Y for 10rolls.Useasimulation andconstructahistogramtoportraythesampling distribution inthatcase.
Theoutcomeofrollingabalanceddicehasprobability 1~6 for eachof {1, 2, 3, 4, 5, 6}. Let(y1, y2) denotetheoutcomesfortworolls.(a) Enumeratethe36possible(y1, y2) pairs.Treatingthemasequallylikely,constructthe sampling distributionfortheirsamplemean.(b)
Constructthesamplingdistributionofthesampleproportionofheads,forflippingabalanced coin (a) once; (b) twice; (c) three times; (d) four times.Describehowtheshapechanges as thenumberofflips n increases. Whatwouldhappenif n keptgrowing?Why?
Inflippingabalancedcoin n times, areyoumorelikelytohave(i)between40and60heads in 100flips,or(ii)between490and510headsin1000flips?As n increases, explainwhythe proportion of headsconvergestoward1/2(becausethestandarderrorofasample proportion decreases) butthe number of headsneednotbecloseto n~2
ForthePresidentialelectionin2020,ofanexitpollof909votersinthestateofNewYork,64%votedforBidenand36%votedforTrump.Inresponsetothequestion“Isclimatechangea serious problem?”71%ofthosewhovotedforBidenresponded yes and 28%ofthosewhovoted for Trumpresponded yes.
Theexamplein Section 3.1.4 simulatedsamplingdistributionsofthesamplemeantodetermine howprecise Y for n = 25 mayestimateapopulation mean μ.(a) Findthetheoreticalstandarderrorof Y for thescenariovaluesof σ = 5 and 8. Howdo they
TheU.S.JusticeDepartmentandothergroupshavestudiedpossibleabusebypoliceofficers in theirtreatmentofminorities.Onestudy,conductedbytheAmericanCivilLibertiesUnion, analyzed whetherAfrican-Americandriversweremorelikelythanothersinthepopulation to
The49studentsinaclassattheUniversityofFloridamadeblindedevaluationsofpairsof cola drinks.Forthe49comparisonsofCokeandPepsi,Cokewaspreferred29times.Inthe populationthatthissamplerepresents,isthisstrongevidencethatamajorityprefersCoke?Use asimulationofasamplingdistributiontoanswer.
Inanexitpollof1648votersinthe2020SenatorialelectioninArizona,51.5%saidtheyvoted for MarkKellyand48.5%saidtheyvotedforMarthaMcSally.(a) Supposethatactually 50% ofthepopulationvotedforKelly.Ifthisexitpollhadthe propertiesofasimplerandomsample,findthestandarderrorofthesampleproportion votingforhim.(b)
In anexitpollof2123votersinthe2018SenatorialelectioninMinnesota,61.0%saidtheyvoted for theDemocraticcandidateAmyKlobucharinherraceagainsttheRepublicancandidate Jim Newberger.Basedonthisinformation,ifyoucouldtreatthisexitpolllikeasimplerandom sample,
Likethegammadistribution,thelog-normaldistribution(Exercise2.71),theWeibulldistri-bution (Exercise2.72),andtheParetodistibution(Exercise2.73),anotherdistributionfor skewed-rightvariablesisthe Gumbeldistribution, alsocalledthe typeIextreme-valuedis-tribution.
The Paretodistribution, introducedbytheItalianeconomistWilfredoParetoin1909to describe(onappropriatescales)incomeandwealth,isahighlypositively-skeweddistribution that has pdf f(y;α) = α~yα+1 for y ≥ 1 and aparameter α > 0.(a) Showthat f is alegitimate pdf (i.e.,
Likethegammaandlog-normaldistributions,the Weibulldistribution is positivelyskewed overthepositiverealline.Withshapeparameter k > 0 and scaleparameter λ > 0, its cdf is F(y; λ, k) = 1 − e−(y~λ)k for y > 0.(a) Findthe pdf.(b) Showthatthemedian= λ[log(2)]1~k.
When Y has positivelyskeweddistributionoverthepositiverealline,statisticalanalysesoften treat X = log(Y ) as havinga N(μ, σ2) distribution. Then Y is saidtohavethe log-normal distribution.(a) Deriveanexpressionforthe cdf G of Y in termsofthe cdf F of X, andtakethederivative to obtainthe pdf g of
The betadistribution is aprobabilitydistributionover(0,1)thatisoftenusedinapplications for whichtherandomvariableisaproportion.Thebeta pdf isfor parameters α and β, where Γ(⋅) denotes thegammafunction.(a) Showthattheuniformdistributionisthespecialcase α = β = 1.(b) Showthat μ = E(Y ) =
Forasequenceofindependent,identicalbinarytrials,explainwhytheprobabilitydistribution for Y = the numberofsuccessesbeforefailurenumber k occurshasprobabilityfunctionThis distribution,studiedfurtherin Section 7.5.2 for analyzingcountdata,iscalledthe neg-ative binomialdistribution. (y;k, ) = ( + k 1
Apopulationhas F females and M males. Forarandomsampleofsize n without replacement, explain whythe pmf for Y = numberoffemalesinthesampleisThis is called the hypergeometricdistribution. Itisanalternativetothebinomialforwhich
For n observations {yi}, let y(1) ≤ y(2) ≤ ⋯ ≤ y(n) denote theirorderedvalues,called order statistics. Let qi bethe i~(n + 1) quantileofthestandardnormaldistribution,for i = 1. ...,n. When {yi} are arandomsamplefromanormaldistribution,theplotofthepoints(q1, y(1)), ..., (qn, y(n)) should
Momentsofadistributioncanbederivedbydifferentiatingthe moment generatingfunction(mgf ), m(t) = EetY .This functionprovidesanalternativewaytospecifyadistribution.(a) Showthatthe kth derivative m(k)(t) = EY ketY , andhence m′(0) = E(Y ) and m′′(0) =E(Y 2).(b) Showthatthe mgf is m(t) = 1
Foruncorrelatedrandomvariables U, V , and W, let X = U + V and Y = U +W.(a) Showthatcov(X,Y ) = var(U) and(b) Forsomescaling,suppose X = math achievementtestscore, Y = verbalachievementtest score, U = intelligence(e.g.,IQ), V = time studyingmath, W = time studyingverbal.Explain howcorr(X,Y )
Boundsforthecorrelation:(a) Considerrandom variables X and Y and theirstandardizedvariables Zx and Zy. Using the equationsfromthepreviousexerciseandtherelationbetweenthecorrelationand covariance,showthatvar(Zx +Zy) ≥ 0 implies thatcorr(X,Y ) ≥ −1 and var(Zx −Zy) ≥ 0 implies28 corr(X,Y )
Considertworandomvariables X and Y :(a) Showthatvar(X + Y ) = var(X) + var(Y ) + 2cov(X,Y ).(b) Showthatvar(X − Y ) = var(X) + var(Y ) − 2cov(X,Y ).(c) Showhow(a)and(b)simplifywhen X and Y are uncorrelated.
Forindependentbinom(1, π) random variables X and Y , let U = X + Y and V = X − Y . Find the jointprobabilitydistributionof U and V . Showthat U and V are uncorrelatedbutnot independent.
ContructanexampleofaMarkovchain,andusesimulationtorandomlygenerate100values from it.PlotthesequenceanddescribehowtheMarkovpropertyaffectstheplot.
For n coin-flip betsasdescribedin Section 2.6.7, let pn denote theproportionof t between1 and n for whichthetotalwinnings Yt at time t is positive.(a) With n = 100, simulatethisMarkovchainafewtimes,eachtimeshowingaplotof(y1, y2, ...,y100) and reporting pn.(b)
Explainhowaboardgameusingdice,suchas“SnakesandLadders,”hasasequenceofoutcomes that satisfiestheMarkovproperty.
Abalancedcoinisflippedtwice.Let X denote theoutcomeofthefirstflipand Y denote the outcomeofthesecondflip,representing head by1and tail by0.Supposetheflipsare independent.(a) Let Z indicate whetherbothflipshadthesameresult,with z = 1 for yes and z = 0 for no.Showthat X and Z are independent.(b)
Let (Y1, Y2, ...,Yc) denote independentPoissonrandomvariables,withparameters(μ1,μ2, ...,μc).(a) Explainwhythejointprobabilitymassfunctionfor {Yi} is cΠi=1[exp(−μi)μyi i ~yi!]for allnonnegativeintegervalues (y1, y2, ...,yc).(b) Section 3.2.6 explains thatthesum n = Σi Yi also
Consider the multinomialdistribution(2.14)with c = 3 categories.(a) Explainwhythemarginaldistributionof Y1 is binomial.Basedonthis,report E(Y1) and var(Y1).(b) Are Y1 and Y2 independentrandomvariables?Whyorwhynot?
Supposethatconditionalon λ, thedistributionof Y is Poissonwithmeanparameter λ, but λitself variesamongdifferentsegmentsofapopulation,with μ = E(λ). Usethelawofiterated expectationtofind E(Y ).
Reviewtheresultaboutthe“probabilityintegraltransformation”in Section 2.5.7. Foracontin-uous randomvariable Y with cdf F, findtheprobabilitydistributionoftheright-tailprobability X = 1 − F(Y ). (We’lllearntherelevanceofthiswhen Chapter 5 introduces P-values.)
If Y is astandardnormalrandomvariable,with cdf Φ, whatistheprobabilitydistribution of X = Φ(Y )? Illustratebyrandomlygeneratingamillionstandardnormalrandomvariables, applying the cdf function Φ() to each,andplottinghistogramsofthe(a) y values,(b) x values.
The pdf f of a N(μ, σ2) distribution canbederivedfromthestandardnormal pdf ϕ shownin equation (2.9).(a) Showthatthenormal cdf F relates tothestandardnormal cdf Φ by F(y) = Φ[(y−μ)~σ].(b) From(a),showthat f(y) = (1~σ)ϕ[(y − μ)~σ], andshowthisisequation(2.8).
By Jensen’sinequality, convexfunctionssatisfy E[g(Y )] ≥ g[E(Y )]. Usethistoprovethat for concavefunctions, E[g(Y )] ≤ g[E(Y )]. Applytheappropriatecasesto log(Y ) and 1~Y for a positively-valuedrandomvariable Y .
The Markov inequality states thatwhen P(Y ≥ 0) = 1, then P(Y ≥ t) ≤ E(Y )~t.(a) When Y is discreteoverthenonnegativeintegers,provethisbyexplainingwhy E(Y ) ≥Σy≥t yf(y) ≥ Σy≥t tf(y) = tP (Y ≥ t).(b) If X is anyrandomvariablewithmean μ and variance σ2, applytheMarkovinequality
Section 2.4.5 showedthatforabinom(n, π) randomvariable,thesampleproportion ˆπ has standard deviation»π(1 − π)~n. Usethistoexplainwhy ˆπ tends tobecloserto π as n increases.Thus,intherainsimulationin Section 2.1.1, therelativefrequencyforaparticularoutcome convergesas n increases
Aprobabilitydistributionhasa scaleparameter θ if, whenyoumultiply θ byaconstantc, all valuesinthedistributionmultiplybyc. Ithasa locationparameter θ if, whenyouincrease θbyaconstantc, allvaluesinthedistributionincreaseby c.(a) Forascaleparameter θ, thedistributionof Y ~θ doesnotdependon θ.
Whenaprobabilityfunctionissymmetricanditsmomentsexist,explainwhy E(Y − μ)3 = 0, so theskewnesscoefficient=0.
Section 2.5.5 showedthatthewaitingtime T for thefirstoccurrenceofaPoissonprocesshas the exponentialdistributionwithparameter λ. Forthisdistribution,showthat P(T > u + t S T > u) = P(T > t). Bythis memoryless property,ifaneventhasnotoccurredbytime u, the additional
Reparameterizingthegamma distribution byreplacing λ by k~μ, showthat f(y; k,μ) =(k~μ)kΓ(k) e−ky~μyk−1, y ≥ 0 (2.17)For this parameterization,showthattheexpressionsin(2.11)simplifyto E(Y ) = μ and σ =μ~ºk. So,forfixed k, asthe mean grows,sodoesthestandarddeviation.Thisisthecasein
Forthegamma pdf (2.10), find E(Y 2) and useittogetherwith μ = k~λ to findvar(Y ).
Considertheexponential pdf f(y; λ) = λe−λy and cdf F(y; λ) = 1 − e−λy, for y ≥ 0.(a) Findthemedian.(b) Findthelowerquartileandtheupperquartile.(c) Find μ byshowingthatitequals 1~λ times theintegralofagamma pdf. Explainwhy μis greaterthanthemedian.(d) Find σ byfinding E(Y 2) using
Showthatthebinomialprobabilitymassfunction(2.6)convergestothePoissonwhenyou substitute π = μ~n and let n → ∞ with μ fixed.
Useformula(2.8)forthenormal pdf to showthatthe pdf is symmetric.
Let Y beyourwaitingtimeinalineatagrocerystore.Let Y1, Y2, ...bethewaitingtimesof other people.Let N = the numberofpeoplethatmustbeinlinesatthestoreuntilsomeonehas to waitlongerthanyou.Ifthewaitingtimesareindependentandhavethesamecontinuous probabilitydistribution,explainwhy(a) P(N > n) = P(Y >
ForthePoissondistribution,showthat E[Y (Y −1)] = μ2. Usethistoshowthat E(Y 2) = μ+μ2 and thusvar(Y ) = μ.
Forageometricrandomvariablewithprobabilityfunction(2.1),showthat(a) the cdf is F(y) = 1 − (1 − π)y for y = 1, 2, ...; (b) E(Y ) = 1~π.
Forindependentobservationswithprobabilityofsuccess π on each,specifytheprobability mass functionof Y = numberoffailuresuntilthefirstsuccess.27
Let X beauniformdistributionover [L,U] with L < U.(a) Specifythe pdf of X and find E(X).(b) From Section 2.3.3, auniformrandomvariable Y over[0,1]hasmean1/2andstandard deviation 1~º12. Express X as alinearfunction of Y and usethisrelationandresultsin Section 2.3.5
Althoughanobservationofacontinuousrandomvariableisaparticularvalue,explainwhy eachpossiblevaluehasprobability0.Justifythisinthecontextoftherelativefrequency interpretationofprobability.
Ifevents A and B are independent,thenare A and Bc independent,ordependent?Showwhich is thecase.
Fordiscreterandomvariables X and Y , suppose P(Y = y S X = x) = P(Y = y) for allpossible values x of X and y of Y . Showthat P(X = x S Y = y) = P(X = x) for allthosevalues.
Onamultiple-choiceexam,with k possibleresponsesforeachquestion,astudentknowsthe answerwithprobability π and hastoguesstheanswerrandomlywithprobability (1−π). Given that astudentcorrectlyanswersaquestion,findtheprobabilitytheytrulyknewtheanswer.Evaluatetheexpressionyouderivewhen k = 5 and π is
For continuousrandomvariables,formulateaversionofBayes’Theoremtoobtain f(x S y)from thefunctions f(y S x) and f1(x).
Fordiscreterandomvariables X and Y , derivethefollowinggeneralizationofBayes’Theorem(Section 2.1.5):P(X = x S Y = y) = P(Y = y S X = x)P(X = x)Σa P(Y = y S X = a)P(X =a) , where thedenominatorsumisover allthepossiblevalues a for X. Statethecorresponding result for P(Bj S A) for anevent A and
De Morgan’slaw states, forthecaseoftwoevents, (A∪B)c = AcBc. ShowthiswithaVenn diagram, andexplainhowthelawgeneralizesto p events A1, ...,Ap.
Showthe rule oftotalprobability: Ifasamplespace S partitions intodisjointevents B1, ...,Bc (the unionofwhichis S), then P(A) = P(A S B1)P(B1) + ⋯+ P(A S Bc)P(Bc).
Thedistributionof X = heights(cm) ofwomenintheU.K.isapproximately N(162, 72).Conditional on X = x, suppose Y = weight(kg) hasa N(3.0 + 0.40x, 82) distribution. Simulate and plot1000observationsfromthisapproximatebivariatenormaldistribution.Approximate the marginalmeansandstandarddeviationsfor X and
Referto Table2.4 crossclassifyinghappinesswithfamilyincome.(a) Findandinterpretthecorrelationusingscores(i)(1,2,3)foreachvariable,(ii)(1,2,3)for familyincomeand(1,4,5)forhappiness.(b) Constructthejointdistributionthathasthesemarginaldistributionsandexhibitsinde-pendenceof X and Y .
Fortheexamplein Section 2.7.4 in whichamidtermexamscore X has a N(70, 102) distribution and theconditionaldistributionofthefinalexamscore Y given X = x is N(70+0.60(x−70), 62), use theformula E(Y ) = E[E(Y S X)] to find E(Y ).
Considerthejurylistexamplein Section 2.6.4, butwith (π1, π2, π3) = (0.25, 0.25,0.50)for(Hispanic, African-American,White).(a) With n = 12, theexpectedcountsare(3,3,6).Usethemultinomialdistributiontofind the probabilityofthisresult.(b)
The Afterlife data fileatthebook’s websitecontainsdatafromthe2018GeneralSocial Surveyonpostlife = beliefintheafterlife(1 = yes,2 = no) andreligion(1 = Protestant,2 =Catholic, 3 = Jewish, othercategoriesexcluded).Usingthesedata,formacontingencytable and
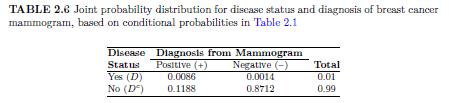
Considerthemammogramdiagnosticexamplein Section 2.1.4.(a) Showthatthejointprobabilitydistributionofdiagnosisanddiseasestatusisasshownin Table2.6. Giventhatadiagnostictestresultispositive,explainhowthisjointdistribution showsthatthe12%ofincorrectdiagnosesforthe99%ofwomennothavingbreastcancer
Plotthegammadistributionbyfixingtheshapeparameter k = 3 and settingthescaleparameter= 0.5, 1,2,3,4,5.Whatistheeffectofincreasingthescaleparameter?(SeealsoExercise2.48.)
Createadatafilewiththeincomevaluesinthe Income data fileatthetextwebsite.(a) Constructahistogramorasmooth-curveapproximationforthe pdf of incomeinthe correspondingpopulationbyplottingresultsusingthe density function in R (explained in Exercise1.18).(b)
LakeWobegonJuniorCollegeadmitsstudentsonlyiftheyscoreabove400onastandardized achievementtest.ApplicantsfromgroupAhaveameanof500andastandarddeviationof 100 onthistest,andapplicantsfromgroupBhaveameanof450andastandarddeviationof 100.
(iii) 0.05.(b) Findthe z-valuesuchthatforanormaldistributiontheintervalfrom μ − zσ to μ + zσcontainsprobability (i) 0.90, (ii) 0.95, (iii) 0.99.(c) Findthe z-valuessuchthat μ + zσ is the (i) 75th, (ii) 95th, (iii) 99th percentileofa normal distribution.(d) Showthattheupperquartileequals μ
(ii)
Normalprobabilitiesandpercentiles:(a) Findthe z-valueforwhichtheprobabilitythatanormalvariableexceeds μ + zσ equals(i)
AninstructorgivesacoursegradeofBtostudentswhohavetotalscoreonexamsandhome-worksbetween800and900,wherethemaximumpossibleis1000.Ifthetotalscoreshave approximatelyanormaldistributionwithmean830andstandarddeviation50,aboutwhat proportionofthestudentsreceiveaB?
Eachdayahospitalrecordsthenumberofpeoplewhocometotheemergencyroomfortreat-ment.(a) Inthe first week,theobservationsfromSundaytoSaturdayare10,8,14,7,21,44,60.Do youthinkthatthePoissondistributionmightdescribetherandomvariabilityofthis phenomenon adequately.Whyorwhynot?(b)
Eachweekaninsurancecompanyrecords Y = numberofpaymentsbecauseofahomeburning down.Stateconditionsunderwhichwewouldexpect Y to approximatelyhaveaPoisson distribution.
ToassessthepopularityoftheprimeministerinItaly,eachofseveralsamplesurveystakesa simple randomsampleof1000peoplefromthepopulationof40millionadultsinItaly.(a) With10surveys,findtheprobabilitythatnonesampleaparticularperson,Vincenzoin the villageofFerrazzanointheregionofMolise.(b)
Inhisautobiography A SortofLife, BritishauthorGrahamGreenedescribedaperiodofsevere mentaldepressionduringwhichheplayedRussianroulette—puttingabulletinoneofthesix chambersofapistol,spinningthechamberstoselectoneatrandom,andthenfiringthepistol once athishead.(a)
+ 0.05? (ii) number of successfulfreethrowsisbetween 0.80n − 5 and 0.80n + 5? Explainyouranswers.
and
−
ofmaking(i)thatmanyfreethrows,(ii)thatproportionoffreethrows.Stateany assumptions youmake.(b) Whentheplayerattempts n free throws,as n increases, wouldyouexpecttheprobability to increase,ortodecrease,thatthe (i) proportion of successfulfreethrowsisbetween
Abasketballplayerhasprobability0.80ofmakinganyparticularfreethrow(astandardized shot taken15feetfromthebasket).(a) Foraseasonwith200freethrowattempts,usethemeanandstandarddeviationofa binomial distributiontostateanintervalwithinwhichtheplayerhasprobabilityabout
(and thusclosetoasymmetric,bellshape)requires n > 25.
Showthatforthebinomialdistributiontohaveabsolutevalueoftheskewnesscoefficient < c for anyparticular c > 0 requires n > (1 − 2π)2~c2π(1 − π). Showthatwhen π = 0.20, having skewness
Showing 2800 - 2900
of 5564
First
22
23
24
25
26
27
28
29
30
31
32
33
34
35
36
Last
Step by Step Answers