New Semester
Started
Get
50% OFF
Study Help!
--h --m --s
Claim Now
Question Answers
Textbooks
Find textbooks, questions and answers
Oops, something went wrong!
Change your search query and then try again
S
Books
FREE
Study Help
Expert Questions
Accounting
General Management
Mathematics
Finance
Organizational Behaviour
Law
Physics
Operating System
Management Leadership
Sociology
Programming
Marketing
Database
Computer Network
Economics
Textbooks Solutions
Accounting
Managerial Accounting
Management Leadership
Cost Accounting
Statistics
Business Law
Corporate Finance
Finance
Economics
Auditing
Tutors
Online Tutors
Find a Tutor
Hire a Tutor
Become a Tutor
AI Tutor
AI Study Planner
NEW
Sell Books
Search
Search
Sign In
Register
study help
business
statistics informed decisions using data
Statistics Informed Decisions Using Data 5th Global Edition Michael Sullivan - Solutions
Number of hands folded by a player in a poker game Determine whether the quantitative variable is discrete or continuous.
Percentage of a car’s surface which is rusted Determine whether the quantitative variable is discrete or continuous.
Distance between sides of a street Determine whether the quantitative variable is discrete or continuous.
Air pressure in pounds per square inch in an automobile tire Determine whether the quantitative variable is discrete or continuous.
Birth order among siblings in a family Determine the level of measurement of each variable.
Favorite movie Determine the level of measurement of each variable.
Ages of children: 4 years, 5 years, 6 years, 7 years, and 8 years Determine the level of measurement of each variable.
Monthly temperatures: 63°F, 68°F, 73°F, 78°F, and 83°F Determine the level of measurement of each variable.
A polling organization contacts 2141 male university graduates who have a white-collar job and asks whether or not they had received a raise at work during the past 4 months.A research objective is presented. For each, identify the population and sample in the study.
A quality-control manager randomly selects 70 bottles of ketchup that were filled on July 17 to assess the calibration of the filling machine.A research objective is presented. For each, identify the population and sample in the study.
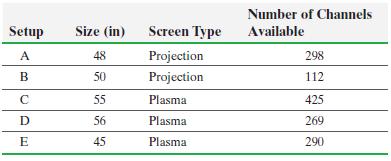
The following data relate to the characteristics of high-definition televisions A through E.Identify the individuals, variables, and data corresponding to the variables. Determine whether each variable is qualitative, continuous, or discrete. Number of Channels Setup Size (in) Screen Type Available
A study conducted by researchers was designed “to determine if application of duct tape is as effective as cryotherapy in the treatment of common warts.” The researchers randomly divided 70 patients into two groups. The 35 patients in group 1 had their warts treated by applying duct tape. The
Satisfaction level and Diabetes Researchers wanted to determine if there was an association between the level of satisfaction of an individual and their risk of diabetes. The researchers studied 1678 people over the course of 8 years.During this 8-year period, they interviewed the individuals and
Researchers wanted to determine if there was an association between daily pomegranate consumption and the occurrence of high cholesterol. The researchers looked at 94,059 women and asked them to report their pomegranate-eating habits. The researchers also determined which of the women had high
A web page design firm has two designs for an online hardware store. To determine the more effective design, the firm uses one page with only teenage visitors and a second page with only adult visitors. For each visit, the firm records the amount spent by the visitor and the number of items
Sophia has four tickets to a concert. Six of her friends, Yolanda, Michael, Kevin, Marissa, Annie, and Katie, have all expressed an interest in going to the concert. Sophia decides to randomly select three of her six friends to attend the concert.(a) List all possible samples of size n = 3 from the
The accounting firm of Senese and Associates has grown. To make sure their clients are still satisfied with the services they are receiving, the company decides to send a survey out to a simple random sample of 5 of its 30 clients.Approach Step 1 The clients must be listed (the frame) and numbered
Find a simple random sample of five clients for the problem presented in Example 2.Approach The approach is similar to that given in Example 2.Step 1 Obtain the frame and assign the clients numbers from 01 to 30.Step 2 Randomly select five numbers using a random number generator. To do this, we
Course Selection A student entering a doctoral program in educational psychology is required to select three courses from the list of courses provided as part of his or her program.EPR 639, Interpretive Methods in Educational Research EPR 627, Methods of Multivariate AnalysisEPR 630, Theory of
The president of DePaul University wants to conduct a survey to determine the community’s opinion regarding campus safety. The president divides the DePaul community into three groups: resident students, nonresident (commuting) students, and staff (including faculty) so that he can obtain a
The manager of Kroger Food Stores wants to measure the satisfaction of the store’s customers. Design a sampling technique that can be used to obtain a sample of 40 customers.Approach A frame of Kroger customers would be difficult, if not impossible, to obtain. Therefore, it is reasonable to use
A sociologist wants to gather data regarding household income within the city of Boston. Obtain a sample using cluster sampling.Approach The city of Boston can be set up so that each city block is a cluster. Once the city blocks have been identified, obtain a simple random sample of the city blocks
Systematic Sample The human resource department at a certain company wants to conduct a survey regarding worker benefits. The department has an alphabetical list of all 5746 employees at the company and wants to conduct a systematic sample.(a) Determine k if the sample size is 70.(b) Determine the
For a poll of voters regarding a referendum calling for a national value-added tax, design a sampling method to obtain the individuals in the sample. Be sure to support your choice. Which sampling method would most likely be used in a poll of voters regarding a referendum calling for a national
A pharmaceutical company wants to conduct a survey of 40 individuals who have high cholesterol. The company has obtained a list from primary care physicians throughout the country of 6000 individuals who are known to have high cholesterol. Design a sampling method to obtain the individuals in the
The owner of a shopping mall wishes to expand the number of shops available in the food court. He has a market researcher survey the first 100 customers who come into the food court during lunch to determine what types of food the shoppers would like to see added to the food court.The survey has
An abortion rights advocate wants to estimate the percentage of people who favour opening abortion clinics. She conducts a nationwide survey of 1680 randomly selected adults 18 years and older. The interviewer asks the respondents, “Do you favor supporting women’s rights by keeping abortion
A polling organization conducts a study to estimate the percentage of households that have both parents sharing equally in household chores. It mails a questionnaire to 1228 randomly selected households across the country and asks the head of each household if both parents are equally involved in
Suppose you are conducting a survey regarding violence in hockey in a youth hockey league. You obtain a cluster sample of 10 hockey teams within a youth hockey league and sample all hockey players in the randomly selected hockey teams. The survey is administered by the coaches.
Surveys tend to suffer from low response rates. Based on past experience, a researcher determines that the typical response rate for an e-mail survey is 30%. She wishes to obtain a sample of 300 respondents, so she e-mails the survey to 2000 randomly selected e-mail addresses. Assuming the response
Consider the two questions shown below.(a) What is your favorite sport?(b) How much fruit do you eat in a week?Will the order in which the questions are asked affect the survey results? If so, what can the pollster do to alleviate this response bias?
A poll is being conducted on a college campus to obtain a sample of the population of an entire country.What is the frame for this type of sampling? Who would be excluded from the survey and how might this affect the results of the survey?
Suppose a surveyor wants to conduct a phone survey about a new car. She plans to take a simple random sample. However, some people do not want to participate. Do you believe this can affect the ability of the surveyor to obtain accurate polling results? If so, how?
During every election in a particular region, pollsters conduct exit polls to help determine which candidate people voted for. During the most recent election, pollsters incorrectly predicted candidate A the winner over candidate B. When asked how this error could have happened, the pollsters cited
Lipitor is a cholesterol-lowering drug made by Pfizer. In the Collaborative Atorvastatin Diabetes Study (CARDS), the effect of Lipitor on cardiovascular disease was assessed in 2838 subjects, ages 40 to 75, with type 2 diabetes, without prior history of cardiovascular disease. In this
A farmer wishes to determine the optimal level of a new fertilizer on his soybean crop. Design an experiment that will assist him.Approach Follow the steps for designing an experiment.
An educational psychologist wants to determine whether listening to music has an effect on a student’s ability to learn. Design an experiment to help the psychologist answer the question.Approach We will use a matched-pairs design by matching students according to IQ and gender (just in case
Suppose that the 60 soybean plants were actually two different varieties: 30 Chemgro soybean plants and 30 Pioneer soybean plants and that the two varieties have different yields. Design an experiment that could be used to measure the effect of level of fertilizer while taking into account the
To help assess student learning in her music theory courses, a music professor at a community college implemented pre- and post-tests for her music theory students.A knowledge-gained score was obtained by taking the difference of the two test scores.(a) What type of experimental design is this?(b)
A physician wanted to compare two types of pain relief. One is medication and the other is using pressure points. To test whether medication relieves pain faster, they have 10 migraine sufferers compare both types of pain relief and record their observations on a standardized scale. A coin flip was
Designing an Experiment Researchers wish to know if there is a link between hypertension (high blood pressure) and consumption of sugar. Past studies have indicated that the consumption of fruits offsets the negative impact of sugar consumption. It is also known that there is quite a bit of
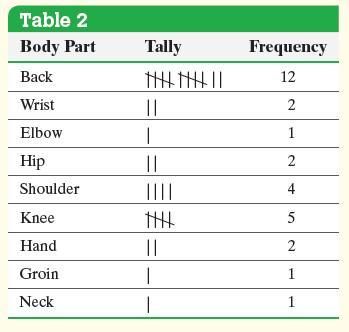
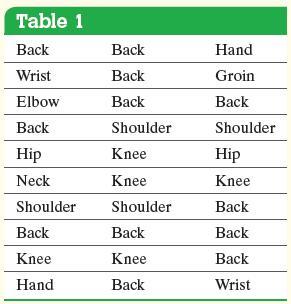
A physical therapist wants to determine types of rehabilitation required by her patients. To do so, she obtains a simple random sample of 30 of her patients and records the body part requiring rehabilitation. See Table 1. Construct a frequency distribution of location of injury.Approach To
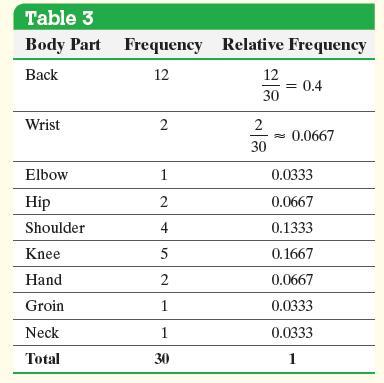
Using the summarized data in Table 2, construct a relative frequency distribution.Approach Add all the frequencies, and then use Formula (1) to compute the relative frequency of each category of data.Formula 1 Table 2 Body Part Tally Frequency Back 12 Wrist 2 Elbow | 1 Hip || 2 Shoulder |||| 4 Knee
Use the data summarized in Table 3 to construct a frequency bar graph and a relative frequency bar graph.Approach Use a horizontal axis to indicate the categories of the data (body parts) and a vertical axis to represent the frequency or relative frequency. Draw rectangles of equal width to the
Use a statistical spreadsheet to construct a frequency or relative frequency bar graph for the data in Example 1.Approach We will use Excel to construct the frequency and relative frequency bar graphs. The steps for constructing the graphs using Minitab, Excel, and StatCrunch are given in the
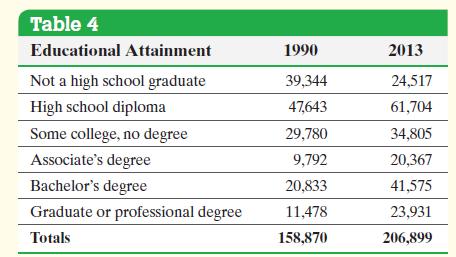
The data in Table 4 represent the educational attainment in 1990 and 2013 of adults 25 years and older who are residents of the United States. The data are in thousands. So 39,344 represents 39,344,000.(a) Draw a side-by-side relative frequency bar graph of the data.(b) Make some general
The data presented in Table 6 represent the educational attainment of residents of the United States 25 years or older in 2013, based on data obtained from the U.S. Census Bureau. The data are in thousands. Construct a pie chart of the data.Approach The pie chart will have one part or sector
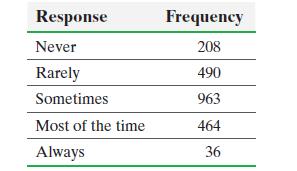
A national survey asked people, “How often do you have dinner outside instead of at home?” The frequencies were as follows.(a) Construct a relative frequency distribution.(b) What percentage of respondents answered “Always”?(c) What percentage of respondents answered “Never” or
An airline offers discounted flights from Atlanta to five American cities. Below is a frequency distribution of the number of tickets purchased for each location based on a random sample of purchased tickets.(a) Construct a relative frequency distribution of the data.(b) What proportion of tickets
On the basis of a population survey, there were 85.2 million males and 92.4 million females aged 25 years old or older in a certain country. The educational attainment of the males and females is shown in the accompanying table.(a) Construct a relative frequency distribution for males.(b) Construct
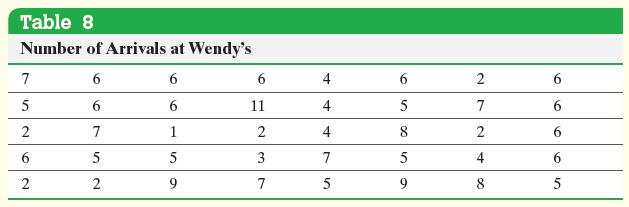
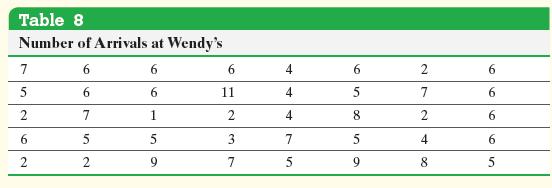
The manager of a Wendy’s fast-food restaurant wants to know the typical number of customers who arrive during the lunch hour. The data in Table 8 represent the number of customers who arrive at Wendy’s for 40 randomly selected 15-minute intervals of time during lunch. For example, during one
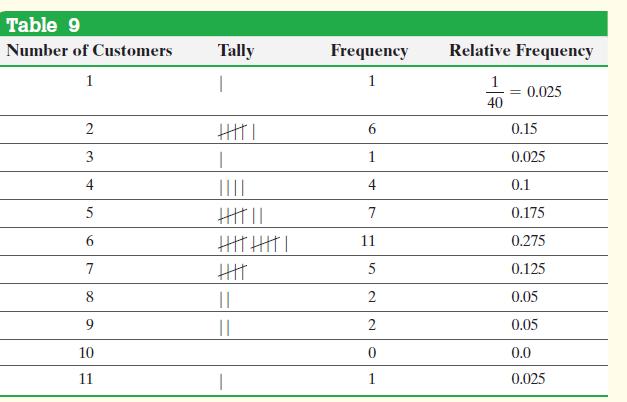
Construct a frequency histogram and a relative frequency histogram using the data in Table 9.Approach The value of each category of data (number of customers) is on the horizontal axis and the frequency or relative frequency is on the vertical axis. Draw rectangles of equal width centered at the
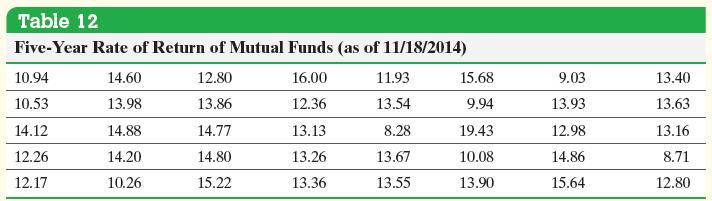
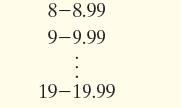
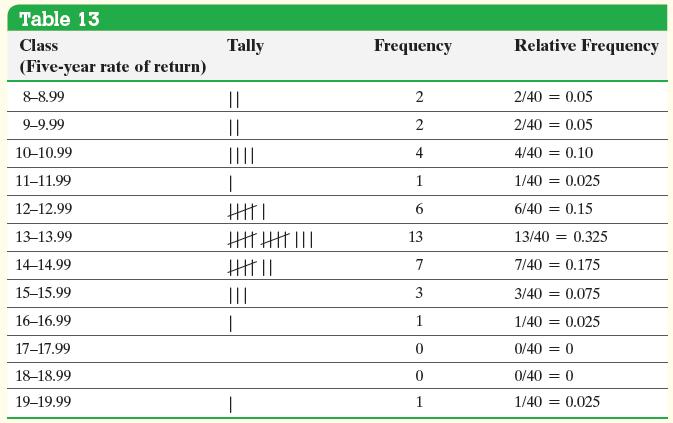
Suppose you are considering investing in a Roth IRA. You collect the data in Table 12, which represent the five-year rate of return (in percent, adjusted for sales charges) for a simple random sample of 40 large-blended mutual funds. Construct a frequency and relative frequency distribution of the
Construct a frequency and relative frequency histogram of the five-year rate of- return data discussed in Example 3.Approach To draw the frequency histogram, use the frequency distribution in Table 13. First, label the lower class limits of each class on the horizontal axis. Then, for each class,
Construct a frequency and relative frequency histogram of the five-year rate of- return data discussed in Example 3.Approach We will use StatCrunch to construct the frequency and relative frequency histograms. The steps for constructing the graphs using the TI-83/84 Plus graphing calculators,
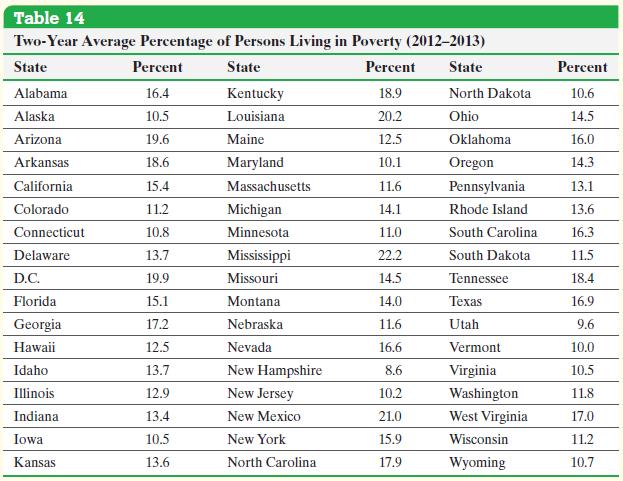
The data in Table 14 represent the two-year average percentage of persons living in poverty, by state, for the years 2012–2013. Draw a stem-and-leaf plot of the data.Approach Step 1 Treat the integer portion of the number as the stem and the decimal portion as the leaf. For example, the stem for
Construct a stem-and-leaf plot of the poverty data discussed in Example 6.Approach We will use Minitab. The steps for constructing the graphs using Minitab or StatCrunch are given in the Technology Step-by-Step.The TI graphing calculators and Excel are not capable of drawing stem-and-leaf
Draw a dot plot for the number of arrivals at Wendy’s data from Table 8.Approach The smallest observation in the data set is 1 and the largest is 11. Write the numbers 1 through 11 horizontally. For each observation, place a dot above the value of the observation. Table 8 Number of Arrivals at
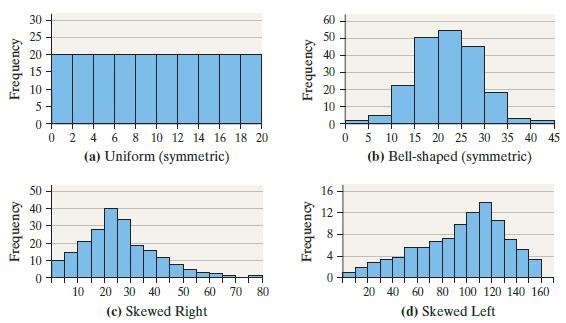
Figure 16 displays the histogram obtained in Example 4 for the five-year rate of return for large-blended mutual funds. Describe the shape of the distribution.Approach We compare the shape of the distribution displayed in Figure 16 with those in Figure 15.Figure 15Data from Example 4Construct a
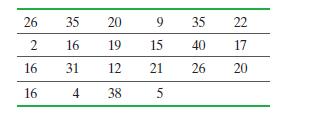
The following data represent the number of grams of fat in breakfast meals offered at a local fast food restaurant.(a) construct a stem-and-leaf plot and(b) describe the shape of the distribution. 26 35 20 9 35 22 2 16 19 15 40 17 16 31 12 21 26 20 16 4 38 5
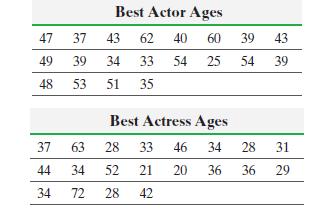
The following data represent the ages of award winners for best actor and best actress in a leading role for the 20 years from 1985 to 2004.(a) Construct an ordered back to back stem-and-leaf display.(b) Compare the two populations. What can you conclude from the back to back stem-and-leaf display?
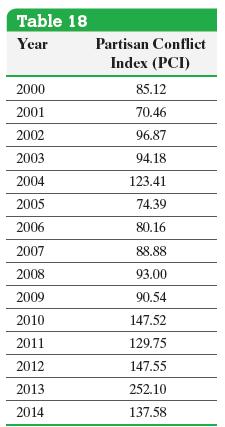
The Partisan Conflict Index (PCI) tracks the degree of political disagreement among U.S. politicians in the federal government. It is found by measuring the frequency of newspaper articles reporting disagreement in a given month. Higher values of the index suggest greater conflict among political
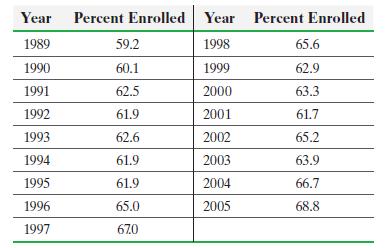
The accompanying data represent the percentage of recent high school graduates (graduated within 12 months before the given year-end) who enrolled in college in the fall. Construct a time-series plot and comment on any trends. Year Percent Enrolled Year Percent Enrolled 1989 59.2 1998 65.6 1990
Which do you prefer: histograms, stem-and-leaf plots, or frequency polygons? Be sure to support your opinion. Are there circumstances in which one might be preferred over another?
Showing 5500 - 5600
of 5564
First
42
43
44
45
46
47
48
49
50
51
52
53
54
55
56
Step by Step Answers