New Semester
Started
Get
50% OFF
Study Help!
--h --m --s
Claim Now
Question Answers
Textbooks
Find textbooks, questions and answers
Oops, something went wrong!
Change your search query and then try again
S
Books
FREE
Study Help
Expert Questions
Accounting
General Management
Mathematics
Finance
Organizational Behaviour
Law
Physics
Operating System
Management Leadership
Sociology
Programming
Marketing
Database
Computer Network
Economics
Textbooks Solutions
Accounting
Managerial Accounting
Management Leadership
Cost Accounting
Statistics
Business Law
Corporate Finance
Finance
Economics
Auditing
Tutors
Online Tutors
Find a Tutor
Hire a Tutor
Become a Tutor
AI Tutor
AI Study Planner
NEW
Sell Books
Search
Search
Sign In
Register
study help
mathematics
applied calculus
Applied Calculus 6th Edition Deborah Hughes Hallett, Patti Frazer Lock, Andrew M. Gleason, Daniel E. Flath, Sheldon P. Gordon, David O. Lomen, David Lovelock, William G. McCallum, Brad G. Osgood, Andrew Pasquale - Solutions
The marginal cost and marginal revenue of a company are MC(q) = 0.03q2 − 1.4q + 34 and MR(q) = 30, where q is the number of items manufactured. To increase profits, should the company increase or decrease production from each of the following levels?(a) 25 items (b) 50 items (c) 80 items
Substitute t = 0, 10, 20,…, 70 into the exponential function used in this section to model the US population 1790–1860. Compare the predicted values of the population with the actual values.
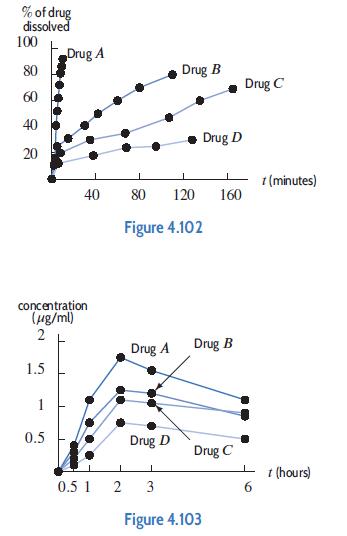
Figure 4.102 shows a graph of the percentage of drug dissolved against time for four tetracycline products A, B, C, and D. Figure 4.103 shows the drug concentration curves for the same four tetracycline products. Discuss the effect of dissolution rate on peak concentration and time to reach peak
Graph a function with the given properties.Has local and global minimum at x = 3, local and global maximum at x = 8.
Use the first derivative to find all critical points and use the second derivative to find all inflection points. Use a graph to identify each critical point as a local maximum, a local minimum, or neither.f(x) = x2 − 5x + 3
(a) Use the derivative to find all critical points.(b) Use a graph to classify each critical point as a local minimum, a local maximum, or neither.f(x) = x5 − 15x3
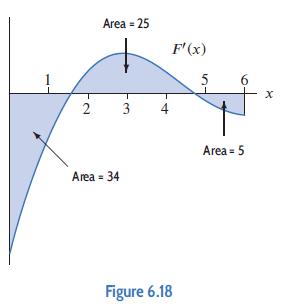
Figure 6.18 shows the derivative F'. If F(0) = 14, graph F. Give (x, y)-coordinates of all local maxima and minima. Area = 25 2 3 Area = 34 4 F'(x) Figure 6.18 5 6 Area = 5 X
If m, n ≥ 2 are integers, find and classify the critical points of f(x) = xm(1 − x)n.
Find the integrals in problem. Check your answers by differentiation. xe dx 3x tehra
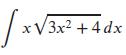
Find the integrals in Problem. Check your answers by differentiation. [x√3x² + 4dx
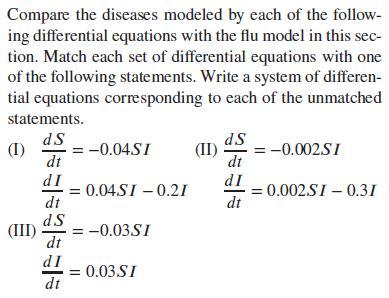
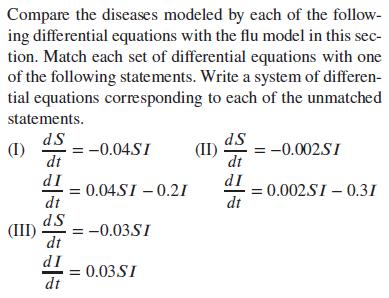
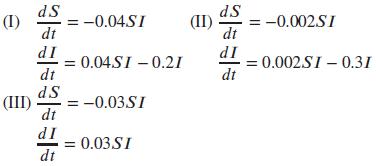
For the equations (I) in Problem 8, what is the threshold value of S?Data from in problem 8 Compare the diseases modeled by each of the follow- ing differential equations with the flu model in this sec- tion. Match each set of differential equations with one of the following statements. Write a
For the equations (II) in Problem 8, suppose S0 = 100. Does the disease spread initially? What if S0 = 200?Data from in problem 8 Compare the diseases modeled by each of the follow- ing differential equations with the flu model in this sec- tion. Match each set of differential equations with one of
Compare the diseases modeled by each of the following differential equations with the flu model in this section. Match each set of differential equations with one of the following statements. Write a system of differential equations corresponding to each of the unmatched statements.(a) More
At a time t hours after taking a tablet, the rate at which a drug is being eliminated is r(t) = 50(e−0.1t − e−0.2t) mg/hr.Assuming that all the drug is eventually eliminated, calculate the original dose.
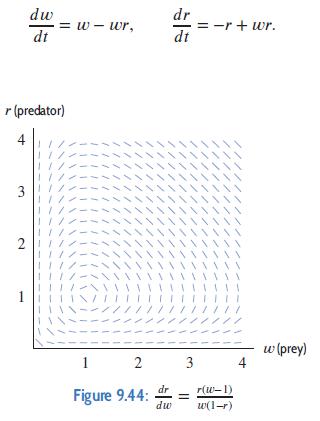
Let w be the number of worms (in millions) and r the number of robins (in thousands) living on an island. Suppose w and r satisfy the following differential equations, which correspond to the slope field in Figure 9.44.Repeat Problem 18 if initially there are 0.5 million worms and 3 thousand
Find the derivative. Assume a, b, c, k are constants.y = x−12
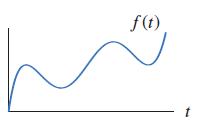
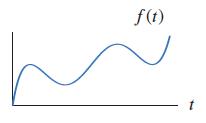
Indicate the approximate locations of all inflection points. How many inflection points are there? f(t) t
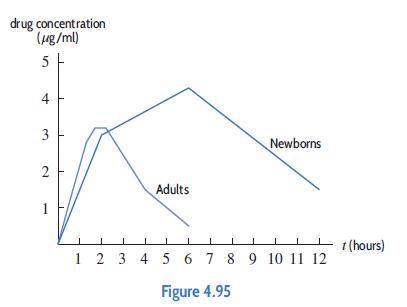
Figure 4.95 shows drug concentration curves for anhydrous ampicillin for newborn babies and adults. Discuss the differences between newborns and adults in the absorption of this drug. drug concentration (μg/ml) 5 4 3 نها 2 Adults Newborns 1 2 3 4 5 6 7 8 9 10 11 12 Figure 4.95 t (hours)
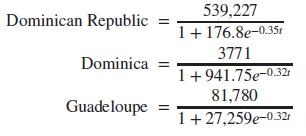
Problem are about chikungunya, a disease that arrived in the Americas in 2013 and spread rapidly in 2014. While seldom fatal, the disease causes debilitating joint pain and a high fever. In August 2014, a public challenge was issued to predict the number of cases in each of the affected countries.
Indicate all critical points of the function f. How many critical points are there? Identify each critical point as a local maximum, a local minimum, or neither. f(t) t
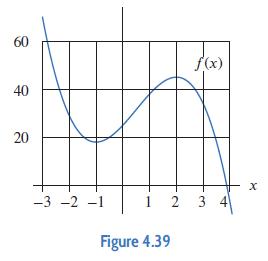
In Problems for f(x) in Figure 4.39, find the x-values of the global maximum and global minimum on the given domain.Domain: 0 ≤ x ≤ 4 60 40 20 -3 -2 -1 1 2 Figure 4.39 f(x) 3 4 X
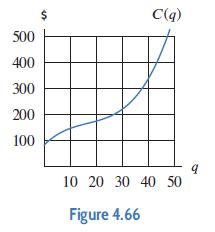
The graph of a cost function is given in Figure 4.66.(a) At q = 25, estimate the following quantities and represent your answers graphically.(i) Average cost (ii) Marginal cost(b) At approximately what value of q is average cost minimized? 500 400 300 200 100 S C(q) 10 20 30 40 50 Figure 4.66 9
The cost of producing q items is C(q) = 2500 + 12q dollars.(a) What is the marginal cost of producing the 100th item? the 1000th item?(b) What is the average cost of producing 100 items? 1000 items?
The elasticity of bread is E = 0.35. If the price of bread increases from $1.75 to $2.00, does the demand for bread increase or decrease? Estimate the percent change in the quantity demanded.
Revenue is given by R(q) = 450q and cost is given by C(q) = 10,000 + 3q2. At what quantity is profit maximized? What is the total profit at this production level?
Problem are about chikungunya, a disease that arrived in the Americas in 2013 and spread rapidly in 2014. While seldom fatal, the disease causes debilitating joint pain and a high fever. In August 2014, a public challenge was issued to predict the number of cases in each of the affected countries.
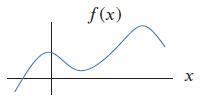
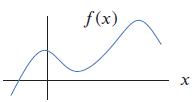
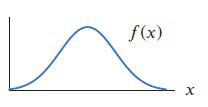
Indicate all critical points of the function f. How many critical points are there? Identify each critical point as a local maximum, a local minimum, or neither. f(x) X
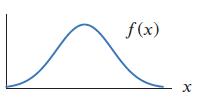
Indicate the approximate locations of all inflection points. How many inflection points are there? f(x) X
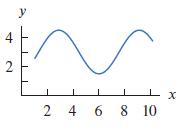
For Problems indicate all critical points on the given graphs. Determine which correspond to local minima, local maxima, global minima, global maxima, or none of these. 4 2 y - X 24 4 6 6 8 10
The elasticity of a good is E = 2. What is the effect on the quantity demanded of:(a) A 3% price increase?(b) A 3% price decrease?
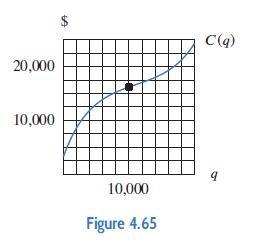
Figure 4.65 shows cost with q = 10,000 marked.(a) Find the average cost when the production level is 10,000 units and interpret it.(b) Represent your answer to part (a) graphically.(c) At approximately what production level is average cost minimized? 20,000 10,000 A XXX 10,000 Figure 4.65 A C(q) 9
The revenue from selling q items is R(q) = 500q − q2, and the total cost is C(q) = 150+10q. Write a function that gives the total profit earned, and find the quantity which maximizes the profit.
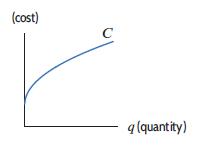
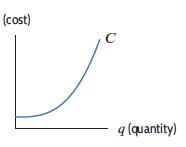
For each cost function in Figure 4.64, is there a value of q at which average cost is minimized? If so, approximately where? Explain your answer.(a)(b) (cost) с q (quantity)
Let b = 1, and graph C = ate−bt using different values for a. Explain the effect of the parameter a.
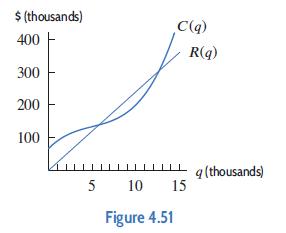
Figure 4.51 shows cost and revenue. For what production levels is the profit function positive? Negative? Estimate the production at which profit is maximized. $ (thousands) 400 - 300 200 100 5 C(q) ILL 10 Figure 4.51 R(q) 15 q (thousands)
The elasticity of a good is E = 0.5. What is the effect on the quantity demanded of:(a) A 3% price increase? (b) A 3% price decrease?
Indicate the approximate locations of all inflection points. How many inflection points are there? f(x)
Investigate the effect of the parameter C on the logistic curveSubstitute several values for C and explain, with a graph and with words, the effect of C on the graph. P = 10 1+ Ce-t
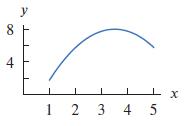
Indicate all critical points on the given graphs. Determine which correspond to local minima, local maxima, global minima, global maxima, or none of these. 8 4 y 1 2 3 4 5 x
Indicate all critical points of the function f. How many critical points are there? Identify each critical point as a local maximum, a local minimum, or neither. X (x) f
If time, t, is in hours and concentration, C, is in ng/ml, the drug concentration curve for a drug is given by C = 12.4te−0.2t.(a) Graph this curve.(b) How many hours does it take for the drug to reach its peak concentration? What is the concentration at that time?(c) If the minimum
The cost (in dollars) of producing q items is given byC(q) = 0.08q3 + 75q + 1000.(a) Find the marginal cost function.(b) Find C(50) and C¨(50). Give units with your answers and explain what each is telling you about costs of production.
The demand for a product is given, for p, q ≥ 0, byp = f(q) = 50 − 0.03q2.(a) Find the p- and q-intercepts for this function and interpret them in terms of demand for this product.(b) Find f(20) and give units with your answer. Explain what it tells you in terms of demand.(c) Find f¨(20) and
The yield, Y , of an apple orchard (measured in bushels of apples per acre) is a function of the amount x of fertilizer in pounds used per acre. SupposeY = f(x) = 320 + 140x − 10x2.(a) What is the yield if 5 pounds of fertilizer is used per acre?(b) Find f¨(5). Give units with your answer and
The demand curve for a product is given by q = 300 − 3p, where p is the price of the product and q is the quantity that consumers buy at this price.(a) Write the revenue as a function, R(p), of price.(b) Find R'(10) and interpret your answer in terms of revenue.(c) For what prices is R¨(p)
A ball is dropped from the top of the Empire State Building. The height, y, of the ball above the ground (in feet) is given as a function of time, t (in seconds), byy = 1250 − 16t2.(a) Find the velocity of the ball at time t. What is the sign of the velocity? Why is this to be expected?(b) When
The cost to produce q items is C(q) = 1000 + 2q2 dollars. Find the marginal cost of producing the 25th item. Interpret your answer in terms of costs.
Suppose W is proportional to r3. The derivative dW∕dr is proportional to what power of r?
(a) Use the formula for the area of a circle of radius r, A = πr2, to find dA∕dr.(b) The result from part (a) should look familiar. What does dA∕dr represent geometrically?(c) Use the difference quotient to explain the observation you made in part (b).
An island of A square kilometers in the Florida Keys has N species of beetles, given byN = f(A) = 8.3A0.25.(a) Find f¨(A).(b) At 40 km2, Key Largo is the largest island in the Keys. Find f(40) and f¨(40).(c) Interpret f(40) in terms of beetles and Key Largo.(d) Global warming is causing the
A jökulhlaup is the rapid draining of a glacial lake when an ice dam bursts. The maximum outflow rate, Q (in m3∕sec), during a jökulhlaup is given1 in terms of its volume, v (in km3), before the dam-break by Q = 7700v0.67.(a)(b)Include units. What does this derivative mean for glacial lakes?
If you are outdoors, the wind may make it feel a lot colder than the thermometer reads. You feel the windchill temperature, which, if the air temperature is 20◦F, is given in ◦F by W (v) = 48.17 − 27.2v0.16, where v is the wind velocity in mph for 5 ≤ v ≤ 60.3(a) If the air temperature is
Circulation time is the average amount of time it takes for all the blood in the body to circulate once and return to the heart. For a mammal with mass m kilograms, the circulation time C, in seconds, isC = f(m) = 17.4m0.25.(a) Find f¨(m).(b) For a human with mass 70 kg, find and interpret f(70)
Kleiber’s Law states that the daily calorie requirement, C(w), of a mammal is proportional to the mammal’s body weight w raised to the 0.75 power. If body weight is measured in pounds, the constant of proportionality is approximately 42.(a) Give formulas for C(w) and C'(w).(b) Find and
The time, T, in seconds for one complete oscillation of a pendulum is given by T = f(L) = 1.111 √L, where L is the length of the pendulum in feet. Find the following quantities, with units, and interpret in terms of the pendulum.(a) f(100) (b) f'(100).
For a certain type of fish, the weight y, in grams, is related to the length x, in cm, by y = f(x) = 0.009x3.(a) Find f'(x).(b) Assume f(A) = B and f'(C) = D. For each of A, B, C, and D, which of the following are the correct units? grams, cm, cm ∕ gram, grams ∕ cm
(a) Find the equation of the tangent line to f(x) = x3 at the point where x = 2.(b) Graph the tangent line and the function on the same axes. If the tangent line is used to estimate values of the function near x = 2, will the estimates be overestimates or underestimates?
Find the quadratic polynomial g(x) = ax2 + bx + c which best fits the function f(x) = ex at x = 0, in the sense thatg(0) = f(0), and g'(0) = f'(0), and g''(0) = f''(0).Using a computer or calculator, sketch graphs of f and g on the same axes. What do you notice?
Find the equation of the line tangent to the graph of f(t) = 6t − t2 at t = 4. Sketch the graph of f(t) and the tangent line on the same axes.
Food bank usage in Britain has grown dramatically over the past decade. The number of users, in thousands, of the largest bank is estimated to be N(t) = 1.3(2.25)t , where t is the number of years since 2006.(a) At what rate is the number of food bank users changing at time t? Give units.(b) Does
For f(x) = x2 + 5x +2, find the equation of the tangent line at(a) x = 1 (b) x = −1
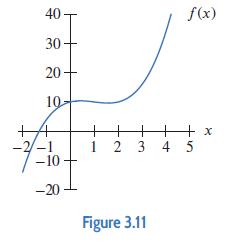
(a) Use Figure 3.11 to rank the quantities f¨(−1), f¨(0), f¨(1), f¨(4) from smallest to largest.(b) Confirm your answer by calculating the quantities using the formula, f(x) = x3 − 3x2 + 2x + 10. 40 T 30 20 10- +4 -1 -10 -20 + f(x) + 1 23 4 5 + + + x Figure 3.11
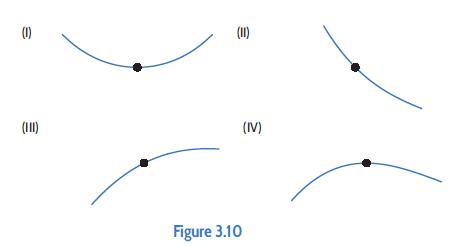
For the functions in Problems(a) Find the derivative at x = −1.(b) Find the second derivative at x = −1.(c) Use your answers to parts (a) and (b) to match the function to one of the graphs in Figure 3.10, each of which is shown centered on the point (−1, −1).ℎ(x) = 2x4 + 8x3 + 15x2 + 14x
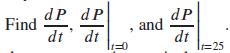
In 2009, the population, P, of India was 1.166 billion and growing at 1.5% annually.(a) Give a formula for P in terms of time, t, measured in years since 2009.(b)What do each of these represent in practical terms? Find dP dP dt dt 1=0 and dP dt t=25
(a) Differentiating, we have k'(x) = 3x2 − 1, so For the functions in Problems (a) Find the derivative at x = −1.(b) Find the second derivative at x = −1.(c) Use your answers to parts (a) and (b) to match the function to one of the graphs in Figure 3.10, each of which is shown centered on the
Find the equation of the line tangent to the graph of f(x) = 2x3 − 5x2 + 3x − 5 at x = 1.
For the functions in Problems(a) Find the derivative at x = −1.(b) Find the second derivative at x = −1.(c) Use your answers to parts (a) and (b) to match the function to one of the graphs in Figure 3.10, each of which is shown centered on the point (−1, −1).g(x) = x4 − x2 − 2x − 3
With t in years since the start of 2014, worldwide annual extraction of copper is 17.9(1.025)t million tonnes.(a) How fast is the annual extraction changing at time t? Give units.(b) How fast is the annual extraction changing at the start of 2025?(c) Suppose annual extraction changes at the rate
For the functions in Problems(a) Find the derivative at x = −1.(b) Find the second derivative at x = −1.(c) Use your answers to parts (a) and (b) to match the function to one of the graphs in Figure 3.10, each of which is shown centered on the point (−1, −1).f(x) = 2x3 + 3x2 − 2
(a) Find the equation of the tangent line to y = ln x at x = 1.(b) Use it to calculate approximate values for ln(1.1) and ln(2).(c) Using a graph, explain whether the approximate values are smaller or larger than the true values. Would the same result have held if you had used the tangent line to
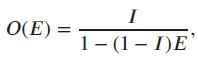
If a someone is lost in the wilderness, the search and rescue team identifies the boundaries of the search area and then uses probabilities to help optimize the chances of finding the person, assuming the subject is immobile. The probability, O, of the person being outside the search area after the
In 2012, the population of Mexico was 115 million and growing 1.09% annually, while the population of the US was 314 million and growing 0.9% annually.(a) Find the Mexican growth rate in people/year in 2012.(b) Find the US growth rate, measured the same way, and use it determine which population
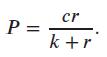
For positive constants c and k, the Monod growth curve describes the growth of a population, P, as a function of the available quantity of a resource, r:Find dP∕dr and interpret it in terms of the growth of the population. P = cr k+r
For the cost function C = 1000 + 300 ln q (in dollars), find the cost and the marginal cost at a production level of 500. Interpret your answers in economic terms.
Carbon-14 is a radioactive isotope used to date objects. If A0 represents the initial amount of carbon-14 in the object, then the quantity remaining at time t, in years, isA(t) = A0e−0.000121t.(a) A tree, originally containing 185 micrograms of carbon-14, is now 500 years old. At what rate
Show that if the graphs of f(t) and ℎ(t) = Aekt are tangent at t = a, then k is the relative rate of change of f at t = a.
If ℎ = fn, show that (f") if = n² f
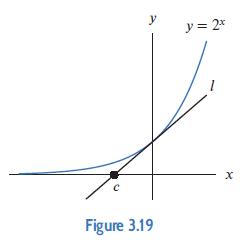
Find the value of c in Figure 3.19, where the line l tangent to the graph of y = 2x at (0, 1) intersects the x-axis. С y Figure 3.19 y = 2x X
If f(t) = t4 − 3t2 + 5t, find f'(t) and f''(t).
The cost of producing a quantity, q, of a product is given byC(q) = 1000 + 30e0.05q dollars.Find the cost and the marginal cost when q = 50. Interpret these answers in economic terms.
Some economists suggest that an extra year of education increases a person’s wages, on average, by about 14%. Assume you could make $10 per hour with your current level of education and that inflation increases wages at a continuous rate of 3.5% per year.(a) If you had had four more years of
If f(t) = 2t3 − 4t2 + 3t − 1, find f'(t) and f''(t).
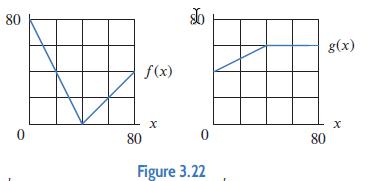
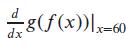
Use Figure 3.22 to evaluate the derivative. 80 0 # f(x) 80 $6 0 Figure 3.22 80
At a time t hours after it was administered, the concentration of a drug in the body is f(t) = 27e−0.14t ng/ml. What is the concentration 4 hours after it was administered? At what rate is the concentration changing at that time?
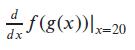
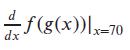
Given y = f(x) with f(1) = 4 and f'(1) = 3, find(a) g'(1) if g(x) = √f(x).(b) ℎ'(1) if ℎ(x) = f(√x).
The quantity, Q, in tons, of material at a municipal waste site is a function of the number of years since 2000, withQ = f(t) = 3t2 + 100.Find f(10), f¨(10), and the relative rate of change f¨∕f at t = 10. Interpret your answers in terms of waste.
Use Figure 3.22 to evaluate the derivative. 80 0 # f(x) 80 $6 0 Figure 3.22 80
Use Figure 3.22 to evaluate the derivative. 80 0 # f(x) 80 $6 0 Figure 3.22 80
Zebra mussels are freshwater shellfish that first appeared in the St. Lawrence River in the early 1980s and have spread throughout the Great Lakes. Suppose that t months after they appeared in a small bay, the number of zebra mussels is given by Z(t) = 300t2. How many zebra mussels are in the bay
Show that the relative rate of change of a quotient f∕g is the difference between the relative rates of change of f and g.
With a yearly inflation rate of 2%, prices are given byP = P0(1.02)t,where P0 is the price in dollars when t = 0 and t is time in years. Suppose P0 = 1. How fast (in cents/year) are prices rising when t = 10?
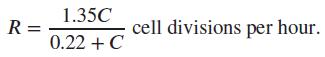
If C (in units of 10−4 molar) is the concentration of glucose in a solution, then E. coli bacteria in the solution grow at a rate, R (in cell divisions per hour), given by(a) Find the growth rate of bacteria growing in 2⋅10−4 molar glucose solution. Include units.(b) Find dR∕dC.(c)
The number, N, of acres of harvested land in a region is given byN = f(t) = 120√t,where t is the number of years since farming began in the region. Find f(9), f'(9), and the relative rate of change f'∕f at t = 9. Interpret your answers in terms of harvested land.
Use Figure 3.22 to evaluate the derivative. 80 0 # f(x) 80 $6 0 Figure 3.22 80
Show that the relative rate of change of a product fg is the sum of the relative rates of change of f and g.
With t in years since January 1, 2010, the population P of Slim Chance is predicted byP = 35,000(0.98)t.At what rate will the population be changing on January 1, 2023?
Use Figure 3.22 to evaluate the derivative. 80 0 # f(x) 80 $6 0 Figure 3.22 80
Use the tangent line approximation.Given f(x) = x3 + x2 − 6, approximate f(0.97).
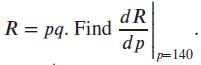
The quantity, q, of a skateboard sold depends on the selling price, p, in dollars, so we write q = f(p). You are given that f(140) = 15,000 and f¨(140) = −100.(a) What do f(140) = 15,000 and f¨(140) = −100 tell you about the sales of skateboards?(b) The total revenue, R, earned by the sale of
The population of Hungary has been modeled byP = 9.919(0.998)t,where P is in millions and t is years since July 2014.(a) What does this model predict for the population of Hungary in July 2020?(b) How fast (in people/year) does this model predict Hungary’s population will be decreasing in 2020?
Showing 100 - 200
of 5529
1
2
3
4
5
6
7
8
9
10
11
12
13
14
15
Last
Step by Step Answers