New Semester
Started
Get
50% OFF
Study Help!
--h --m --s
Claim Now
Question Answers
Textbooks
Find textbooks, questions and answers
Oops, something went wrong!
Change your search query and then try again
S
Books
FREE
Study Help
Expert Questions
Accounting
General Management
Mathematics
Finance
Organizational Behaviour
Law
Physics
Operating System
Management Leadership
Sociology
Programming
Marketing
Database
Computer Network
Economics
Textbooks Solutions
Accounting
Managerial Accounting
Management Leadership
Cost Accounting
Statistics
Business Law
Corporate Finance
Finance
Economics
Auditing
Tutors
Online Tutors
Find a Tutor
Hire a Tutor
Become a Tutor
AI Tutor
AI Study Planner
NEW
Sell Books
Search
Search
Sign In
Register
study help
mathematics
calculus early transcendentals
Calculus Early Transcendentals 2nd edition William L. Briggs, Lyle Cochran, Bernard Gillett - Solutions
Assume limx→1 f(x) = 8, limx→1 g(x) = 3, and limx→1 h(x) = 2. Compute the following limits and state the limit laws used to justify your computations.limx→1 (h(x))5
Assume limx→1 f(x) = 8, limx→1 g(x) = 3, and limx→1 h(x) = 2. Compute the following limits and state the limit laws used to justify your computations.limx→1 f(x)/g(x) - h(x)
Assume limx→1 f(x) = 8, limx→1 g(x) = 3, and limx→1 h(x) = 2. Compute the following limits and state the limit laws used to justify your computations.limx→1 f(x)g(x)/h(x)
Assume limx→1 f(x) = 8, limx→1 g(x) = 3, and limx→1 h(x) = 2. Compute the following limits and state the limit laws used to justify your computations.limx→1 (f(x)h(x))
Assume limx→1 f(x) = 8, limx→1 g(x) = 3, and limx→1 h(x) = 2. Compute the following limits and state the limit laws used to justify your computations.limx→1 (f(x) - g(x))
Assume limx→1 f(x) = 8, limx→1 g(x) = 3, and limx→1 h(x) = 2. Compute the following limits and state the limit laws used to justify your computations.limx→1 f(x)/h(x)
Assume limx→1 f(x) = 8, limx→1 g(x) = 3, and limx→1 h(x) = 2. Compute the following limits and state the limit laws used to justify your computations.limx→1 (4f(x))
Evaluate the following limits.limx→-5 π
Evaluate the following limits.limx→6 4
Evaluate the following limits.limx→2 (-3x)
Evaluate the following limits.limx→-9 5x
Evaluate the following limits.limx→1 (-2x + 5)
Evaluate the following limits.limx→4 (3x - 7)
SupposeCompute limx→3- f(x) and limx→3+ f(x). if x s 3 |x + 2 if x > 3. [4 f(x) =
Evaluate limx→5 √(x2 - 9).
Suppose limx→2 f(x) = limx→2 h(x) = 5. Find limx→2 g(x), where f(x) ≤ g(x) ≤ h1x2, for all x.
Suppose p and q are polynomials. If limx→0 p(x)/q(x) = 10 and q(0) = 2, find p(0).
If limx→2 f(x) = - 8, find limx→2 (f(x))2/3.
Explain why limx→3 x2 - 7x + 12/x - 3 = limx→3 (x - 4).
Assume limx→3 g(x) = 4 and f(x) = g(x) whenever x ≠ 3. Evaluate limx→3 f(x), if possible.
How are limx→a- f(x) and limx→a+ f(x) calculated if f is a polynomial function?
How is limx→af(x) calculated if f is a polynomial function?
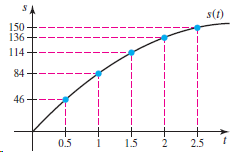
The graph gives the position s(t) of an object moving along a line at time t, over a 2.5-second interval. Find the average velocity of the object over the following intervals.a. [0.5, 2.5]b. [0.5, 2]c. [0.5, 1.5]d. [0.5, 1] s(1) 150 136 114 84 46- 2.5 0.5 1.5
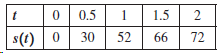
The table gives the position s(t) of an object moving along a line at time t, over a two-second interval. Find the average velocity of the object over the following intervals.a. [0, 2]b. [0, 1.5]c. [0, 1]d. [0, 0.5] t 0 0.5 s(t) | 0 30 1.5 1 2 52| 66 72
The position of an object moving vertically along a line is given by the function s(t) = -4.9t2 + 30t + 20. Find the average velocity of the object over the following intervals.a. [0, 3]b. [0, 2]c. [0, 1]d. [0, h], where h > 0 is a real number
The position of an object moving vertically along a line is given by the function s(t) = -16t2 + 128t. Find the average velocity of the object over the following intervals.a. [1, 4]b. [1, 3]c. [1, 2]d. [1, 1 + h], where h > 0 is a real number
The function s(t) represents the position of an object at time t moving along a line. Suppose s(1) = 84 and s142 = 144. Find the average velocity of the object over the interval of time [1, 4].
The function s(t) represents the position of an object at time t moving along a line. Suppose s(2) = 136 and s(3) = 156. Find the average velocity of the object over the interval of time [2, 3].
Let T(n) = 12 + 22 + ∙∙∙ + n2, where n is a positive integer. It can be shown that T(n) = n(n + 1)(2n + 1)/6.a. Make a table of T(n), for n = 1, 2, ... , 10.b. How would you describe the domain of this function?c. What is the least value of n for which T(n) > 1000?
Let S(n) = 1 + 2 + ∙∙∙ + n, where n is a positive integer. It can be shown that S(n) = n(n + 1)/2.a. Make a table of S(n), for n = 1, 2, ... , 10.b. How would you describe the domain of this function?c. What is the least value of n for which S(n) > 1000?
The factorial function is defined for positive integers as n! = n(n - 1)(n - 2) ∙∙∙ 3 ∙ 2 ∙ 1.a. Make a table of the factorial function, for n = 1, 2, 3, 4, 5.b. Graph these data points and then connect them with a smooth curve.c. What is the least value of n for which n! > 106?
Consider the general quadratic function f(x) = ax2 + bx + c, with a ≠ 0.a. Find the coordinates of the vertex in terms of a, b, and c.b. Find the conditions on a, b, and c that guarantee that the graph of f crosses the x-axis twice.
Prove that if a parabola crosses the x-axis twice, the x-coordinate of the vertex of the parabola is halfway between the x-intercepts.
Let f be an nth-degree polynomial and let g be an mth-degree polynomial. What is the degree of the following polynomials?a. f ∙ fb. f ◦ fc. f ∙ gd. f ◦ g
Imagine a lidless box with height h and a square base whose sides have length x. The box must have a volume of 125 ft3.a. Find and graph the function S(x) that gives the surface area of the box, for all values of x > 0.b. Based on your graph in part (a), estimate the value of x that produces the
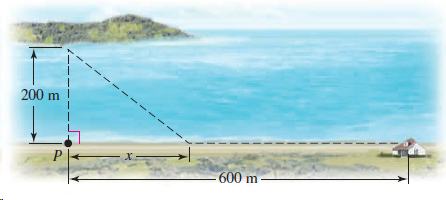
Kelly has finished a picnic on an island that is 200 m off shore (see figure). She wants to return to a beach house that is 600 m from the point P on the shore closest to the island. She plans to row a boat to a point on shore x meters from P and then jog along the (straight) shore to the house.a.
A single slice through a sphere of radius r produces a cap of the sphere. If the thickness of the cap is h, then its volume is V = 1/3 πh2 (3r - h). Graph the volume as a function of h for a sphere of radius 1. For what values of h does this function make sense?
The surface area of a sphere of radius r is S = 4pr2. Solve for r in terms of S and graph the radius function for S ≥ 0.
A car dealer offers a purchase option and a lease option on all new cars. Suppose you are interested in a car that can be bought outright for $25,000 or leased for a start-up fee of $1200 plus monthly payments of $350.a. Find the linear function y = f(m) that gives the total amount you have paid on
a. Find the linear function C = f(F) that gives the reading on the Celsius temperature scale corresponding to a reading on the Fahrenheit scale. Use the facts that C = 0 when F = 32 (freezing point) and C = 100 when F = 212 (boiling point).b. At what temperature are the Celsius and Fahrenheit
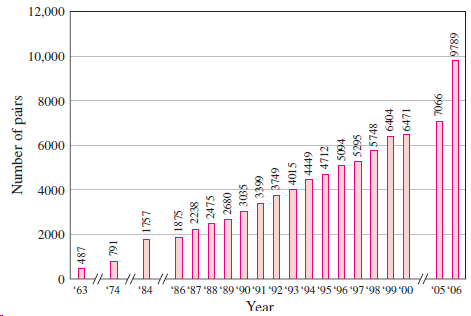
Since DDT was banned and the Endangered Species Act was passed in 1973, the number of bald eagles in the United States has increased dramatically (see figure). In the lower 48 states, the number of breeding pairs of bald eagles increased at a nearly linear rate from 1875 pairs in 1986 to 6471 pairs
Suppose the probability of a server winning any given point in a tennis match is a constant p, with 0 ≤ p ≤ 1.Then the probability of the server winning a game when serving from deuce is
The fovea centralis (or fovea) is responsible for the sharp central vision that humans use for reading and other detail-oriented eyesight. The relative acuity of a human eye, which measures the sharpness of vision, is modeled by the functionwhere u (in degrees) is the angular deviation of the line
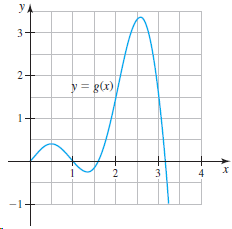
Consider the graph of the function g shown in the figure.a. Give the approximate roots (zeros) of g.b. Give the approximate coordinates of the high points or peaks (soon to be called local maximum values of f).c. Give the approximate coordinates of the low points or valleys (soon to be called local
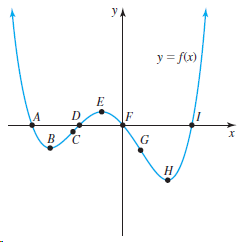
Consider the graph of the function f shown in the figure. Answer the following questions by referring to the points A–I.a. Which points correspond to the roots (zeros) of f?b. Which points on the graph correspond to high points or peaks (soon to be called local maximum values of f)?c. Which
Make a sketch of the given pairs of functions. Be sure to draw the graphs accurately relative to each other.y = x1/3 and y = x1/5
Make a sketch of the given pairs of functions. Be sure to draw the graphs accurately relative to each other.y = x3 and y = x7
Make a sketch of the given pairs of functions. Be sure to draw the graphs accurately relative to each other.y = x4 and y = x6
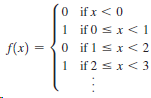
Graph the square wave defined by 0 ifx
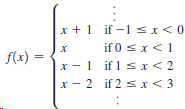
Graph the sawtooth wave defined by x +1 if -1 sI
The ceiling function, or smallest integer function, f(x) = [x], gives the smallest integer greater than or equal to x. Graph the ceiling function, for -3 ≤ x ≤ 3.
The floor function, or greatest integer function, f(x) = [x], gives the greatest integer less than or equal to x. Graph the floor function, for -3 ≤ x ≤ 3.
A function y = f(x) such that if your car gets 32 mi/gal and gasoline costs $x/gallon, then $100 is the cost of taking a y-mile tripFind a formula for a function describing the given situation. Graph the function and give a domain that makes sense for the problem. Recall that with constant speed,
A function y = f(x) such that if you ride a bike for 50 mi at x miles per hour, you arrive at your destination in y hoursFind a formula for a function describing the given situation. Graph the function and give a domain that makes sense for the problem. Recall that with constant speed, distance =
Two cars leave a junction at the same time, one traveling north at 30 mi/hr, the other one traveling east at 60 mi/hr. The function s(t) is the distance between the cars t hours after they leave the junction.Find a formula for a function describing the given situation. Graph the function and give a
A function y = f(x) such that y is 1 less than the cube of xFind a formula for a function describing the given situation. Graph the function and give a domain that makes sense for the problem. Recall that with constant speed, distance = speed ∙ time elapsed.
Find a simple function that fits the data in the tables.x y0...................-11....................04....................19....................216..................3
Find a simple function that fits the data in the tables.x y-1.....................00......................11......................22......................33......................4
Find the point(s) of intersection of the parabolas y = x2 and y = -x2 + 8x.Use analytical methods to find the following points of intersection. Use a graphing utility to check your work.
Find the point(s) of intersection of the parabola y = x2 + 2 and the line y = x + 4.Use analytical methods to find the following points of intersection. Use a graphing utility to check your work.
Determine whether the following statements are true and give an explanation or counterexample.a. All polynomials are rational functions, but not all rational functions are polynomials.b. If f is a linear polynomial, then f ◦ f is a quadratic polynomial.c. If f and g are polynomials, then the
Use shifts and scalings to graph the given functions. Then check your work with a graphing utility. Be sure to identify an original function on which the shifts and scalings are performed.h(x) = |3x - 6| + 1
Use shifts and scalings to graph the given functions. Then check your work with a graphing utility. Be sure to identify an original function on which the shifts and scalings are performed.h(x) = -4x2 - 4x + 12
Use shifts and scalings to graph the given functions. Then check your work with a graphing utility. Be sure to identify an original function on which the shifts and scalings are performed.p(x) = x2 + 3x -5
Use shifts and scalings to graph the given functions. Then check your work with a graphing utility. Be sure to identify an original function on which the shifts and scalings are performed.g(x) = 2(x + 3)2
Use shifts and scalings to graph the given functions. Then check your work with a graphing utility. Be sure to identify an original function on which the shifts and scalings are performed.g(x) = 2x3 - 1
Use shifts and scalings to graph the given functions. Then check your work with a graphing utility. Be sure to identify an original function on which the shifts and scalings are performed.g(x) = -3x2
Use shifts and scalings to graph the given functions. Then check your work with a graphing utility. Be sure to identify an original function on which the shifts and scalings are performed.f(x) = x2 - 2x + 3
Use shifts and scalings to graph the given functions. Then check your work with a graphing utility. Be sure to identify an original function on which the shifts and scalings are performed.f(x) = (x - 2)2 + 1
Use shifts and scalings to transform the graph of f(x) = 1x into the graph of g. Use a graphing utility to check your work.a. g(x) = f(x + 4)b. g(x) = 2 f(2x - 1)c. g(x) = √x - 1d. g(x) = 3√x - 1 - 5
Use shifts and scalings to transform the graph of f(x) = x2 into the graph of g. Use a graphing utility to check your work.a. g(x) = f(x - 3)b. g(x) = f(2x - 4)c. g(x) = -3 f(x - 2) + 4d. g(x) = 6 f (x - 2/3) + 1
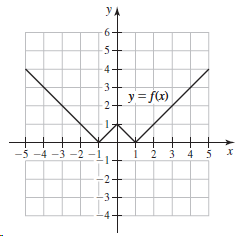
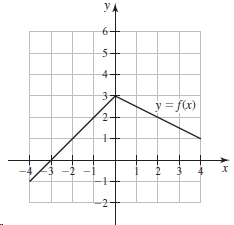
Use the graph of f in the figure to plot the following functions.a. y = -f(x)b. y = f(x + 2)c. y = f(x - 2)d. y = f(2x)e. y = f(x - 1) + 2f. y = 2f(x) YA 6. 5- 4- y= fx) 17 i 2 3 4 3 -5 -4 -3 -2 -1, -3- 2.
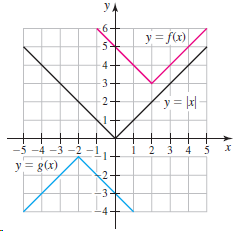
The functions f and g in the figure are obtained by vertical and horizontal shifts and scalings of y = |x| . Find formulas for f and g. Verify your answers with a graphing utility. УА y = f(x) 5. 4 -3- y = |r| -5 -4 -3 -2 -1 y = g(x) 1 2 3 4 5 х 2. -3) 4
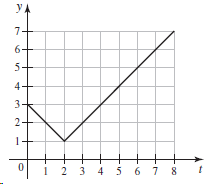
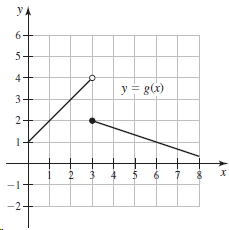
Let A(x) be the area of the region bounded by the t-axis and the graph of y = f(t) from t = 0 to t = x. Consider the following functions and graphs.a. Find A(2).b. Find A(6).c. Find a formula for A(x).f(t) = |t - 2| + 1 УА 6- 4 3 4 5 6 7 8 3.
Let A(x) be the area of the region bounded by the t-axis and the graph of y = f(t) from t = 0 to t = x. Consider the following functions and graphs.a. Find A(2).b. Find A(6).c. Find a formula for A(x). S-2t + 8 if t s 3 if t> 3 f(t) = УА 6- 2- 1 2 2 3 4 5 6 7 8
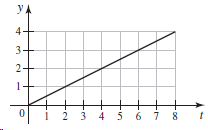
Let A(x) be the area of the region bounded by the t-axis and the graph of y = f(t) from t = 0 to t = x. Consider the following functions and graphs.a. Find A(2).b. Find A(6).c. Find a formula for A(x).f(t) = t/2 y. 4 3- 2- 4 5 6 7 2 8 1
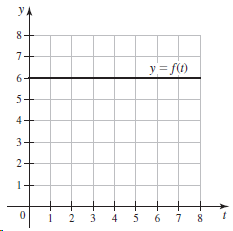
Let A(x) be the area of the region bounded by the t-axis and the graph of y = f(t) from t = 0 to t = x. Consider the following functions and graphs.a. Find A(2).b. Find A(6).c. Find a formula for A(x).f(t) = 6 УА 8- 7+ y= f(t) 6- 5- 2- 2 3 4 5 6
Determine the slope function for the following functions.Use the figure for Exercise 20. 6- 4 y = g(x) 3- 2- -1 -2-
Determine the slope function for the following functions.Use the figure for Exercise 19. УА 5- y = f(x) 2- 3 -2 х -2
Determine the slope function for the following functions.f(x) = |x|
Determine the slope function for the following functions.f(x) = 2x + 1
a. Use a graphing utility to produce a graph of the given function. Experiment with different windows to see how the graph changes on different scales. Sketch an accurate graph by hand after using the graphing utility.b. Give the domain of the function.c. Discuss interesting features of the
a. Use a graphing utility to produce a graph of the given function. Experiment with different windows to see how the graph changes on different scales. Sketch an accurate graph by hand after using the graphing utility.b. Give the domain of the function.c. Discuss interesting features of the
a. Use a graphing utility to produce a graph of the given function. Experiment with different windows to see how the graph changes on different scales. Sketch an accurate graph by hand after using the graphing utility.b. Give the domain of the function.c. Discuss interesting features of the
a. Use a graphing utility to produce a graph of the given function. Experiment with different windows to see how the graph changes on different scales. Sketch an accurate graph by hand after using the graphing utility.b. Give the domain of the function.c. Discuss interesting features of the
a. Use a graphing utility to produce a graph of the given function. Experiment with different windows to see how the graph changes on different scales. Sketch an accurate graph by hand after using the graphing utility.b. Give the domain of the function.c. Discuss interesting features of the
a. Use a graphing utility to produce a graph of the given function. Experiment with different windows to see how the graph changes on different scales. Sketch an accurate graph by hand after using the graphing utility.b. Give the domain of the function.c. Discuss interesting features of the
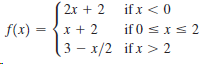
Graph the following functions. 2x + 2 ifx 2
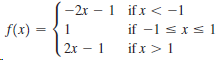
Graph the following functions. - 2х — 1 ifx < -1 if -1 sxs 1 if x> 1 f(x) = 1 2х - 1
Graph the following functions. 3x – 1 ifx < 1 f(x) = lx + 1 ifx2 1
Graph the following functions. :- 1 J3х -2х + 1 ifx > 0 if x s0 f(x) =
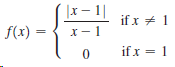
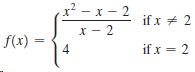
Graph the following functions. ,x? — х — 2 х — 2 4 if x + 2 if x = 2 f(x) •
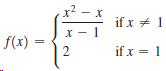
Graph the following functions. x2 – x if x + 1 x - 1 f(x) = if x = 1
A taxicab ride costs $3.50 plus $2.50 per mile for the first 5 miles, with the rate dropping to $1.50 per mile after the fifth mile. Let m be the distance (in miles) from the airport to a hotel. Find and graph the piecewise linear function c(m) that represents the cost of taking a taxi from the
Suppose that it costs 5¢ per minute to park at the airport with the rate dropping to 3¢ per minute after 9 p.m. Find and graph the cost function c(t) for values of t satisfying 0 ≤ t ≤ 120. Assume that t is the number of minutes after 8 p.m.
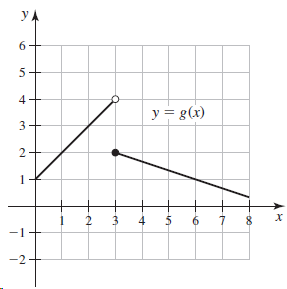
Write a definition of the functions whose graphs are given. 4 y = g(x) х 6. -2 %24 4, 3. 2.
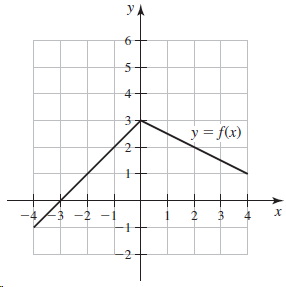
Write a definition of the functions whose graphs are given. УА 4 y = f(x) -3 -2 -1 х -2 4.
A taxicab ride costs $3.50 plus $2.50 per mile. Let m be the distance (in miles) from the airport to a hotel. Find and graph the function c(m) that represents the cost of taking a taxi from the airport to the hotel. Also determine how much it costs if the hotel is 9 miles from the airport.
The population of a small town was 500 in 2015 and is growing at a rate of 24 people per year. Find and graph the linear population function p(t) that gives the population of the town t years after 2015. Then use this model to predict the population in 2030.
The Biology Club plans to have a fundraiser for which $8 tickets will be sold. The cost of room rental and refreshments is $175. Find and graph the function p = f(n) that gives the profit from the fundraiser when n tickets are sold. Notice that f(0) = - $175; that is, the cost of room rental and
Showing 6300 - 6400
of 6775
First
54
55
56
57
58
59
60
61
62
63
64
65
66
67
68
Step by Step Answers