New Semester
Started
Get
50% OFF
Study Help!
--h --m --s
Claim Now
Question Answers
Textbooks
Find textbooks, questions and answers
Oops, something went wrong!
Change your search query and then try again
S
Books
FREE
Study Help
Expert Questions
Accounting
General Management
Mathematics
Finance
Organizational Behaviour
Law
Physics
Operating System
Management Leadership
Sociology
Programming
Marketing
Database
Computer Network
Economics
Textbooks Solutions
Accounting
Managerial Accounting
Management Leadership
Cost Accounting
Statistics
Business Law
Corporate Finance
Finance
Economics
Auditing
Tutors
Online Tutors
Find a Tutor
Hire a Tutor
Become a Tutor
AI Tutor
AI Study Planner
NEW
Sell Books
Search
Search
Sign In
Register
study help
mathematics
college algebra graphs and models
College Algebra 7th Edition Robert F Blitzer - Solutions
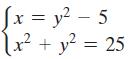
In Exercises 63–68, find the solution set for each system by graphing both of the system’s equations in the same rectangular coordinate system and finding points of intersection. Check all solutions in both equations. [x = y² - 5 x² + y² = 25
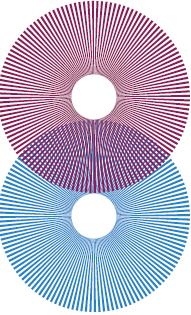
Moiré patterns, such as those shown in Exercises 65–66, can appear when two repetitive patterns overlap to produce a third, sometimes unintended, pattern.a. In each exercise, use the name of a conic section to describe the moiré pattern.b. Select one of the following equations that can possibly
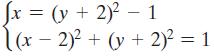
In Exercises 63–68, find the solution set for each system by graphing both of the system’s equations in the same rectangular coordinate system and finding points of intersection. Check all solutions in both equations. Jx = (y + 2)² - 1 [(x - 2)² + (y + 2)² = 1
In Exercises 67–68, graph each semiellipse y = -√16-4x²
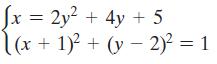
In Exercises 63–68, find the solution set for each system by graphing both of the system’s equations in the same rectangular coordinate system and finding points of intersection. Check all solutions in both equations. fx = 2y² + 4y + 5 (x + 1)² + (y-2)² = 1
In Exercises 67–68, graph each semiellipse 2 y = -√4-4x²
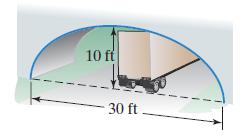
Will a truck that is 8 feet wide carrying a load that reaches 7 feet above the ground clear the semielliptical arch on the one-way road that passes under the bridge shown in the figure? 10 ft 30 ft.
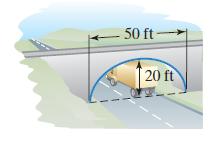
A semielliptic archway has a height of 20 feet and a width of 50 feet, as shown in the figure. Can a truck 14 feet high and 10 feet wide drive under the archway without going into the other lane? 50 ft- 20 ft
Describe how to graph x2/9 - y2/1 = 1.
The reflector of a flashlight is in the shape of a parabolic surface. The casting has a diameter of 4 inches and a depth of 1 inch. How far from the vertex should the light bulb be placed?
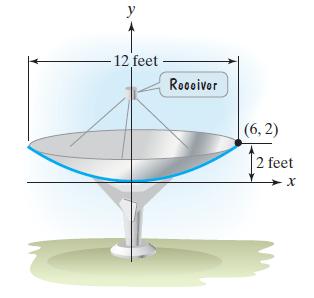
A satellite dish, like the one shown below, is in the shape of a parabolic surface. Signals coming from a satellite strike the surface of the dish and are reflected to the focus, where the receiver is located. The satellite dish shown has a diameter of 12 feet and a depth of 2 feet. How far from
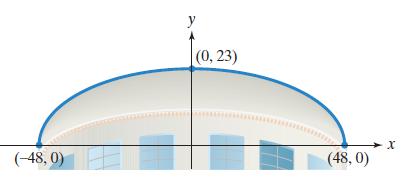
The elliptical ceiling in Statuary Hall in the U.S. Capitol Building is 96 feet long and 23 feet tall.a. Using the rectangular coordinate system in the figure shown, write the standard form of the equation of theelliptical ceiling.b. John Quincy Adams discovered that he could overhear the
Describe how to locate the foci of the graph of x2/9 - y2/1 = 1.
The reflector of a flashlight is in the shape of a parabolic surface. The casting has a diameter of 8 inches and a depth of 1 inch. How far from the vertex should the light bulb be placed?
Describe one similarity and one difference between the graphs of x2/9 - y2/1 = 1 and y2/9 - x2/1 = 1.
Describe one similarity and one difference between the graphs of x2/9 - y2/1 = 1 and (x - 3)2/9 - (y + 3)2/1 = 1.
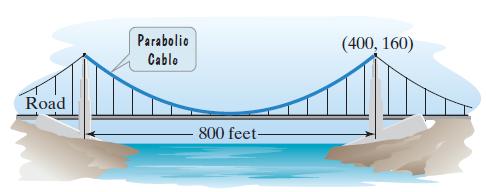
The towers of a suspension bridge are 800 feet apart and rise 160 feet above the road. The cable between the towers has the shape of a parabola and the cable just touches the sides of the road midway between the towers. What is the height of the cable 100 feet from a tower? Road Parabolic Cablo 800
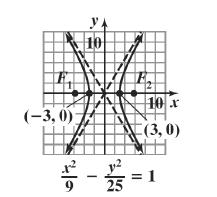
Use a graphing utility to graph any five of the hyperbolas that you graphed by hand in Exercises 13–26.Data from Exercise 13-2613.14.15.16.17. TA (-3,0) y 10 등- 25 10 x (3,0) = 1
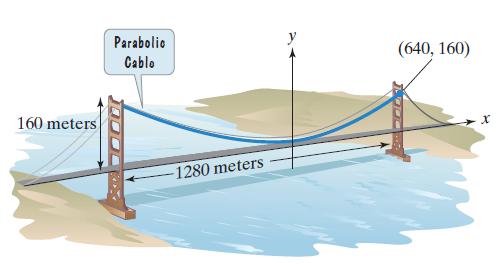
The towers of the Golden Gate Bridge connecting San Francisco to Marin County are 1280 meters apart and rise 160 meters above the road. The cable between the towers has the shape of a parabola and the cable just touches the sides of the road midway between the towers. What is the height of the
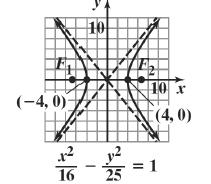
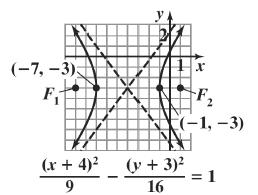
Use a graphing utility to graph any three of the hyperbolas that you graphed by hand in Exercises 33–42. First solve the given equation for y by using the square root property. Enter each of the two resulting equations to produce each branch of the hyperbola.Data from Exercise 33-4233.34.35. (-7,
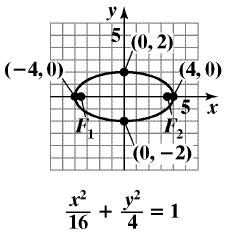
Use a graphing utility to graph any five of the ellipses that you graphed by hand in Exercises 1–18.Data from exercise 1-181.2.3.4.5. (-4,0)- F YA 5(0,2) 1² + 16 (4,0) X5 x 12 (0, -2) 2² = 1 4
If an elliptical whispering room has a height of 30 feet and a width of 100 feet, where should two people stand if they would like to whisper back and forth and be heard?
How can you distinguish an ellipse from a hyperbola by looking at their equations?
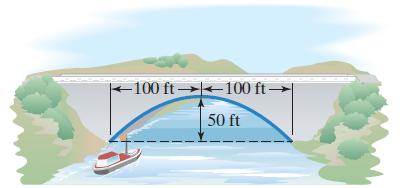
The parabolic arch shown in the figure is 50 feet above the water at the center and 200 feet wide at the base. Will a boat that is 30 feet tall clear the arch 30 feet from the center? 100 ft-100 ft → 50 ft *
Describe one similarity and one difference between the graphs of + || = 1 and + = || 1.
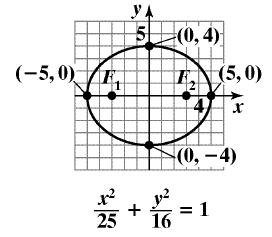
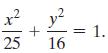
Describe how to locate the foci for x² 25 + y² 16 = 1.
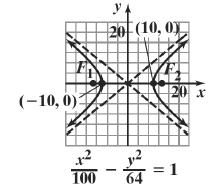
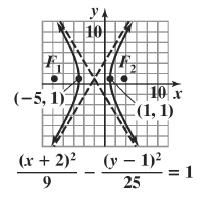
Use a graphing utility to graph any one of the hyperbolas that you graphed by hand in Exercises 43–50. Write the equation as a quadratic equation in y and use the quadratic formula to solve for y. Enter each of the two resulting equations to produce each branch of the hyperbola.Data from exercise
In 1992, a NASA team began a project called Spaceguard Survey, calling for an international watch for comets that might collide with Earth. Why is it more difficult to detect a possible “doomsday comet” with a hyperbolic orbit than one with an elliptical orbit?
Describe one similarity and one difference between the graphs of 2 25 + y² 16 = 1 and (x - 1)² 25 + (y - 1)² 16 1.
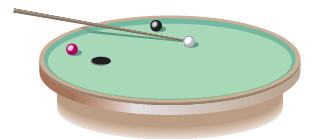
An elliptipool is an elliptical pool table with only one pocket. A pool shark places a ball on the table, hits it in what appears to be a random direction, and yet it bounces off the edge, falling directly into the pocket. Explain why this happens.
Use a graphing utility to graph x2/4 - y2/9 = 0. Is the graph a hyperbola? In general, what is the graph of x2/a2 - y2/b2 = 0?
Explain how to use y2 = 8x to find the parabola’s focus and directrix.
Write 4x2 - 6xy + 2y2 - 3x + 10y - 6 = 0 as a quadratic equation in y and then use the quadratic formula to express y in terms of x. Graph the resulting two equations using a graphing utility in a [-50, 70, 10] by [-30, 50, 10] viewing rectangle. What effect does the xy-term have on the graph of
If you are given the standard form of the equation of a parabola with vertex at the origin, explain how to determine if the parabola opens to the right, left, upward, or downward.
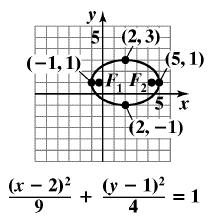
Use a graphing utility to graph any three of the ellipses that you graphed by hand in Exercises 37–50. First solve the given equation for y by using the square root property. Enter each of the two resulting equations to produce each half of the ellipse.Data from exercise 37-5037.38.39. (-1, 1) (x
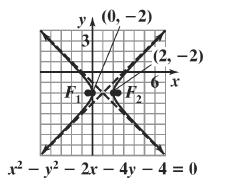
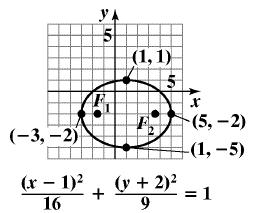
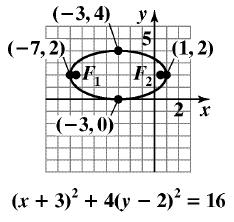
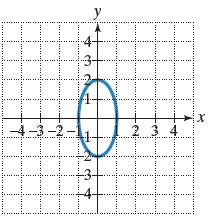
In Exercises 19–24, find the standard form of the equation of each ellipse and give the location of its foci. --4-3-2 N II 2 3 4 X
In Exercises 19–22, find the standard form of the equation of the conic section satisfying the given conditions.Hyperbola; Foci: (0, -3), (0, 3); Vertices: (0, -2), (0, 2)
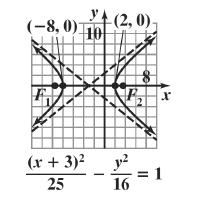
In Exercises 13–26, use vertices and asymptotes to graph each hyperbola. Locate the foci and find the equations of the asymptotes.9x2 - 4y2 = 36
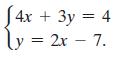
Exercises 69–71 will help you prepare for the material covered in the next section.Solve by the substitution method: √4x + 3y = 4 y = 2x - 7.
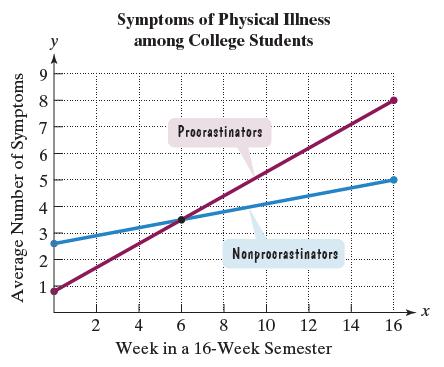
We opened this section with a study showing that late in the semester, procrastinating students reported more symptoms of physical illness than their nonprocrastinating peers.a. At the beginning of the semester, procrastinators reported an average of 0.8 symptoms, increasing at a rate of 0.45
In Exercises 69–70, rewrite each inequality in the system without absolute value bars. Then graph the rewritten system in rectangular coordinates. VI VI
In Exercises 69–72, determine whether each statement makes sense or does not make sense, and explain your reasoning.I use the same steps to solve nonlinear systems as I did to solve linear systems, although I don’t obtain linear equations when a variable is eliminated.
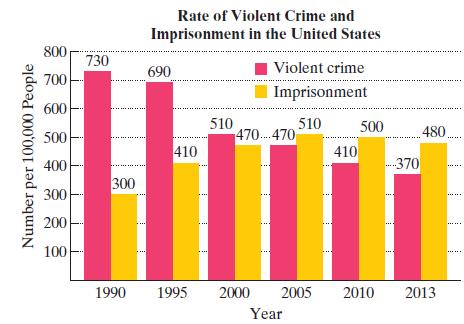
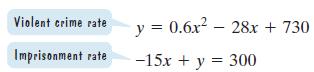
Between 1990 and 2013, there was a drop in violent crime and a spike in the prison population in the United States. The bar graph shows the number of violent crimes per 100,000 people and the number of imprisonments per 100,000 people for six selected years from 1990 through 2013.a. Based on the
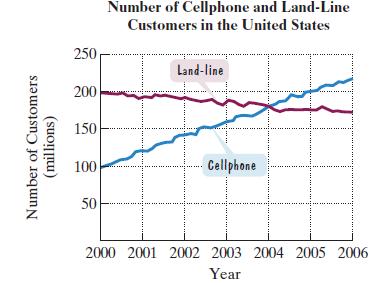
The graph shows that from 2000 through 2006, Americans unplugged land lines and switched to cellphones.a. Use the graphs to estimate the point of intersection. In what year was the number of cellphone and land-line customers the same? How many millions of customers were there for each?b. The
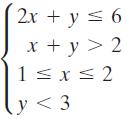
In Exercises 27–62, graph the solution set of each system of inequalities or indicate that the system has no solution. 2x + y = 6 x +y > 2 1≤x≤2 y < 3
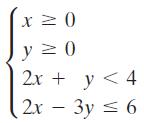
In Exercises 27–62, graph the solution set of each system of inequalities or indicate that the system has no solution. x>0 у≥ 0 2x + y < 4 2х - 3y < 6
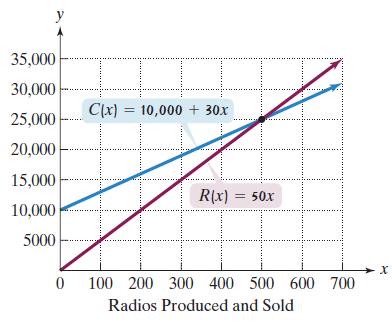
The figure shows the graphs of the cost and revenue functions for a company that manufactures and sells small radios. Use the information in the figure to solve Exercises 55–60.Use the formulas shown in the voice balloons to find R(300) - C(300). Describe what this means for the company.
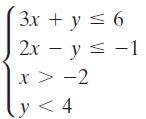
In Exercises 27–62, graph the solution set of each system of inequalities or indicate that the system has no solution. 3x + y = 6 2x - y = -1 x > −2 -2 y < 4
The figure shows the graphs of the cost and revenue functions for a company that manufactures and sells small radios. Use the information in the figure to solve Exercises 55–60.a. Use the formulas shown in the voice balloons to write the company’s profit function, P, from producing and selling
Exercises 61–64 describe a number of business ventures. For each exercise,a. Write the cost function, C.b. Write the revenue function, R.c. Determine the break-even point. Describe what this means.A company that manufactures bicycles has a fixed cost of $100,000. It costs $100 to produce each
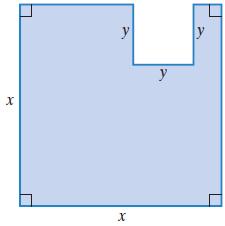
The figure shows a square floor plan with a smaller square area that will accommodate a combination fountain and pool. The floor with the fountain-pool area removed has an area of 21 square meters and a perimeter of 24 meters. Find the dimensions of the floor and the dimensions of the square that
Exercises 61–64 describe a number of business ventures. For each exercise,a. Write the cost function, C.b. Write the revenue function, R.c. Determine the break-even point. Describe what this means.You invest in a new play. The cost includes an overhead of $30,000, plus production costs of $2500
The figure shows the graphs of the cost and revenue functions for a company that manufactures and sells small radios. Use the information in the figure to solve Exercises 55–60.a. Use the formulas shown in the voice balloons to write the company’s profit function, P, from producing and selling
A paper manufacturing company converts wood pulp to writing paper and newsprint. The profit on a unit of writing paper is $500 and the profit on a unit of newsprint is $350.a. Let x represent the number of units of writing paper produced daily. Let y represent the number of units of newsprint
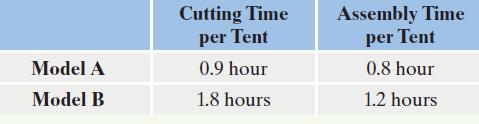
A manufacturer of lightweight tents makes two models whose specifications are given in the following table:Each month, the manufacturer has no more than 864 hours of labor available in the cutting department and at most 672 hours in the assembly division. The profits come to $25 per tent for model
In Exercises 63–64, write each sentence as an inequality in two variables. Then graph the inequality.The y-variable is at least 4 more than the product of -2 and the x-variable.
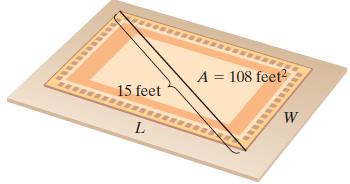
The area of a rug is 108 square feet and the length of its diagonal is 15 feet. Find the length and width of the rug. 15 feet L A = 108 feet² W
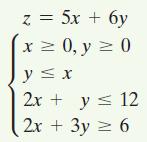
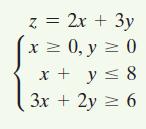
In Exercises 57–59, graph the region determined by the constraints. Then find the maximum value of the given objective function, subject to the constraints.Objective Function Constraints z = 5x + 6y x ≥ 0, y = 0 y ≤ x 2x + y ≤ 12 2x + 3y = 6
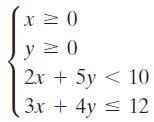
In Exercises 27–62, graph the solution set of each system of inequalities or indicate that the system has no solution. x ≥ 0 y ≥ 0 2x + 5y < 10 3x + 4y = 12
Exercises 61–64 describe a number of business ventures. For each exercise,a. Write the cost function, C.b. Write the revenue function, R.c. Determine the break-even point. Describe what this means.You invested $30,000 and started a business writing greeting cards. Supplies cost 2¢ per card and
In Exercises 63–64, write each sentence as an inequality in two variables. Then graph the inequality.The y-variable is at least 2 more than the product of -3 and the x-variable.
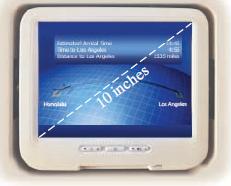
Use the formula for the area of a rectangle and the Pythagorean Theorem to solve Exercises 59–60.A small television has a picture with a diagonal measure of 10 inches and a viewing area of 48 square inches. Find the length and width of the screen. etrod Arg 10 inches P Low Are
What is a system of nonlinear equations? Provide an example with your description.
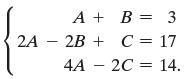
Exercises 58–60 will help you prepare for the material covered in the next section.Solve: A + B = 2A 2B + C = 4A 2C 3 17 14.
Use an extension of the Great Question! to describe how to set up the partial fraction decomposition of a rational expression that contains powers of a prime cubic factor in the denominator. Give an example of such a decomposition.
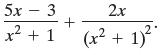
Exercises 58–60 will help you prepare for the material covered in the next section.Add: 5r – 3 x² + 1 + 2x (x² + 1)²
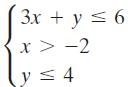
In Exercises 27–62, graph the solution set of each system of inequalities or indicate that the system has no solution. 3x + y ≤ 6 x>-2 y ≤ 4
Exercises 61–64 describe a number of business ventures. For each exercise,a. Write the cost function, C.b. Write the revenue function, R.c. Determine the break-even point. Describe what this means.A company that manufactures small canoes has a fixed cost of $18,000. It costs $20 to produce each
Explain how to solve a nonlinear system using the substitution method. Use x2 + y2 = 9 and 2x - y = 3 to illustrate your explanation.
I apply partial fraction decompositions for rational expressions of the form P(x)/Q(x) , where P and Q have no common factors and the degree of P is greater than the degree of Q.
In Exercises 60–63, determine whether each statement makes sense or does not make sense, and explain your reasoning.Partial fraction decomposition involves finding a single rational expression for a given sum or difference of rational expressions.
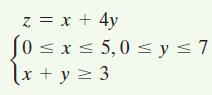
In Exercises 57–59, graph the region determined by the constraints. Then find the maximum value of the given objective function, subject to the constraints.Objective Function Constraints z = x + 4y 6. (0 ≤x≤ 5,0 ≤ y ≤7 x +y = 3 VI
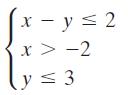
In Exercises 27–62, graph the solution set of each system of inequalities or indicate that the system has no solution. x=y≤2 x > −2 -2 y ≤ 3
In Exercises 27–38, evaluate each function at the given values of the independent variable and simplify.a.b.c. f(r) = √r + 6 +3
Exercises 58–60 will help you prepare for the material covered in the next section.Subtract: 3 x - 4 2 x + 2
The figure shows the graphs of the cost and revenue functions for a company that manufactures and sells small radios. Use the information in the figure to solve Exercises 55–60.Use the formulas shown in the voice balloons to find R(200) - C(200). Describe what this means for the company.
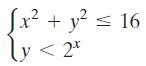
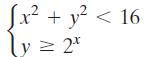
In Exercises 27–62, graph the solution set of each system of inequalities or indicate that the system has no solution. √x² + y² ≤ 16 y < 2t 2.
In Exercises 57–59, graph the region determined by the constraints. Then find the maximum value of the given objective function, subject to the constraints.Objective Function Constraints x z = 2х + 3у > 0, y ≥ 0 x+y< 8 3x + 2y ≥ 6 N
The figure shows the graphs of the cost and revenue functions for a company that manufactures and sells small radios. Use the information in the figure to solve Exercises 55–60.More than how many radios must be produced and sold for the company to have a profit?
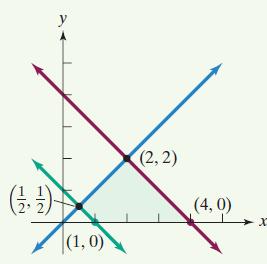
Find the value of the objective function z = 2x + 3y at each corner of the graphed region shown. What is the maximum value of the objective function? What is the minimum value of the objective function? (1¹) У о (1,0) (2, 2) (4,0) X
In Exercises 27–62, graph the solution set of each system of inequalities or indicate that the system has no solution. [x² + y² < 16 y = 2x IV
The figure shows the graphs of the cost and revenue functions for a company that manufactures and sells small radios. Use the information in the figure to solve Exercises 55–60.How many radios must be produced and sold for the company to break even?
Find the length and width of a rectangle whose perimeter is 40 feet and whose area is 96 square feet.
The height of a ball thrown across a field, f(x), in feet, can be modeled by f(x) = -0.005x2 + x + 5, where x is the ball’s horizontal distance, in feet, from the point where it was thrown.a. What is the maximum height of the ball and how far from where it was thrown does this occur?b. How far
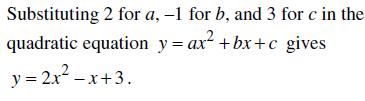
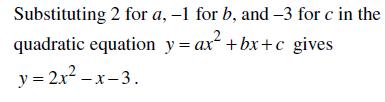
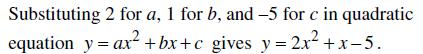
Verify your results in Exercises 19–22 by using a graphing utility to graph the resulting parabola. Trace along the curve and convince yourself that the three points given in the exercise lie on the parabola.Data from exercise 19-2219.20.21.22. Substituting 2 for a, -1 for b, and 3 for c in
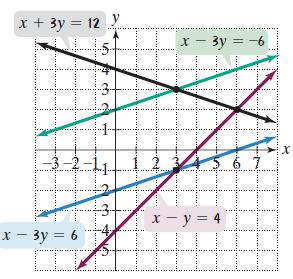
Use the graphs of the linear functions to solve Exercises 53–54.Write the linear system whose solution set is Φ. Express each equation in the system in slope-intercept form. x + 3y = 12 y. 5+ -3-2 x - 3y = 6 CIV -3+ x - 3y = -6 HAX x - y = 4 TO X
Find the length and width of a rectangle whose perimeter is 36 feet and whose area is 77 square feet.
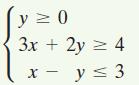
In Exercises 46–55, graph the solution set of each system of inequalities or indicate that the system has no solution. y ≥ 0 3x + 2y = 4 x y ≤ 3
How can you verify your result for the partial fraction decomposition for a given rational expression without using a graphing utility?
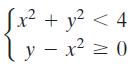
In Exercises 27–62, graph the solution set of each system of inequalities or indicate that the system has no solution. S.x² + y² < 4 y = x² ≥ 0 - = =
Explain how to find the partial fraction decomposition of a rational expression with a repeated, prime quadratic factor in the denominator.
A system for tracking ships indicates that a ship lies on a path described by 2y2 - x2 = 1. The process is repeated and the ship is found to lie on a path described by 2x2 - y2 = 1. If it is known that the ship is located in the first quadrant of the coordinate system, determine its exact
In Exercises 11–38, use the given conditions to write an equation for each line in point-slope form and slope-intercept form. x-intercept - and y-intercept = 4
Solve: 3x2 + 1 = x2 + x.
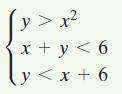
In Exercises 46–55, graph the solution set of each system of inequalities or indicate that the system has no solution. y > x² x + y < 6 {y < x + 6
Explain how to find the partial fraction decomposition of a rational expression with a prime quadratic factor in the denominator.
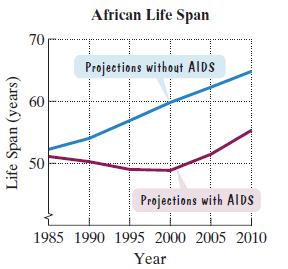
Group members should develop appropriate functions that model each of the projections shown in Exercise 45.Data from exercise 45AIDS is taking a deadly toll on southern Africa. Describe how to use the techniques that you learned in this section to obtain a model for African life span using
A planet’s orbit follows a path described by 16x2 + 4y2 = 64. A comet follows the parabolic path y = x2 - 4. Where might the comet intersect the orbiting planet?
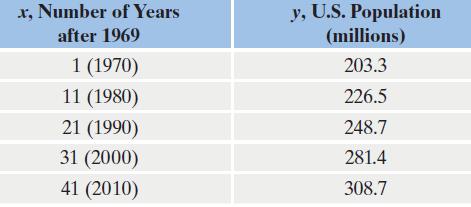
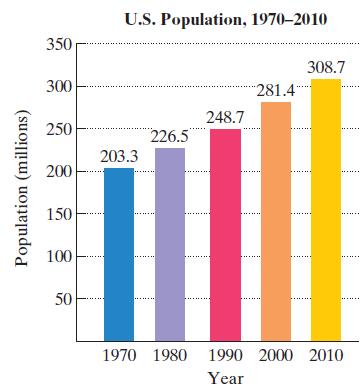
In Example 1, we used two data points and an exponential function to model the population of the United States from 1970 through 2010. The data are shown again in the table. Use all five data points to solve Exercises 66–70.Data from example 1The graph in Figure 4.22 shows the U.S. population, in
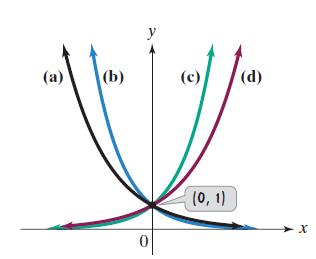
The graphs labeled (a)–(d) in the figure represent y = 3x, y = 5x, y = (1/3)x, and y = (1/5)x, but not necessarily in that order. Which is which? Describe the process that enables you to make this decision. (a) (b) y 0 (c) (0, 1) (d) X
Showing 3500 - 3600
of 13634
First
29
30
31
32
33
34
35
36
37
38
39
40
41
42
43
Last
Step by Step Answers