New Semester
Started
Get
50% OFF
Study Help!
--h --m --s
Claim Now
Question Answers
Textbooks
Find textbooks, questions and answers
Oops, something went wrong!
Change your search query and then try again
S
Books
FREE
Study Help
Expert Questions
Accounting
General Management
Mathematics
Finance
Organizational Behaviour
Law
Physics
Operating System
Management Leadership
Sociology
Programming
Marketing
Database
Computer Network
Economics
Textbooks Solutions
Accounting
Managerial Accounting
Management Leadership
Cost Accounting
Statistics
Business Law
Corporate Finance
Finance
Economics
Auditing
Tutors
Online Tutors
Find a Tutor
Hire a Tutor
Become a Tutor
AI Tutor
AI Study Planner
NEW
Sell Books
Search
Search
Sign In
Register
study help
mathematics
precalculus
Calculus Early Transcendentals 8th edition James Stewart - Solutions
Use a computer to graph the function using various domains and viewpoints. Get a printout of one that, in your opinion, gives a good view. If your software also produces level curves, then plot some contour lines of the same function and compare with the graph.f (x, y) = xy2 - x3 (monkey saddle)
If V(x, y) is the electric potential at a point (x, y) in the xy-plane, then the level curves of V are called equipotential curves because at all points on such a curve the electric potential is the same. Sketch some equipotential curves if V(x, y) = c/√r2 - x2 - y2 , where c is a positive
A thin metal plate, located in the xy-plane, has temperature T(x, y) at the point (x, y). Sketch some level curves (isothermals) if the temperature function is given byT(x, y) = 100/1 + x2 + 2y2
Sketch both a contour map and a graph of the function and compare them.f (x, y) = √36 - 9x2 - 4y2
Sketch both a contour map and a graph of the function and compare them.f (x, y) = x2 + 9y2
Draw a contour map of the function showing several level curves.f (x, y) = y/(x2 + y2)
Draw a contour map of the function showing several level curves.f (x, y) = 3√x2 + y2
Draw a contour map of the function showing several level curves.f (x, y) = y - arctan x
Draw a contour map of the function showing several level curves.f (x, y) = yex
Draw a contour map of the function showing several level curves.f (x, y) = ln(x2 + 4y2)
Draw a contour map of the function showing several level curves.f (x, y) = √x + y
Draw a contour map of the function showing several level curves.f (x, y) = xy
Draw a contour map of the function showing several level curves.f (x, y) = x2 - y2
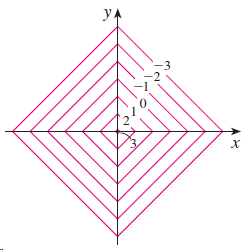
A contour map of a function is shown. Use it to make a rough sketch of the graph of f . Ул х
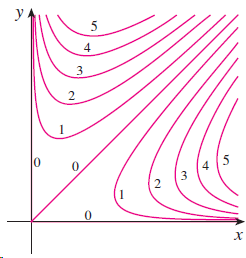
A contour map of a function is shown. Use it to make a rough sketch of the graph of f . 4 10 4 х 2.
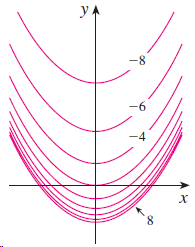
A contour map of a function is shown. Use it to make a rough sketch of the graph of f . yA -9- 8.
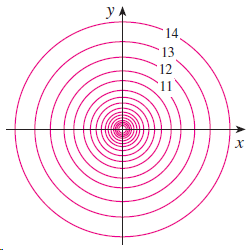
A contour map of a function is shown. Use it to make a rough sketch of the graph of f . ул 14 13 12 х
The body mass index is defined in Exercise 39. Draw the level curve of this function corresponding to someone who is 200 cm tall and weighs 80 kg. Find the weights and heights of two other people with that same level curve.
The body mass index (BMI) of a person is defined by B(m, h) = m/h2 where m is the person’s mass (in kilograms) and h is the height (in meters). Draw the level curves B(m, h) = 18.5, B(m, h) = 25, B(m, h) = 30, and B(m, h) = 40. A rough guideline is that a person is underweight if the BMI is less
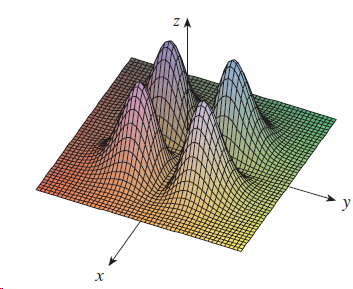
Make a rough sketch of a contour map for the function whose graph is shown. ZA х
Locate the points A and B on the map of Lonesome Mountain (Figure 12). How would you describe the terrain near A? Near B?
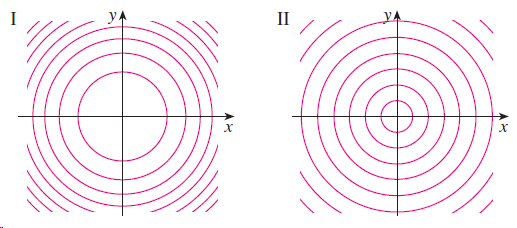
Two contour maps are shown. One is for a function f whose graph is a cone. The other is for a function g whose graph is a paraboloid. Which is which, and why? I II
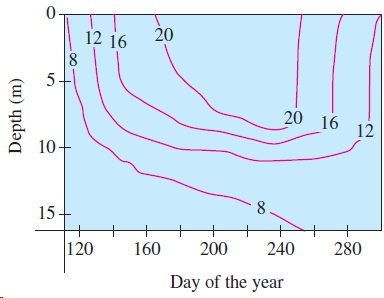
Level curves (isothermals) are shown for the typical water temperature sin 8Cd in Long Lake (Minnesota) as a function of depth and time of year. Estimate the temperature in the lake on June 9 (day 160) at a depth of 10 m and on June 29 (day 180) at a depth of 5 m. 20 12 16 20 16 12 10+ 15 280 240
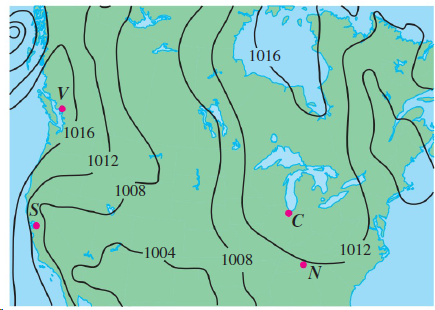
Shown is a contour map of atmospheric pressure in North America on August 12, 2008. On the level curves (called isobars) the pressure is indicated in millibars (mb).(a) Estimate the pressure at C (Chicago), N (Nashville), S (San Francisco), and V (Vancouver).(b) At which of these locations were the
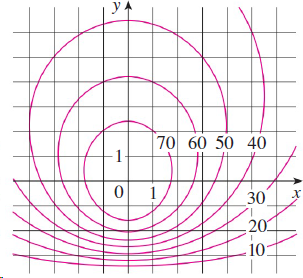
A contour map for a function f is shown. Use it to estimate the values of f (-3, 3) and f (3, -2). What can you say about the shape of the graph? 70 60 50 40 30 20 10:
Sketch the graph of the function.f (x, y) = √4 - 4x2 - y2
Sketch the graph of the function.f (x, y) = √4x2 + y2
Sketch the graph of the function.f (x, y) = x2 + 4y2 + 1
Sketch the graph of the function.f (x, y) = 2 - x2 - y2
Sketch the graph of the function.f (x, y) = sin x
Sketch the graph of the function.f (x, y) = cos y
Sketch the graph of the function.f (x, y) = 10 - 4x - 5y
Sketch the graph of the function.f (x, y) = x2
Sketch the graph of the function.f (x, y) = y
Find and sketch the domain of the function.f (x, y, z) = ln(16 - 4x2 - 4y2 - z2)
Find and sketch the domain of the function.f (x, y, z) = √4 - x2 + √9 - y2 + √1 - z2
Find and sketch the domain of the function.f (x, y) = sin-1(x + y)
Find and sketch the domain of the function.f (x, y) = √y - x2/1 - x2
Find and sketch the domain of the function.g(x, y) = ln(2 - x)/1 - x2 - y2
Find and sketch the domain of the function.t(x, y) = x - y/x + y
Find and sketch the domain of the function.f (x, y) = √x2 + y2 - 4
Find and sketch the domain of the function.f (x, y) = ln(9 - x2 - 9y2)
Find and sketch the domain of the function.f (x, y) = 4√x - 3y
Find and sketch the domain of the function.f(x, y) = √x - 2 + √y - 1
Let g(x, y, z) = x3y2z √10 - x - y - z .(a) Evaluate g(1, 2, 3).(b) Find and describe the domain of g.
Let f(x, y, z) = (x + √y + √z + ln(4 - x2 - y2 - z2).(a) Evaluate f (1, 1, 1).(b) Find and describe the domain of f.
Let F(x, y) = 1 + √4 - y2.(a) Evaluate F(3, 1).(b) Find and sketch the domain of F.(c) Find the range of F.
Let g(x, y) = cos(x + 2y).(a) Evaluate g(2, -1).(b) Find the domain of g.(c) Find the range of g.
A company makes three sizes of cardboard boxes: small, medium, and large. It costs $2.50 to make a small box, $4.00 for a medium box, and $4.50 for a large box. Fixed costs are $8000.(a) Express the cost of making x small boxes, y medium boxes, and z large boxes as a function of three variables:C =
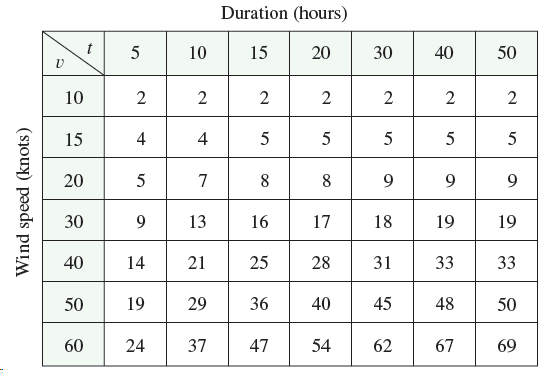
The wave heights h in the open sea depend on the speed v of the wind and the length of time t that the wind has been blowing at that speed. Values of the function h = f (v, t) are recorded in feet in Table 4.(a) What is the value of f (40, 15)? What is its meaning?(b) What is the meaning of the
The wind-chill index W discussed in Example 2 has been modeled by the following function:W(T, v) = 13.12 + 0.6215T - 11.37v0.16 1 0.3965Tv0.16
A model for the surface area of a human body is given by the functionS = f (w, h) = 0.1091w0.425h0.725where w is the weight (in pounds), h is the height (in inches), and S is measured in square feet.(a) Find f (160, 70) and interpret it.(b) What is your own surface area?
Verify for the Cobb-Douglas production functionP(L, K) = 1.01L0.75K0.25discussed in Example 3 that the production will be doubled if both the amount of labor and the amount of capital are doubled. Determine whether this is also true for the generalproduction functionP(L, K) = bLaK1-a
A manufacturer has modeled its yearly production function P (the monetary value of its entire production in millions of dollars) as a Cobb-Douglas functionP(L, K) = 1.47L0.65K0.35where L is the number of labor hours (in thousands) and K is the invested capital (in millions of dollars). Find P(120,
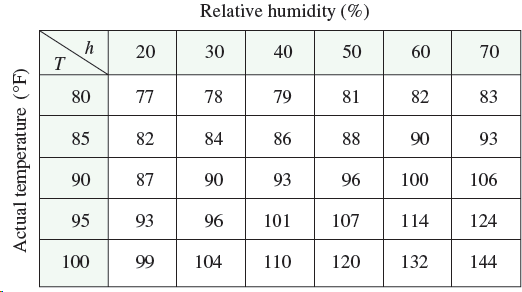
The temperature-humidity index I (or humidex, for short) is the perceived air temperature when the actual temperature is T and the relative humidity is h, so we can write I = f (T, h). The following table of values of I is an excerpt from a table compiled by the National Oceanic & Atmospheric
In Example 2 we considered the function W = f (T, v), where W is the wind-chill index, T is the actual temperature, and v is the wind speed. A numerical representation is given in Table 1 on page 889.(a) What is the value of f (215, 40)? What is its meaning?(b) Describe in words the meaning of the
Find the tangential and normal components of the acceleration vector of a particle with position functionr(t) = t i + 2t j + t2 k
A projectile is launched with an initial speed of 40 m/s from the floor of a tunnel whose height is 30 m. What angle of elevation should be used to achieve the maximum possible horizontal range of the projectile? What is the maximum range?
An athlete throws a shot at an angle of 458 to the horizontal at an initial speed of 43 ft/s. It leaves his hand 7 ft above the ground.(a) Where is the shot 2 seconds later?(b) How high does the shot go?(c) Where does the shot land?
A particle starts at the origin with initial velocity i- j + 3k. Its acceleration is a(t) = 6t i + 12t2 j - 6t k. Find its position function.
Find the velocity, speed, and acceleration of a particle moving with position function r(t) = (2t2 - 3) i + 2t j. Sketch the path of the particle and draw the position, velocity, and acceleration vectors for t = 1.
A particle moves with position function r(t) = t ln t i + t j + e-t k. Find the velocity, speed, and acceleration of the particle.
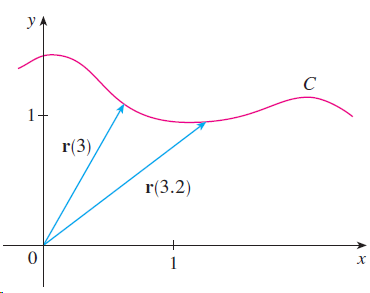
The figure shows the curve C traced by a particle with position vector r(t) at time t.(a) Draw a vector that represents the average velocity of the particle over the time interval 3 < t < 3.2.(b) Write an expression for the velocity v(3).(c) Write an expression for the unit tangent vector
Find an equation of the osculating plane of the curve x = sin 2t, y = t, z = cos 2t at the point (0, π, 1).
Find an equation of the osculating circle of the curve y = x4 - x2 at the origin. Graph both the curve and its osculating circle.
Find the curvature of the curve y = x4 at the point (1, 1).
Find the curvature of the ellipse x = 3 cos t, y = 4 sin t at the points (3, 0) and (0, 4).
For the curve given by r(t) = (sin3t, cos3t, sin2t), 0 < t < y2, find(a) The unit tangent vector,(b) The unit normal vector,(c) The unit binormal vector, and(d) The curvature.
Reparametrize the curve r(t) = et i + etsin t j + et cos t k with respect to arc length measured from the point (1, 0, 1) in the direction of increasing t.
The helix r1(t) = cos ti + sin t j + t k intersects the curve r2(t) = (1 + t) i + t2j + t3 k at the point (1, 0, 0). Find the angle of intersection of these curves.
Find the length of the curve r(t) = (2t3/2, cos 2t, sin 2t), 0 < t < 1.
Use Simpson’s Rule with n = 6 to estimate the length of the arc of the curve with equations x = t2, y = t3, z = t4, 0 < t < 3.
Let C be the curve with equations x = 2 - t3, y = 2t - 1, z = ln t. Find (a) the point where C intersects the xz-plane,(b) parametric equations of the tangent line at (1, 1, 0), and(c) an equation of the normal plane to C at (1, 1, 0).
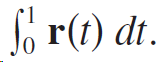
If r(t) = t - i + t cos tπ j + sin πt k, evaluate So r(t) dt.
Find parametric equations for the tangent line to the curve x = 2 sin t, y = 2 sin 2t , z = 2 sin 3t at the point (1, √3 , 2). Graph the curve and the tangent line on a common screen.
Find a vector function that represents the curve of intersection of the cylinder x2 + y2 = 16 and the plane x + z = 5.
(a) Sketch the curve with vector function r(t) = ti + cos πt j + sin πt k t > 0(b) Find r'(t) and r''(t).
Determine whether the statement is true or false. If it is true, explain why. If it is false, explain why or give an example that disproves the statement.Different parametrizations of the same curve result in identical tangent vectors at a given point on the curve.
Determine whether the statement is true or false. If it is true, explain why. If it is false, explain why or give an example that disproves the statement.The osculating circle of a curve C at a point has the same tangent vector, normal vector, and curvature as C at that point.
Determine whether the statement is true or false. If it is true, explain why. If it is false, explain why or give an example that disproves the statement.If |r(t)| = 1 for all t, then r'(t) is orthogonal to r(t) for all t.
Determine whether the statement is true or false. If it is true, explain why. If it is false, explain why or give an example that disproves the statement.If |r(t)| = 1 for all t, then |r'(t)| is a constant.
Determine whether the statement is true or false. If it is true, explain why. If it is false, explain why or give an example that disproves the statement.If (t) = 0 for all t, the curve is a straight line.
Determine whether the statement is true or false. If it is true, explain why. If it is false, explain why or give an example that disproves the statement.Suppose f is twice continuously differentiable. At an inflection point of the curve y = f (x), the curvature is 0.
Determine whether the statement is true or false. If it is true, explain why. If it is false, explain why or give an example that disproves the statement.The binormal vector is B(t) = N(t) x T(t).
Determine whether the statement is true or false. If it is true, explain why. If it is false, explain why or give an example that disproves the statement.If T(t) is the unit tangent vector of a smooth curve, then the curvature is k = |dT/dt|.
Determine whether the statement is true or false. If it is true, explain why. If it is false, explain why or give an example that disproves the statement.If r(t) is a differentiable vector function, then d/dt |r(t)| = |r'(t)|
Determine whether the statement is true or false. If it is true, explain why. If it is false, explain why or give an example that disproves the statement.If u(t) and v(t) are differentiable vector functions, then -[u(t) X v(t)] = u'(f) × v'(t) dt
Determine whether the statement is true or false. If it is true, explain why. If it is false, explain why or give an example that disproves the statement.The derivative of a vector function is obtained by differentiating each component function.
Determine whether the statement is true or false. If it is true, explain why. If it is false, explain why or give an example that disproves the statement.The curve r(t) = (2t, 3 - t, 0) is a line that passes through the origin.
Determine whether the statement is true or false. If it is true, explain why. If it is false, explain why or give an example that disproves the statement.The curve r(t) = (0, t2, 4t) is a parabola.
Show that if a particle moves with constant speed, then the velocity and acceleration vectors are orthogonal.
Find the velocity, acceleration, and speed of a particle with the given position function. Sketch the path of the particle and draw the velocity and acceleration vectors for the specified value of t.r(t) = 3 cos t i + 2 sin t j, t = π/3
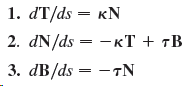
The following formulas, called the Frenet-Serret formulas, are of fundamental importance in differential geometry:1. dT/ds = kN2. dN/ds = kT + τB3. dB/ds = -τN 1. dT/as — кN 2. dN/ds — - кT + тВ 3. dB/ds — —тN
Show that the curvature of a plane curve is k = |dΦ/ds|, where Φ is the angle between T and i; that is, Φ is the angle of inclination of the tangent line. (This shows that the definition of curvature is consistent with the definition for plane curves given in Exercise 10.2.69.)
Find equations of the normal plane and osculating plane of the curve at the given point.x = sin 2t, y = 2cos 2t, z = 4t; (0, 1, 2π)
Find the vectors T, N, and B at the given point.r(t) = (cos t, sin t, ln cos t), (1, 0, 0)
Find the vectors T, N, and B at the given point.r(t) = (t2, 2/3 t3, t), (1, 2/3, 1)
Use the formula in Exercise 42 to find the curvature.x = a cos wt, y = b sin wt
Plot the space curve and its curvature function (t). Comment on how the curvature reflects the shape of the curve.r(t) = (tet, e-t, √2 t), -5 < t < 5
Plot the space curve and its curvature function (t). Comment on how the curvature reflects the shape of the curve.r(t) = (t - sin t, 1 - cos t, 4 cos(t/2) ), 0 < t < 8
Showing 15900 - 16000
of 29454
First
153
154
155
156
157
158
159
160
161
162
163
164
165
166
167
Last
Step by Step Answers