

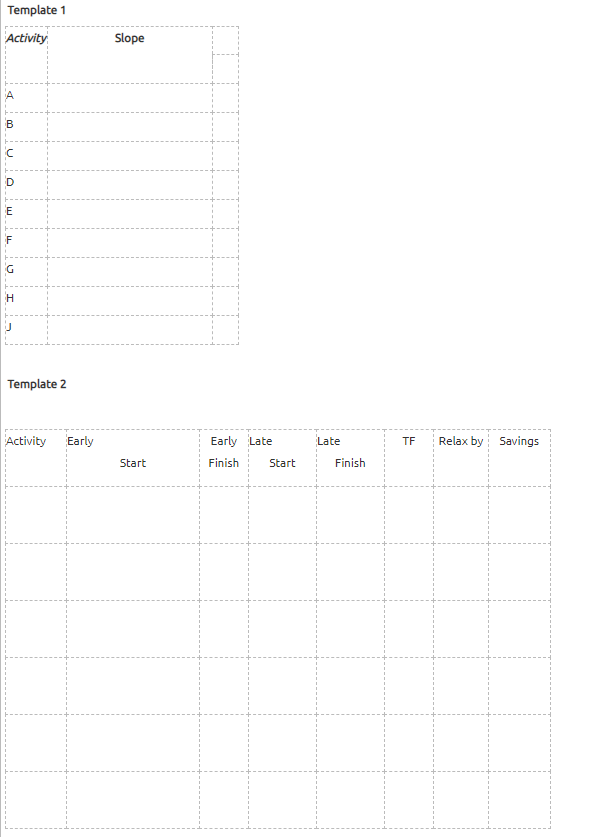
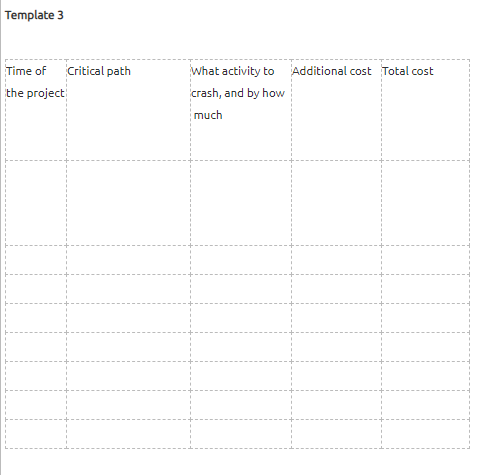
Question: include the drawing of normal time and crashed time Given the following table: Activity Predecessor Time Cost Normal Crashed Normal Crashed W | 16 13
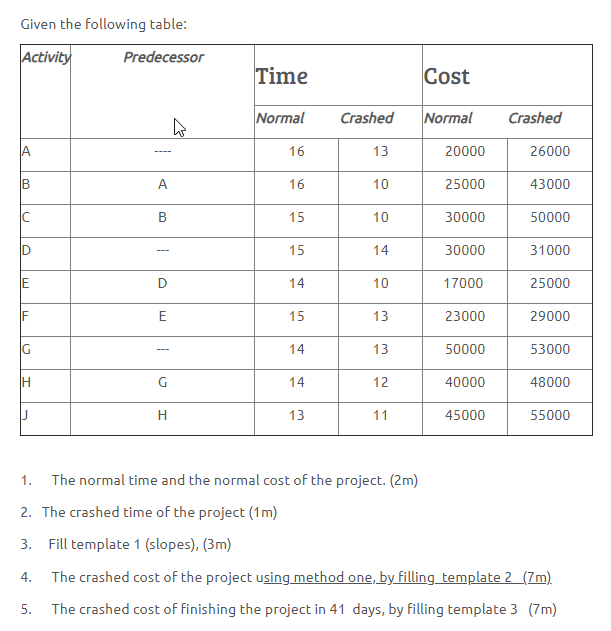
include the drawing of normal time and crashed time
Step by Step Solution
There are 3 Steps involved in it
1 Expert Approved Answer
Step: 1 Unlock

Question Has Been Solved by an Expert!
Get step-by-step solutions from verified subject matter experts
Step: 2 Unlock
Step: 3 Unlock