New Semester
Started
Get
50% OFF
Study Help!
--h --m --s
Claim Now
Question Answers
Textbooks
Find textbooks, questions and answers
Oops, something went wrong!
Change your search query and then try again
S
Books
FREE
Study Help
Expert Questions
Accounting
General Management
Mathematics
Finance
Organizational Behaviour
Law
Physics
Operating System
Management Leadership
Sociology
Programming
Marketing
Database
Computer Network
Economics
Textbooks Solutions
Accounting
Managerial Accounting
Management Leadership
Cost Accounting
Statistics
Business Law
Corporate Finance
Finance
Economics
Auditing
Tutors
Online Tutors
Find a Tutor
Hire a Tutor
Become a Tutor
AI Tutor
AI Study Planner
NEW
Sell Books
Search
Search
Sign In
Register
study help
sciences
statistical reasoning for everyday life
Statistical Reasoning For Everyday Life 5th Edition Jeff Bennett, William Briggs, Mario Triola - Solutions
If you incorrectly conclude that Google employees have a mean IQ score greater than 115 when their actual mean IQ score is equal to 115, have you made a type I error or a type II error?In Exercises, assume that we want to use a 0.05 significance level to test the claim that the mean IQ score of
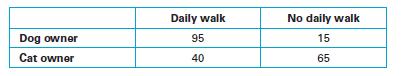
Consider the following (hypothetical) data describing a survey in which dog and cat owners are asked whether they go for daily walks. Assume that we want to use a 0.01 significance level to test the claim that whether you own a dog or a cat is independent of whether you take a daily walk.a. What is
Propose an experiment that could be used to test the safety of GM food, such as corn. Describe your experiment in detail, and discuss any practical difficulties that might be involved in carrying it out or interpreting its results.
A researcher obtains random samples of SAT scores from students at three different colleges. She plans to use the three sets of sample data with the method of analysis of variance. Identify the null and alternative hypotheses.
When interpreting a P-value of 0.45, a researcher states that the results are statistically significant because the P-value is less than 0.5, indicating that the results are not likely to occur by chance.
Some people advocate giving the choice about GM foods to consumers by requiring labeling on all products that contain genetically modified ingredients. Find out what major scientific organizations say on the issue of labeling, and why. Then decide for yourself whether you think labeling is a good
Test statistic: x2 = 3.499; significance level: 0.05 Survey Results. In Exercise, assume that a yes/no survey question is presented to a simple random sample of male and female subjects and the results are summarized in a twoway table with the format of the table below. Use the given value of the
A researcher obtains random samples of SAT scores from students at three different colleges. She plans to use the three sets of sample data with the method of analysis of variance. Identify the null and alternative hypotheses.Figure 10.3a. What is the null hypothesis?b. What is the alternative
Select a particular quarter and test the claim that it favors heads when flipped. State the null and alternative hypotheses; then flip the quarter 100 times. Applying only common sense, what do you conclude about the claim that the quarter favors heads?
Type I and Type II Errors. In Exercise, a null and alternative hypothesis are given. Without using the terms “null hypothesis” and “alternative hypothesis,” explain the meaning of type I and type II errors in each case.H0: The lottery is fair.Ha: The lottery is biased.
Using only the service times from McDonald’s, construct a 95% confidence interval estimate of the population mean.
Using only the service times from McDonald’s, use a 0.05 significance level to test the claim that the sample is from a population with a mean of 180 seconds.
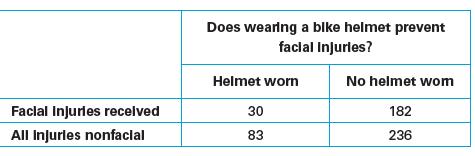
As part of the results from the test described in Exercise 1, P-value of 0.001 is obtained. What do you conclude?Exercise 1Assuming that we want to use the data in the table below to test for independence between wearing a helmet and receiving facial injuries in a bicycle accident, find the
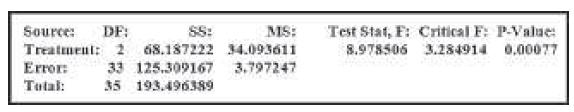
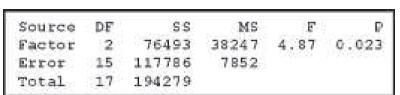
Using the samples of service times from all three restaurants, we obtain the analysis of variance results shown in Figure 10.7. Use a 0.05 significance level to test the claim that the three restaurants have the same mean service time. Source DF SS Factor 2 76493 Error 15 117786 Total 17
A simple random sample of 25 blood platelet counts is obtained from a normally distributed population with an unknown standard deviation. Which of the following distributions is most appropriate for a hypothesis test involving a claim about a population mean?a. normal distributionb. t
What are the null and alternative hypotheses for a claim that the mean weight of NFL professional football players is greater than 200 pounds?
What type of hypothesis test would be used to test the claim in Exercise 5: left-tailed, right-tailed, or two-tailed?Exercise 5What are the null and alternative hypotheses for a claim that the mean weight of NFL professional football players is greater than 200 pounds?
Assume that you want to test the claim that adult males in California, New York, Colorado, and Texas have the same mean height. What method would you use to test that claim?
If the hypothesis test of the claim described in Exercise 7 results in a P-value of 0.757, what do you conclude about the null hypothesis?Exercise 7Assume that you want to test the claim that adult males in California, New York, Colorado, and Texas have the same mean height. What method would you
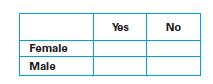
A two-way table, constructed from survey results, consists of two rows representing gender (male/female) and two columns representing the response to a question. What is the null hypothesis for a test to determine whether there is some relationship between gender and response?
If the hypothesis test described in Exercise 9 results in a P-value of 0.001, what do you conclude about the null hypothesis?Exercise 9 A two-way table, constructed from survey results, consists of two rows representing gender (male/female) and two columns representing the response to a
Briefly explain the meaning of the x2 statistic. What does it tell us if the value of this statistic is small? How do you use the x2 statistic to decide whether to reject the null hypothesis?
In hypothesis tests, if the significance level is 0.01, then the P-value is also 0.01.Does It Make Sense? For Exercise, determine whether the statement makes sense (or is clearly true) or does not make sense (or is clearly false). Explain clearly. Not all of these statements have definitive
What is the null hypothesis?In Exercises, assume that we want to use a 0.05 significance level to test the claim that the mean IQ score of Google employees is greater than 115.
Smoking, alcohol abuse and drug abuse are well known to be major risk factors in disease and early death, and all three of these are more prevalent among people with lower levels of education. Given that reducing rates of smoking and drug/ alcohol abuse is considered to be an important public
You should always use the t distribution when the sample size is only n = 5.Does It Make Sense? For Exercises 5–8, determine whether the statement makes sense (or is clearly true) or does not make sense (or is clearly false). Explain clearly. Not all of these statements have definitive answers,
In a two-way table for major and gender, the observed frequencies were very different from the expected frequencies, so I concluded that major and gender are independent variable
In an ANOVA test for equality of mean skull breadths of Egyptian males from three different epochs, the P-value of 0.0031 is obtained. We conclude that the mean skull breadths from the three different epochs are all equal.
To learn about smartphone ownership, I chose a null hypothesis claiming that the proportion of adults who own a smartphone is equal to 0.8, and the result of my hypothesis test proved this claim to be true.
When conducting hypothesis tests, you need to consider a different set of critical values for two-tailed tests than for one-tailed tests.Does It Make Sense? For Exercise, determine whether the statement makes sense (or is clearly true) or does not make sense (or is clearly false). Explain clearly.
In a test of the claim that a majority of Americans believe that human activity is the major cause of global warming, the null hypothesis is p = 0.5 and the alternative hypothesis is p > 0.5.
What is the alternative hypothesis?In Exercises, assume that we want to use a 0.05 significance level to test the claim that the mean IQ score of Google employees is greater than 115.
Education also correlates with numerous other benefits, including healthier lives (as well as longer lives), higher levels of income, and higher levels of general well-being. Do these facts affect you personally in any way? Should they affect public policy? Discuss with friends or classmates.
In testing a claim about a population mean, the t distribution is always used when the population standard deviation s is not known.
In a two-way table, all of the observed frequencies are very close to the expected frequencies, so the x2 statistic is very small.
In an ANOVA test for equality of mean IQ scores of students majoring in history, psychology, and art, the P-value of 0.242 is obtained. Based on the P-value, we cannot support the alternative hypothesis that at least one of the three means is different from the others.
In testing a claim about a population mean, if the standard score for a sample mean is z = 0, then there is not sufficient sample evidence to support the alternative hypothesis.Does It Make Sense? For Exercise, determine whether the statement makes sense (or is clearly true) or does not make sense
In a hypothesis test involving a claim made about a population proportion, if there is sufficient evidence to reject the null hypothesis, then there may or may not be sufficient evidence to support the alternative hypothesis.
If the hypothesis test results in a P-value of 0.100, what do you conclude about the given claim?In Exercises, assume that we want to use a 0.05 significance level to test the claim that the mean IQ score of Google employees is greater than 115.
Do GM foods have any toxic effects or cause allergic reactions in humans, and if so, are these dangers greater than those from non-GM foods?
You want to test the claim that the mean annual income of all movie stars is greater than $1 million, but you know that income data are not normally distributed (they are right-skewed). Therefore you cannot use the t distribution to test the claim with a sample consisting of only 5 movie star
In a two-way table, all of the observed frequencies are lower than the expected frequencies, so the x2 statistic is negative.
The Atkins, Zone, Weight Watchers, and Ornish diets were tested in clinical trials. For each participant in the trials, the amount of weight loss was recorded, and results from the analysis of variance show that the four diets are all effective in causing weight loss.
The principal claimed that the school’s mean SAT score was above 650. A hypothesis test seemed to back her up, but it later turned out that the mean score was exactly 650.Therefore, the test resulted in type I error of wrongly rejecting the null hypothesis.Does It Make Sense? For Exercise,
The area to the right of the standard score z = 1.0 is 0.1587, so the P-value in a two-tailed test is 0.1587.
What are the two possible conclusions that can be reached about the null hypothesis?In Exercises, assume that we want to use a 0.05 significance level to test the claim that the mean IQ score of Google employees is greater than 115.
What does the risk of environmental damage by GM crops?
I was able to estimate the mean white blood cell count for the population of about 325 million people in the United States using a randomly selected sample of only 25 people
The x2 statistic from my study was close to zero, so I rejected the null hypothesis.
An economist wants to compare the mean annual income of government employees in four different states. Analysis of variance cannot be used because there are more than three populations.
A significance level of 0.05 indicates that the probability of making a type I error is 0.05.Does It Make Sense? For Exercise, determine whether the statement makes sense or does not make sense. Explain clearly. Not all of these statements have definitive answers, so your explanation is more
What are the two possible conclusions that can be reached about the claim being tested?In Exercises, assume that we want to use a 0.05 significance level to test the claim that the mean IQ score of Google employees is greater than 115.
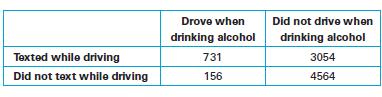
Consider the following data from a study of high school students at least 16 years of age. Assume that we want to use a 0.05 significance level to test the claim of independence between texting while driving and driving when drinking alcohol.a. What is it about the given table that makes it a
Despite the scientific consensus on the safety of GM foods, much of the public remains unconvinced. Some nations have even banned the use of these foods. Why do you think there is so much controversy? Research the controversy, and decide whether you think any of it is warranted. Defend your
Samples of airline departure times are obtained and compared to the scheduled departure times. Five major airlines are compared and their mean delay times are recorded. Identify the null and alternative hypotheses for applying an analysis of variance.
In a 3M Privacy Filters poll, 806 adults were asked to identify their favorite seat when they fly, and 61% of them chose a window seat. Test the claim that the majority of adults prefer window seats when they fly.
What is a P-value for a hypothesis?
What is the meaning of small and large values of the test statistic F in ANOVA, and how do we use the value of F to decide whether to reject the null hypothesis at the 0.05 significance level?
Briefly summarize the procedure for conducting a hypothesis test for a population mean when using the t distribution. What is the difference between the procedures using the normal and t distributions?
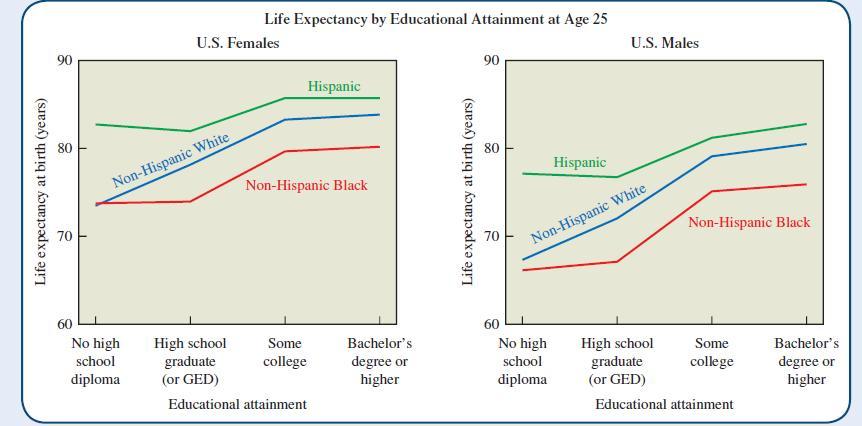
Recent studies have found that life expectancy has continued its long-term rise across all the groups represented in Figure §9.10, except one: Over the past couple decades, there has been a decrease in life expectancy for whites (both male and female) with relatively low education. Form one or
Is a test of the claim that p ≠ 0.75 left-tailed, right-tailed, or two-tailed?
What are the two possible outcomes of a hypothesis test, and what do they mean? Can such a test have an outcome of accepting the null hypothesis?
Describe and distinguish between the variance between samples and the variance within samples in ANOVA. How is the test statistic F related to the variance between samples and the variance within samples?
Explain what we mean by the observed frequency and expected frequency for each cell in a two-way table. What notation is used for the expected and observed frequencies? How do we calculate expected frequencies?
Figure 9.10 shows other interesting differences in life expectancy besides those due to education. Identify these differences, hypothesize about why they occur, and discuss how you would test your hypotheses. Also research and discuss efforts to help narrow the life expectancy gaps between men and
Briefly summarize the procedure for constructing a 95% confidence interval around a sample mean when using the t distribution. What is the difference between the procedures using the normal and t distributions?
A random sample of 40 quarters minted after 1964 are weighed. The mean weight is 5.639 grams and the standard deviation is 0.062 gram. Assume that we want to use a 0.05 significance level to test the claim that the population of quarters has a mean weight of 5.670 grams, which is the manufacturing
What do n, p, pn, and P-value represent?
Find a news article or report in which a population means is estimated from a sample. The article should include a margin of error and/or a confidence interval. Discuss the methods used in the study and how the conclusions were reached.
Transparency International uses surveys to determine a Bribe Payer’s Index and Corruption Perception Index that measure the degree of corruption in many countries worldwide. Visit the Transparency International website and review the extensive documentation describing the methods used by this
All of the major television networks conduct regular polls on a variety of issues. Visit the website of at least one major network and gather the results of a particular poll that involves the estimation of a population mean. Be sure to include all information that is given about the sample size,
Three leading public polling organizations are the Gallup Organization, Harris Poll, and Yankelovich Partners. Visit their websites. Describe the history of each organization and the polling services it provides. Which organization has the best description on its website of its polling methods?
Assume that you want to estimate the mean age of cars driven by students at your college. A previous study shows that the standard deviation of those ages is approximately 3.7 years. How many car ages must you randomly select in order to be 95% confident that your sample mean is within 1 year of
A random sample of n = 31 American households is asked how many TV sets there are in the household. The responses are as follows: 1 0 2 3 2 3 4 2 1 1 2
Find a news or research report in which a sample proportion is cited. Discuss how it is used to estimate a population proportion.
One of the authors of this text counted the numbers of chocolate chips in 20 Chips Ahoy regular chocolate chip cookies, and the results are listed below. 22 22 26 24 23 27 25 20
Find a news or research report in which a sample mean is cited. Discuss how it is used to estimate a population mean.
Consider the data set on page 275 in this section that consists of 400 yes and no responses to a survey question. Discuss methods for selecting a random sample from this population. Work with a group of friends (or your whole class), and have each person select a random sample of n = 10 responses
Consider the data set of numbers of hours students spent per week searching the Internet, listed in this section on page 272. Discuss methods for selecting a random sample from this population. Work with a group of friends (or your whole class), and have each person select a random sample of n = 10
Based on a sample of 62 households, the mean weight of discarded plastic is 1.91 pounds and the standard deviation is 1.07 pounds. Use a single value to estimate the mean weight of discarded plastic for all households. Also, find the 95% confidence interval.
When 650 adults are randomly selected, find the probability that 84 or more of them are lefthanded. Does the result of 84 lefthanded adults appear to be unusually high?Distributions of Sample Proportions. In Exercise, assume that 10% of adults are left-handed.
If 820 adults are randomly selected, find the probability that 92 or more of them are lefthanded. Does the result of 92 lefthanded adults appear to be unusually high? Distributions of Sample Proportions. In Exercise, assume that 10% of adults are left-handed.
A sample of 100 babies born at Strong Memorial Hospital has a mean weight of 3072 grams and a standard deviation of 748 grams. Use a single value to estimate the mean weight of a newborn baby. Also, find the 95% confidence interval.
If 250 adults are randomly selected, find the probability that 15 or fewer of them are lefthanded. Does the result of 15 lefthanded adults appear to be unusually low?Distributions of Sample Proportions. In Exercise, assume that 10% of adults are left-handed.
If 500 adults are randomly selected, find the probability that 45 or fewer of them are lefthanded. Does the result of 45 lefthanded adults appear to be unusually low?Distributions of Sample Proportions. In Exercise, assume that 10% of adults are left-handed.
Margin of error, E = 2.6 minutes; sample standard deviation, s = 45.4 minutesSample Sizes. In Exercise, assume that you want to construct a 95% confidence interval estimate of a population mean. Find an estimate of the minimum sample size needed to obtain the specified margin of error for the 95%
The College of Portland has a total enrollment of N = 2444 students and 269 of them are lefthanded. You conduct a survey of n = 50 students and find that 8 of them are lefthanded.a. What is the population proportion, p, of lefthanded students?b. What is the sample proportion, pn, of left-handed
Margin of error, E = 1.5 meters; sample standard deviation, s = 30.6 metersSample Sizes. In Exercise, assume that you want to construct a 95% confidence interval estimate of a population mean. Find an estimate of the minimum sample size needed to obtain the specified margin of error for the 95%
Margin of error, E = 8.5 grams; sample standard deviation, s = 68.5 gramsSample Sizes. In Exercise, assume that you want to construct a 95% confidence interval estimate of a population mean. Find an estimate of the minimum sample size needed to obtain the specified margin of error for the 95%
A random sample of 100 newborn girls is obtained and they have a mean birth weight of 2966 grams. What is the probability of randomly selecting another 100 newborn girls and getting a mean birth weight that is 2966 grams or lower? Does it seem like a sample mean of 2966 grams is
A random sample of 36 newborn girls is obtained and they have a mean birth weight of 3272 grams. What is the probability of randomly selecting another 36 newborn girls and getting a mean birth weight that is 3272 grams or more? Does it seem like a sample mean of 3272 grams is unusual?
A random sample of 64 newborn girls is obtained and they have a mean birth weight of 3390 grams. What is the probability of randomly selecting another 64 newborn girls and getting a mean birth weight that is 3390 grams or more? Does it seem like a sample mean of 3390 grams is unusual?
Margins of Error and Confidence Intervals. For Exercise, assume that population means are to be estimated from the samples described. In each case, use the sample results to approximate the margin of error and 95% confidence interval.n = 2250, p = 0.853
Margins of Error and Confidence Intervals. For Exercise, assume that population means are to be estimated from the samples described. In each case, use the sample results to approximate the margin of error and 95% confidence interval.n = 36, x = 60.9 seconds, s = 4.3 seconds
Sample size, n = 49; sample mean, x = 12.8 kilograms (kg); sample standard deviation, s = 2.5 kgMargins of Error and Confidence Intervals. For Exercise, assume that population means are to be estimated from the samples described. In each case, use the sample results to approximate the margin of
Based on our sample, the 95% confidence interval for the mean amount of television watched by adult Americans is 2.5 to 2.7 hours per day. Therefore, there is 95% chance that the actual mean for the population is 2.6 hours.Does It Make Sense? For Exercises, determine whether the statement makes
The ages (in years) of the four U.S. presidents when they were assassinated in the office are 56(Lincoln), 49 (Garfield), 58 (McKinley), and 46 (Kennedy). Consider these four ages to be a population.a. Assuming that two of the ages are randomly selected to form samples of size n = 2 with
Margin of error, E = 20.3 cm; sample standard deviation, s = 321.0 cmSample Sizes. In Exercise, assume that you want to construct a 95% confidence interval estimate of a population mean. Find an estimate of the minimum sample size needed to obtain the specified margin of error for the 95%
What is a hypothesis in statistics? What do we mean by a hypothesis test in statistics?
Identify the null and alternative hypotheses for testing the claim that the mean annual income of college graduates is greater than $35,000.
Showing 100 - 200
of 1156
1
2
3
4
5
6
7
8
9
10
11
12
Step by Step Answers