New Semester
Started
Get
50% OFF
Study Help!
--h --m --s
Claim Now
Question Answers
Textbooks
Find textbooks, questions and answers
Oops, something went wrong!
Change your search query and then try again
S
Books
FREE
Study Help
Expert Questions
Accounting
General Management
Mathematics
Finance
Organizational Behaviour
Law
Physics
Operating System
Management Leadership
Sociology
Programming
Marketing
Database
Computer Network
Economics
Textbooks Solutions
Accounting
Managerial Accounting
Management Leadership
Cost Accounting
Statistics
Business Law
Corporate Finance
Finance
Economics
Auditing
Tutors
Online Tutors
Find a Tutor
Hire a Tutor
Become a Tutor
AI Tutor
AI Study Planner
NEW
Sell Books
Search
Search
Sign In
Register
study help
sciences
statistical reasoning for everyday life
Statistical Reasoning For Everyday Life 5th Edition Jeff Bennett, William Briggs, Mario Triola - Solutions
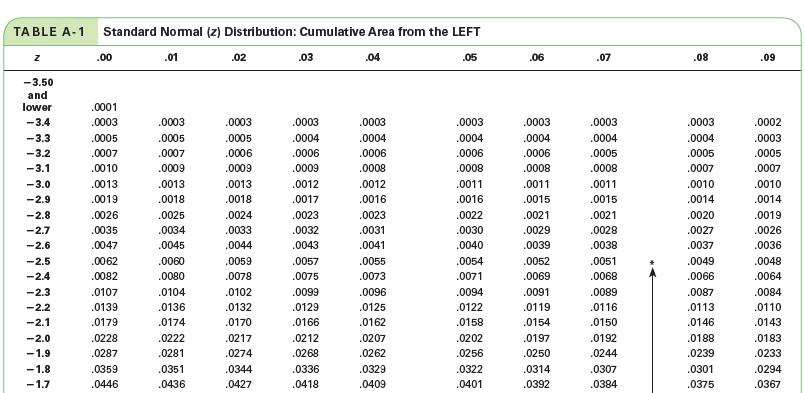
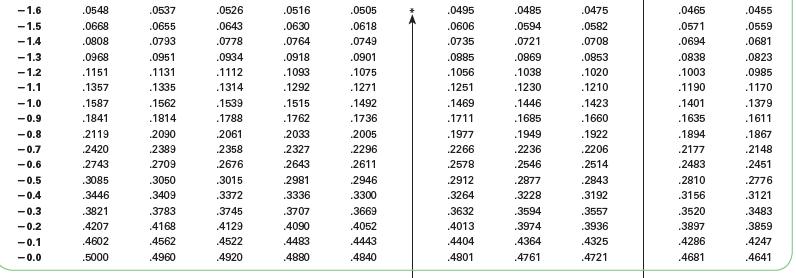
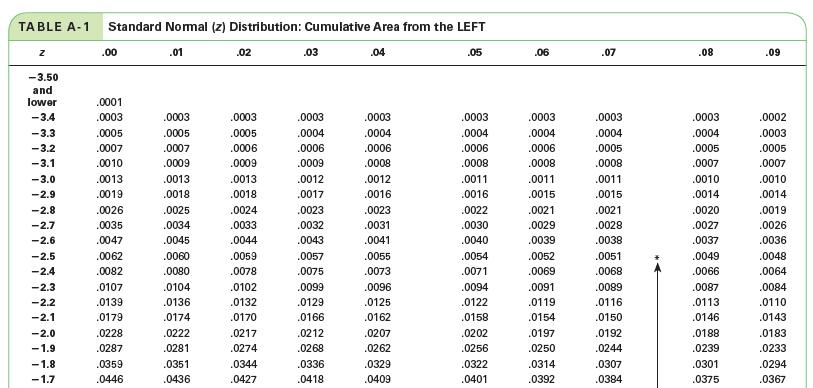
z = -0.9 for H0: m = 612 feet and Ha: μ < 612 feetUsing P-Values to Reject or Not Reject. In Exercise, use Table A-1 to find the P-value that corresponds to the given standard score, and determine whether to reject the null hypothesis at the 0.05 significance level. Is the alternative
z = 2.8 for H0: m = 18.9 feet and Ha: 7 > 18.9 feetUsing P-Values to Reject or Not Reject. In Exercise, use Table A-1 to find the P-value that corresponds to the given standard score, and determine whether to reject the null hypothesis at the 0.05 significance level. Is the alternative
Journals. Many professional journals, such as the Journal of the American Medical Association, contain articles that include information about formal tests of hypotheses. Find such an article and identify the null hypothesis and alternative hypothesis. In simple terms, state the objective of the
Choose a category of famous people, such as politicians, artists, writers, or scientists. Select a sample of five people from that category who have recently died, and find the mean and standard deviation of their life spans. Test the claim that the group has a mean life span that is different from
The t distribution was originally developed by William Sealey Gosset. Use the Internet to search for “William Sealey Gosset” or “William S. Gosset.” Write a paragraph presenting important information about Gosset and his accomplishments
Find a news article or research report that describes (perhaps not explicitly) a hypothesis test for a population mean or proportion. Write a summary of the method used and attach the article to your analysis.
Find a recent news article about a statistical study that involved a sample for which the t distribution could have been used to construct a confidence interval or test a claim about a population means. Explain why the conditions for using the t distribution are met.
Assume that you are testing the alternative hypothesis Ha : m > 54.2. If the sample mean has a standard score of z = -1.0, what do you conclude? Why is it not necessary to actually conduct a formal hypothesis test?
Assume that you are testing the alternative hypothesis Ha: m < 4.43. If the sample mean has a standard score of z = 0.5, what do you conclude? Why is it not necessary to actually conduct a formal hypothesis test?
A simple random sample of 50 adults is obtained, and each person’s red blood cell count (in cells per microliter) is measured. The sample mean is 5.23 cells/μL. The population standard deviation for red blood cell counts is 0.54 cell/μL. Test the claim that the sample is from a population
A simple random sample of 50 adults is obtained, and each person’s red blood cell count (in cells per microliter) is measured. The sample mean is 5.23 cells/μL. The population standard deviation for red blood cell counts is 0.54 cell/μL. Test the claim that the sample is from a population with
H0: The mean length of a bolt in the suspension system of new Audi cars is 3.456 centimeters.Ha: The mean length of a bolt in the suspension system of new Audi cars is not equal to 3.456 centimeters.Type I and Type II Errors. In Exercise, a null and alternative hypothesis are given. Without using
Choose several variables that are relatively easy to measure in a class or other sample of students. The variables should involve a quantity that can be averaged (for example, height, weight, family size, blood pressure, heart rate, reaction time). Use the Internet or other references to determine
The Statistical Abstract of the United States and the Current Population Survey provide an extensive supply of social, economic, and vital statistics at the county, state, and local levels. Use their websites to compare state data to national data in the following way.a. Choose a variable of
Using a search engine such as Google, search for “hypothesis testing” and “applet.” Find an applet and run it. Describe how the applet works and what it illustrates.
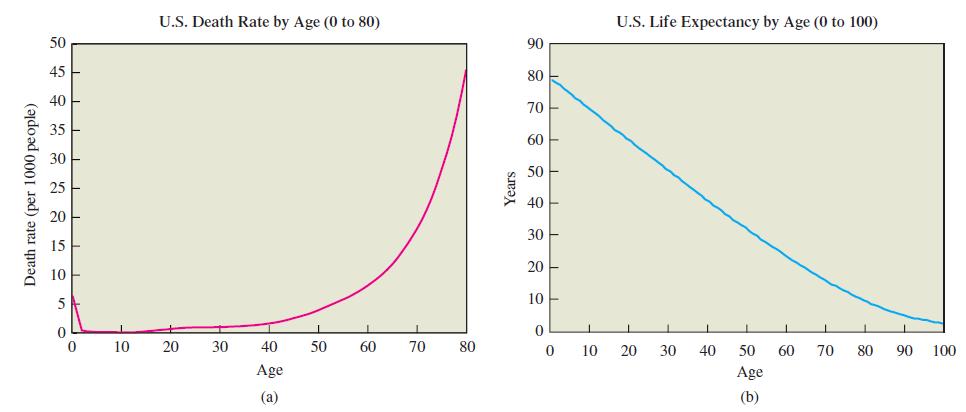
Based on current life expectancy data, to what age is the average 40-year-old expected to live?Mortality Rates. For Exercise, use the graphs in Figure 6.13 to answer the following questions.Figure 6.13 Death rate (per 1000 people) 50 45 40 35 30 25 20 15 10 5 0 0 10 U.S. Death Rate by Age (0 to
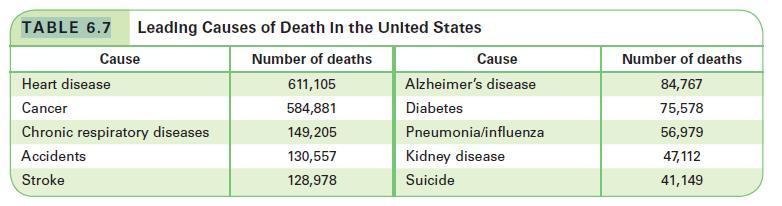
Estimate the death rate for 60-year-olds. If the population of people this age is about 14 million, how many people of this age can be expected to die in a year?Mortality Rates. For Exercise, use the graphs in Figure 6.13 to answer the following questions.Figure 6.13 TABLE 6.7 Leading Causes of
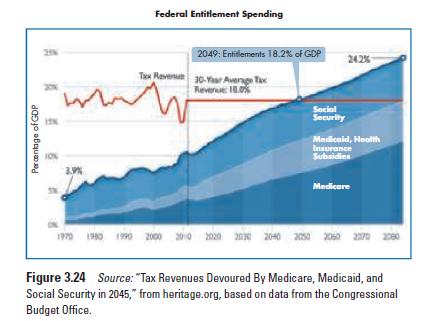
The stack plot in Figure 3.24 on the next page shows Congressional Budget Office data for actual spending (through 2011) and projected spending on federal entitlement programs through 2085 as percentages of the gross domestic product (GDP). Interpret the graph and summarize its message. Federal
Describe a situation in which you personally have made use of the law of large numbers, either correctly or incorrectly. Why did you use the law of large numbers in this situation? Was it helpful?
Visit a website that has vital statistics (for example, that of the U.S. Census Bureau or the National Center for Health Statistics). Choose one of the following questions:• Are there significant differences in numbers of births among months?• Are there significant differences in numbers of
As part of a clinical trial, the drug tofacitinib citrate was administered in 5-mg doses to 1336 subjects as a rheumatoid arthritis treatment. Here are the numbers of adverse reactions: 57 subjects had headaches, 21 had hypertension, 60 had upper respiratory tract infections, 51 had
As part of a clinical trial, the drug tofacitinib citrate was administered in 5-mg doses to 1336 subjects as a rheumatoid arthritis treatment. Here are the numbers of adverse reactions: 57 subjects had headaches, 21 had hypertension, 60 had upper respiratory tract infections, 51 had
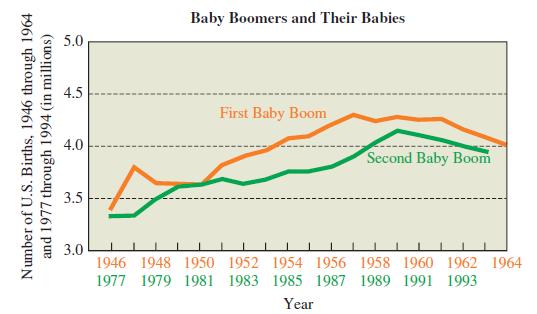
The graph in Figure 3.42 shows simultaneously the number of births in the United StatesFigure 3.42 Number of U.S. Births, 1946 through 1964 and 1977 through 1994 (in millions) Baby Boomers and Their Babies First Baby Boom Second Baby Boom D 3.5 3.0 1946 1948 1950 1952 1954 1956 1958 1960 1962
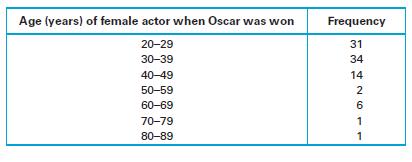
Weighted Mean. In Exercises, find the mean of the data summarized in the frequency table by using the middle of each bin and the frequency for each bin. Also, compare the computed means to these the actual means obtained using the original list of data values: (Exercise 32) ; (Exercise 33) 44.1
Notice that scores for males have been consistently higher than scores for females. Why do you think this is the case?Do you think that changes in the education system could eliminate this gap? Defend your opinions.
A test of depth perception is designed so that scores are normally distributed with a mean of 50 and a standard deviation of 10.Use the 68 95 99.7 rule to find the following values.
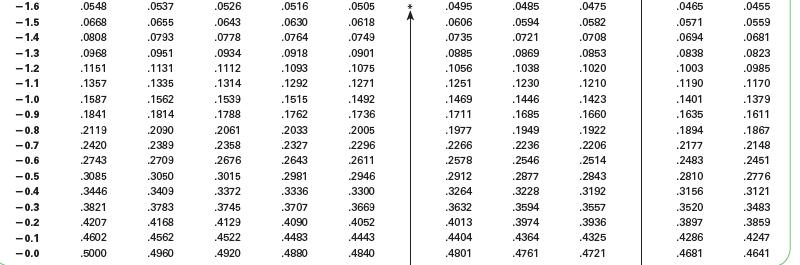
Percentage of scores greater than 100IQ Scores. For Exercises, sketch the normal distribution of IQ scores, which has a mean of 100 and a standard deviation of 15, then shade the described area. Use Table A-1 to find the indicated quantities.Table A-1 TABLE A-1 Standard Normal (2) Distribution:
In a study of facial behavior, people in a control group are timed as to the duration of eye contact they make in a 5-minute period. Their times are normally distributed with a mean of 184.0 seconds and a standard deviation of 55.0 seconds (based on data from “Ethological Study of Facial Behavior
Percentage of scores less than 115IQ Scores. For Exercises, sketch the normal distribution of IQ scores, which has a mean of 100 and a standard deviation of 15, then shade the described area. Use Table A-1 to find the indicated quantities.Table A-1 TABLE A-1 Standard Normal (z) Distribution:
The winning numbers drawn in California’s Daily Four lottery game, in which four digits between 0 and 9 are drawn and digits can be repeatedNormal Distributions. For each of the data sets in Exercises, state whether you would expect it to be normally distributed. Explain your reasoning.
Adult males have sitting knee heights that are normally distributed with a mean of 21.4 inches and a standard deviation of 1.2 inches. Use the 6 895 99.7 rule to find the indicated quantity.a. Find the percentage of adult males with sitting knee heights between 19.0 and
The pulse rates of randomly selected adult femalesNormal Distributions. For each of the data sets in Exercises, state whether you would expect it to be normally distributed. Explain your reasoning.
Percentage of scores less than 70 IQ Scores. For Exercises, sketch the normal distribution of IQ scores, which has a mean of 100 and a standard deviation of 15, then shade the described area. Use Table A-1 to find the indicated quantities.Table A-1 TABLE A-1 Standard Normal (z) Distribution:
What percentage of individual adult females have weights greater than 79 kg? If samples of 25 adult females are randomly selected and the mean weight is computed for each sample, what percentage of the sample means are greater than 79 kg?
The measured voltage amounts from newly manufactured AAA batteries made by DuracellNormal Distributions. For each of the data sets in Exercises, state whether you would expect it to be normally distributed. Explain your reasoning.
The measured systolic blood pressure of randomly selected adult malesNormal Distributions. For each of the data sets in Exercises, state whether you would expect it to be normally distributed. Explain your reasoning.
Percentage of scores greater than 70 IQ Scores. For Exercises, sketch the normal distribution of IQ scores, which has a mean of 100 and a standard deviation of 15, then shade the described area. Use Table A-1 to find the indicated quantities.Table A-1 TABLE A-1 Standard Normal (z) Distribution:
Percentage of scores less than 130IQ Scores. For Exercises, sketch the normal distribution of IQ scores, which has a mean of 100 and a standard deviation of 15, then shade the described area. Use Table A-1 to find the indicated quantities.Table A-1 TABLE A-1 Standard Normal (z) Distribution:
The outcomes of many tosses of a single die with 12 sides numbered 1 through 12Normal Distributions. For each of the data sets in Exercises, state whether you would expect it to be normally distributed. Explain your reasoning.
Percentage of scores greater than 88IQ Scores. For Exercises, sketch the normal distribution of IQ scores, which has a mean of 100 and a standard deviation of 15, then shade the described area. Use Table A-1 to find the indicated quantities.Table A-1 TABLE A-1 Standard Normal (z) Distribution:
The departure delay times (in minutes past the scheduled time) of Amtrak trains leaving New York City for BostonNormal Distributions. For each of the data sets in Exercises, state whether you would expect it to be normally distributed. Explain your reasoning.
The amounts of income tax paid by 5000 randomly selected U.S. adultsNormal Distributions. For each of the data sets in Exercises, state whether you would expect it to be normally distributed. Explain your reasoning.
Percentage of scores greater than 145IQ Scores. For Exercises, sketch the normal distribution of IQ scores, which has a mean of 100 and a standard deviation of 15, then shade the described area. Use Table A-1 to find the indicated quantities.Table A-1 TABLE A-1 Standard Normal (z) Distribution:
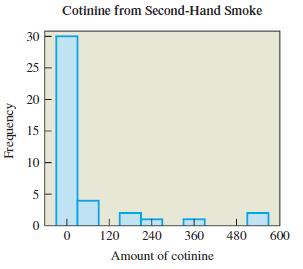
The amount of nicotine absorbed by the human body can be determined by measuring the amount of cotinine (ng/ml) in the blood. Figure 5.9 shows a histogram for the amounts of cotinine measured in 40 adults who do not smoke but are exposed to second-hand smoke. Is this distribution close to normal?
Percentage of scores between 85 and 115IQ Scores. For Exercises, sketch the normal distribution of IQ scores, which has a mean of 100 and a standard deviation of 15, then shade the described area. Use Table A-1 to find the indicated quantities.Table A-1 TABLE A-1 Standard Normal (z) Distribution:
Percentage of scores between 70 and 130IQ Scores. For Exercises, sketch the normal distribution of IQ scores, which has a mean of 100 and a standard deviation of 15, then shade the described area. Use Table A-1 to find the indicated quantities.Table A-1 TABLE A-1 Standard Normal (z) Distribution:
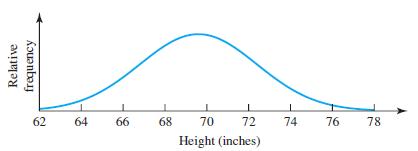
Consider the graph of the normal distribution in Figure 5.12, which gives relative frequencies in the distribution of men’s heights. The distribution has a mean of 69.6 inches and a standard deviation of 2.8 inches.a. What is the total area under the curve?b. Estimate (using area) the relative
Figure 5.10 on the next page shows a histogram for the departure delay times (in minutes) of 152 American Airlines flights from Los Angeles to San Francisco. Is this distribution close to normal? Should this variable have a normal distribution? Why or why not?
Percentage of scores between 70 and 115IQ Scores. For Exercises, sketch the normal distribution of IQ scores, which has a mean of 100 and a standard deviation of 15, then shade the described area. Use Table A-1 to find the indicated quantities.Table A-1 TABLE A-1 Standard Normal (z) Distribution:
Percentage of scores between 88 and 127IQ Scores. For Exercises, sketch the normal distribution of IQ scores, which has a mean of 100 and a standard deviation of 15, then shade the described area. Use Table A-1 to find the indicated quantities.Table A-1 TABLE A-1 Standard Normal (z) Distribution:
The percentage of heights greater than 174 cmHeights of Males. For Exercises, sketch the normal distribution of heights of adult males, which has a mean of 174 cm and a standard deviation of 7 cm, then shade the described area. Use Table A-1 to find the indicated quantities.Table A-1 TABLE A-1
Doing an Internet search on the “central limit theorem” will uncover many sites devoted to this subject. Find a site that has animated demonstrations of the Central Limit Theorem. Describe in your own words what you observe and how it illustrates the Central Limit Theorem.
The percentage of heights less than 181 cmHeights of Males. For Exercises, sketch the normal distribution of heights of adult males, which has a mean of 174 cm and a standard deviation of 7 cm, then shade the described area. Use Table A-1 to find the indicated quantities.Table A-1 TABLE A-1
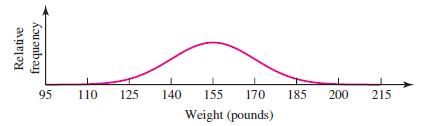
Consider the graph of the normal distribution in Figure 5.15, which gives the relative frequencies in a distribution of body weights for a sample of male students.a. What is the mean of the distribution?b. Estimate (using area) the percentage of students whose weight is less than 140 pounds.c.
Do an Internet search on “central limit theorem” or “quincunx” and find a site that has an animated demonstration of the quincunx (or Galton’s board). Describe the quincunx, and explain how it illustrates the Central Limit Theorem.
The percentage of heights greater than 181 cmHeights of Males. For Exercises, sketch the normal distribution of heights of adult males, which has a mean of 174 cm and a standard deviation of 7 cm, then shade the described area. Use Table A-1 to find the indicated quantities.Table A-1 TABLE A-1
The percentage of heights greater than 167 cmHeights of Males. For Exercises, sketch the normal distribution of heights of adult males, which has a mean of 174 cm and a standard deviation of 7 cm, then shade the described area. Use Table A-1 to find the indicated quantities.Table A-1 TABLE A-1
Demonstrate the Central Limit Theorem using dice, as discussed in this section. Give each person in your class as many dice as possible. Begin by rolling one die and making a histogram of the outcomes. Then let every person roll two dice and make a histogram of the mean for each roll. Increase the
The percentage of heights less than 160 cm Heights of Males. For Exercises, sketch the normal distribution of heights of adult males, which has a mean of 174 cm and a standard deviation of 7 cm, then shade the described area. Use Table A-1 to find the indicated quantities.Table A-1 TABLE A-1
The percentage of heights less than 200 cmHeights of Males. For Exercises, sketch the normal distribution of heights of adult males, which has a mean of 174 cm and a standard deviation of 7 cm, then shade the described area. Use Table A-1 to find the indicated quantities.Table A-1 TABLE A-1
Collect data to support or refute the claim that movies have gotten shorter over the decades. Specifically, make a histogram of movie lengths for each decade from the 1940s through the present, find the mean movie length for each sample, and comment on whether these distributions arenormal. Discuss
Although news reports rarely discuss the shapes of distributions, variables mentioned in news reports must have some distribution. Find two variables in recent news reports that you suspect have nearly normal distributions.Explain your reasoning.
The percentage of heights less than 146 cmHeights of Males. For Exercises, sketch the normal distribution of heights of adult males, which has a mean of 174 cm and a standard deviation of 7 cm, then shade the described area. Use Table A-1 to find the indicated quantities.Table A-1 TABLE A-1
Find two variables in news reports that you suspect do not have nearly normal distributions. Explain your reasoning.
The percentage of heights greater than 180 cmHeights of Males. For Exercises, sketch the normal distribution of heights of adult males, which has a mean of 174 cm and a standard deviation of 7 cm, then shade the described area. Use Table A-1 to find the indicated quantities.Table A-1 TABLE A-1
The percentage of heights between 167 cm and 181 cmHeights of Males. For Exercises, sketch the normal distribution of heights of adult males, which has a mean of 174 cm and a standard deviation of 7 cm, then shade the described area. Use Table A-1 to find the indicated quantities.Table A-1 TABLE
The percentage of heights between 160 cm and 188 cmHeights of Males. For Exercises, sketch the normal distribution of heights of adult males, which has a mean of 174 cm and a standard deviation of 7 cm, then shade the described area. Use Table A-1 to find the indicated quantities.Table A-1 TABLE
The percentage of heights between 180 cm and 200 cmHeights of Males. For Exercises, sketch the normal distribution of heights of adult males, which has a mean of 174 cm and a standard deviation of 7 cm, then shade the described area. Use Table A-1 to find the indicated quantities.Table A-1 TABLE
The percentage of heights between 150 cm and 170 cmTable A-1 TABLE A-1 Standard Normal (z) Distribution: Cumulative Area from the
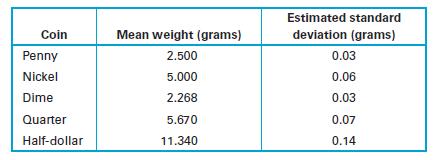
Consider the following table, showing the official mean weight and estimated standard deviation for five U.S. coins. Suppose a vending machine is designed to reject all coins with weights more than 2 standard deviations above or below the mean. For each coin, find the range of weights that is
Assume that the scores on the Graduate Record Exam (GRE) are normally distributed with a mean of 497 and a standard deviation of 115.a. A graduate school requires a GRE score of 650 for admission. To what percentile does this correspond?b. A graduate school requires a GRE score in the 95th
Assume that body temperature of healthy adults are normally distributed with a mean of 98.20°F and a standard deviation of 0.62°F.a. What percentage of adults have body temperatures greater than 99.99°F?b. What percentage of adults have body temperatures less than 98.60°F?c. If hospital
Heights of adult American males are normally distributed with a mean of 69.0 inches and a standard deviation of 2.8 inches. The U.S. Marine Corps requires that males have heights between 64 inches and 78 inches. What percentage of males are eligible for the Marines based on height?
Do An Internet search using the keywords “normal distribution,” and find an animated demonstration of the normal distribution.Describe how the demonstration works and the useful features that you observed.
Ask survey subjects to estimate the length of 1 minute without looking at a watch or clock. Each subject should say “go” at the beginning of the minute and then “stop” when he or she thinks that 1 minute has passed. Use a watch to record the actual times. Construct a graph of the estimates.
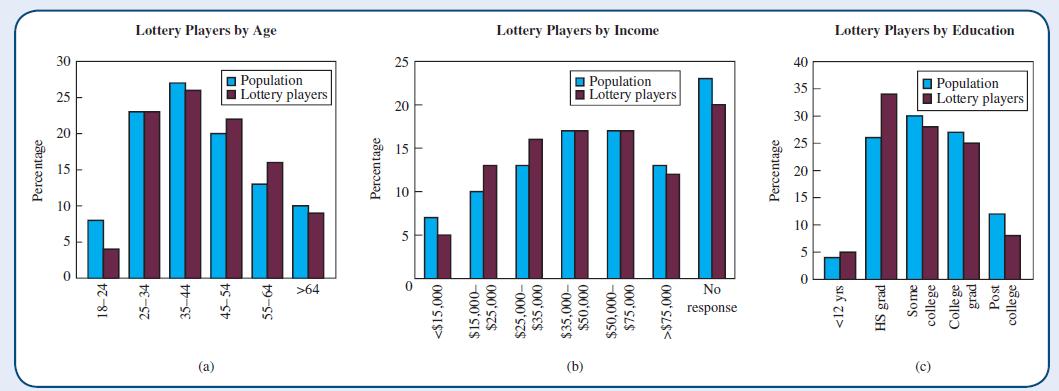
Study Figure 6.18. Do lottery players appear to be a typical cross-section of American society based on age? Based on income? Based on level of education? Explain. How does the “No response” category affect these conclusions? Percentage 30 25 20 10 Lottery Players by Age Population I Lottery
A Las Vegas handicapper can correctly predict the winner in a professional basketball game 60% of the time. What is the probability that she is wrong in her next prediction?
What is travel risk? Give an example. Can you easily compare different risk rates?
Suppose you toss a coin 100 times. Should you expect to get exactly 50 heads? Why or why not?
Distinguish between an outcome and an event in probability. Give an example in which the same event can occur via two or more outcomes.
What is the law of large numbers? Can it be applied to a single observation or experiment? Explain.
For the handicapper in Exercise 1, find the probability that she is correct in each of her next two predictions.Exercise 1A Las Vegas handicapper can correctly predict the winner in a professional basketball game 60% of the time. What is the probability that she is wrong in her next prediction?
What are vital statistics? What does it mean to say that the current U.S. birth rate is 13.2 per 1000 people?
As noted, lottery spending is about $300 per adult in states that have lotteries. However, surveys indicate that fewer than half of all Americans play the lottery with any regularity. Given that fact, how much does the average lottery player spend each year? Does this result surprise you, or
What do we mean when we say that a result is statistically significant?
A geneticist is working with 3 green peas and 1 yellow pea. Let G denote the event of randomly selecting one of these peas and getting one that is green. Let Y denote the event of randomly selecting one of the remaining 3 peas and getting one that is yellow. Are events G and Y independent or
What does it mean when we write P(A)? What is the possible range of values for P(A), and why?
In terms of the law of large numbers, explain why you should not be surprised to see 6 heads in 10 tosses of a fair coin, but you should be surprised to see 600 heads in 1000 tosses of the same coin.
What is an expected value, and how is it computed? Should we always expect to realize the expected value? Why or why not?
Estimate the probability that a randomly selected prime-time television show will be interrupted by a news bulletin.
Does your state have a lottery? If so, look up the various games available and the probabilities of winning different prizes. If not, look up the multi-state Powerball game. Does your state have a lottery? If so, look up the various games available and the probabilities of winning different
Does the idea of statistical significance apply to samples or populations? Briefly explain why.
A pollster randomly selects an adult for a survey. Let M denote the event of getting a male, and let R denote the event of getting a Republican. Are events M and R overlapping?
Briefly describe the theoretical, relative frequency, and subjective methods for finding probabilities. Give an example of each
What is the gambler’s fallacy? Give an example
In a clinical trial of the effectiveness of a gender selection method, it is found that there is a 0.005 probability that the results could have occurred by chance. Does the method appear to be effective?
What does it mean to say that a particular result is statistically significant at the 0.05 level or at the 0.01level? Is a result that is statistically significant at the 0.05 level automatically also significant at the 0.01 level? --What about the reverse?
Let A be the event of rolling an odd number on a six-sided dice. Then event not A will be rolling an even number. Are events A and not A overlapping? Why or why not?Does It Make Sense? For Exercises, determine whether the statement makes sense (or is clearly true) or does not make sense (or is
For a typical lottery, the expected value of a ticket is less than the cost of a ticketDoes It Make Sense? For Exercises, determine whether the statement makes sense (or is clearly true) or does not make sense (or is clearly false). Explain clearly; not all of these have definitive answers, so your
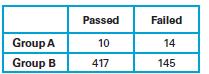
If P(A) = 0.65, what is the value of P(not A)?In Exercise, use the following results. The legal case United States v. City of Chicago concerned a claim of discrimination in a qualifying exam for the position of fire captain. In the table below, Group A is a minority group and Group B is a majority
Showing 500 - 600
of 1156
1
2
3
4
5
6
7
8
9
10
11
12
Step by Step Answers