New Semester
Started
Get
50% OFF
Study Help!
--h --m --s
Claim Now
Question Answers
Textbooks
Find textbooks, questions and answers
Oops, something went wrong!
Change your search query and then try again
S
Books
FREE
Study Help
Expert Questions
Accounting
General Management
Mathematics
Finance
Organizational Behaviour
Law
Physics
Operating System
Management Leadership
Sociology
Programming
Marketing
Database
Computer Network
Economics
Textbooks Solutions
Accounting
Managerial Accounting
Management Leadership
Cost Accounting
Statistics
Business Law
Corporate Finance
Finance
Economics
Auditing
Tutors
Online Tutors
Find a Tutor
Hire a Tutor
Become a Tutor
AI Tutor
AI Study Planner
NEW
Sell Books
Search
Search
Sign In
Register
study help
sciences
statistical reasoning for everyday life
Statistical Reasoning For Everyday Life 5th Edition Jeff Bennett, William Briggs, Mario Triola - Solutions
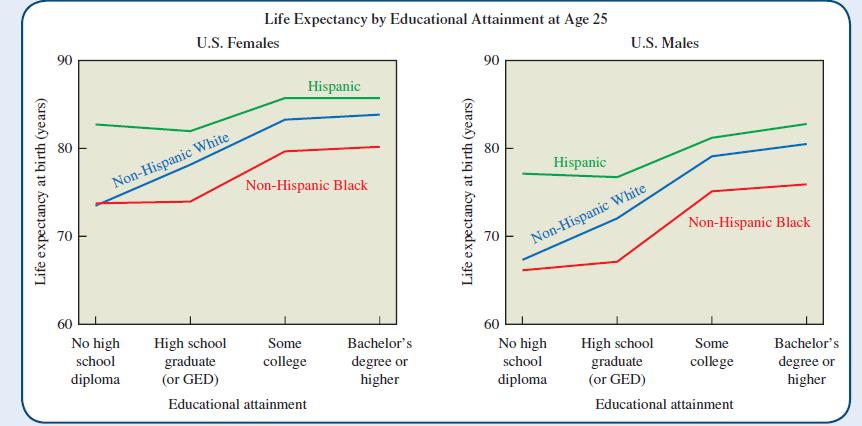
Figure 9.10 presents a wealth of data. Interpret it carefully. How does it support the hypothesis that more education leads to a longer life? Explain.Figure 9.10 Life expectancy at birth (years) 8 60 Life Expectancy by Educational Attainment at Age 25 90 Hispanic Non-Hispanic
What is a two-way table? What are the entries in its cells?
What does ANOVA stand for? What is the objective in using ANOVA? What form does the null hypothesis take?
When testing a claim about a population mean, what is a standard score for the sample mean?
When testing a claim about a population proportion, what is a standard score, z, for the sample proportion, p?
Identify the null and alternate hypotheses for testing the claim that the proportion of college graduates who got a job within one month of graduation is greater than 0.4.
Why do you think education contributes to a longer life? For example, do you think the mere fact of staying in school makes people live longer, or is it the extra learning associated with more years of schooling that makes the difference, or some other factors? How would you test your
How do you determine the number of degrees of freedom when using a t distribution? Once you know this number, how do you find the critical value of t that you will need for building a confidence interval or conducting a statistical test?
Why is the method discussed in this section referred to as one-way analysis of variance? That is, what is “one-way” about the method?
What is a null hypothesis and an alternative hypothesis, and what notation do we use to denote them? How do left-tailed, right-tailed, and two-tailed hypothesis tests differ?
What do we mean by critical values for significance in a hypothesis test for the population mean? How do we use critical values for making decisions about hypothesis tests?
What do we mean by critical values for significance in a hypothesis test for the population proportion? How does this compare to the critical values for statistical significance for a population mean? How do we use this for making decisions about the hypothesis test?
Identify the null and alternative hypotheses for testing the claim that the proportion of convicted felons who serve time in prison is equal to 0.6.
Consider the data set of numbers of hours students spent per week searching the Internet, listed in this section on page 272. Discuss methods for selecting a random sample from this population. Work with a group of friends (or your whole class), and have each person select a random sample of n = 10
Find a news or research report in which a sample mean is cited. Discuss how it is used to estimate a population mean.
Find a news or research report in which a sample proportion is cited. Discuss how it is used to estimate a population proportion.
Distinguish between a distribution of sample means and a distribution of sample proportions.
If you seek to construct a 95% confidence interval to estimate a population mean, how do you calculate the margin of error that you will use? How do you then construct the 95% confidence interval?
Do you think that records of burials and baptisms would have given accurate counts of actual births and deaths? Why or why not?
Once you have constructed the 95% confidence interval around your sample mean, how do you interpret its possible relationship to the population mean?
What is a probability distribution? Briefly describe a format that is used to display a probability distribution.
If 820 adults are randomly selected, find the probability that 92 or more of them are lefthanded.Does the result of 92 lefthanded adults appear to be unusually high?
When 650 adults are randomly selected, find the probability that 84 or more of them are lefthanded.Does the result of 84 lefthanded adults appear to be unusually high?
Consider the data set on page 275 in this section that consists of 400 yes and no responses to a survey question. Discuss methods for selecting a random sample from this population. Work with a group of friends (or your whole class), and have each person select a random sample of n = 10 responses
Suppose you have measured the mean in a sample drawn from a much larger population. What value should you use as your estimate of the population mean?
Is it surprising that accurate estimates of the population of London were not available in the 1660s? How would you have suggested making such estimates at that time?
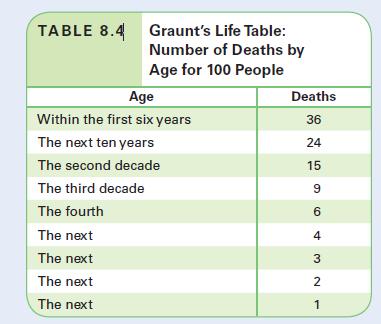
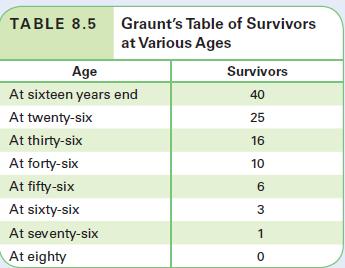
Assuming that the estimates of deaths in Table 8.4 are accurate, are the estimates of survivors in Table 8.5 consistent?Note that the numbers in Table 8.5 do not total to 100; should they? Explain.Table 8.4Table 8.5 TABLE 8.4 Graunt's Life Table: Number of Deaths by Age for 100 People Age Within
If many different random samples of size 100 are selected from the population of voters, what is the shape of the distribution of the sample proportions of registered Republicans?
What is a sample mean? What is a sample proportion? Summarize the notation used for these statistics.
What do the notations x and p represent? Why are they important?
Suppose you seek a particular margin of error for your study. How can you determine appropriate sample size?
A journal article provides a confidence interval for a proportion in the format 0.35 + 0.05. Express this confidence interval in the format a < p < b.
Based on Graunt’s tables, estimate the average life expectancy in the 1660s. Explain your reasoning.
I selected three different samples of size n = 10 drawn from the 1500 students at my school, and with these, I constructed the sampling distribution.Does It Make Sense? For Exercises, determine whether the statement makes sense (or is clearly true) or does not make sense (or is clearly false).
Assume that we want to estimate the mean annual income of adult males in the United States. If a random sample of annual incomes of adult males is obtained, which of the following is the best estimate of the population mean?a. Median of the sampleb. Mean of samplec. Standard deviation of sampled.
Comment on whether you believe that literature is enhanced by statistical analysis. For example, is your appreciation of Shakespeare improved by knowing how many words Shakespeare knew?
Nielsen Media Research determined the precise proportion of all Americans watching the Super Bowl by conducting a survey of a few thousand households.
Based on our sample, the 95% confidence interval for the mean amount of television watched by adult Americans is 2.5 to 2.7 hours per day. Therefore, 95% of all Americans watch between 2.5 and 2.7 hours of TV per day.Does It Make Sense? For Exercises, determine whether the statement makes sense (or
A random sample of 235 females and 240 males is obtained for a clinical trial. Construct a 95% confidence interval to estimate the proportion of females in all such samples.
Do you believe that statistical analysis is useful for identifying authors of “lost works”?
Although Nielsen surveys only a few thousand households out of the millions that own TVs, they have a good chance of getting an accurate estimate of the proportion of the population watching the Super Bowl.
Based on our sample, the 95% confidence interval for the mean amount of television watched by adult Americans is 2.5 to 2.7 hours per day. Therefore, there is a 95% chance that the mean for all Americans will fall somewhere in this range and a 5% chance that it will not.Does It Make Sense? For
Find the margin of error and sample mean corresponding to this 95% confidence interval: 98.0 < μ < 98.6.
Suggest another discipline, besides biology and literature, in which the ideas described here could be used to estimate an unknown quantity.
Our study measured the birth weights and incidence of jaundice among a sample of babies born at our hospital, and we found x = 6.7 pounds and pn = 0.45, or 45% showed signs of jaundice.
Although it made our study more expensive, we chose a larger sample size in order to have a smaller margin of error.Does It Make Sense? For Exercises, determine whether the statement makes sense (or is clearly true) or does not make sense (or is clearly false). Explain clearly. Not all of these
For a random sample of 575 randomly selected car batteries, it was found that their output had a mean of 12.2volts and a standard deviation of 1.4 volts.Notation. In Exercise, identify the notation for each given number.
One study involved a sample of people’s body temperatures and it resulted in this 95% confidence interval for the mean: 98.1° < F 6 μ m < 6 98.3 °F. Interpret this confidence interval.Does It Make Sense? For Exercises, determine whether the statement makes sense (or is clearly true) or
A college has 3427 enrolled students. When 50 of them were randomly selected for a survey, it was found that 10% of them were in favor of fees for parking permits.Notation. In Exercise, identify the notation for each given number.
Based on a random sample of 48 birth weights of girls born at Albany Medical Center Hospital, the sample mean is 2965 grams and the margin of error for a 95% confidence interval is 245 grams. Find the 95% confidence interval.
Identify what is wrong with this 95% confidence interval for a population proportion: $250 < p < $500.
A college has 3427 enrolled students. When 50 of them were randomly selected for a survey, it was found that 10% of them were in favor of fees for parking permits.Notation. In Exercise, identify the notation for each given number.
Among all of the 50,000 aspirin tablets produced by a pharmaceutical company over a given period, a sample of 200 tablets is tested and the mean amount of aspirin in these tablets is found to be 328 milligrams (mg) with a standard deviation of 12 mg.Notation. In the Exercise, identify the notation
In a clinical trial, 11,000 male physicians were treated with aspirin and another 11,000 male physicians were given a placebo. A variable of interest was the proportion of heart attacks among the physicians. Do the results from this study apply to females? Why or why not?
Sample size, n = 100; sample mean, x = 55.0 cm; sample standard deviation, s = 5.0 cmMargins of Error and Confidence Intervals. For Exercises 13–16, assume that population means are to be estimated from the samples described. In each case, use the sample results to approximate the margin of
When 50 adult females were randomly selected and their pulse rates were measured, the mean of 75.5 beats per minute (bpm) was obtained. When the sample size was increased to 147 adult females, a mean of 74.0 bpm was obtained. Is the mean from the larger sample closer to the population mean than the
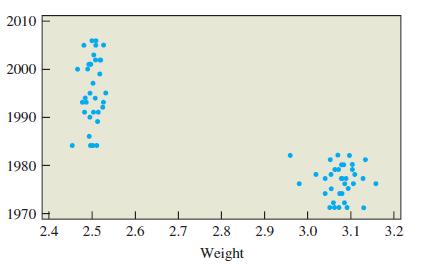
The scatterplot in Figure 7.18 depicts paired data values consisting of the weight (in grams) and year of manufacture for each of 72 pennies.a. Considering the complete collection of data, does there appear to be a correlation?b. Consider the grouping of data points on the left. Does there appear
If 250 adults are randomly selected, find the probability that 15 or fewer of them are left-handed.Does the result of 15 lefthanded adults appear to be unusually low?
Find a recent news report in which you believe that a correlation has been presented with a reasonable interpretation. Describe the correlation and the reported interpretation, and explain why you think the interpretation is valid.
If 500 adults are randomly selected, find the probability that 45 or fewer of them are lefthanded.Does the result of 45 lefthanded adults appear to be unusually low?
Find a recent news report in which you believe that a correlation may have been misinterpreted. Describe the correlation, the reported interpretation, and the problems you see in the interpretation.
A random sample of 81 newborn girls is obtained and they have a mean birth weight of 2919 grams. What is the probability of randomly selecting another 81 newborn girls and getting a mean birth weight that is 2919 grams or less?Does it seem like a sample mean of 2919 grams is unusual?
Real Correlationsa. Describe a real situation in which there is a positive correlation that is the result of coincidence.b. Describe a real situation in which there is a positive correlation that is the result of a common underlying cause.
A random sample of 64 newborn girls is obtained and they have a mean birth weight of 3390 grams. What is the probability of randomly selecting another 64 newborn girls and getting a mean birth weight that is 3390 grams or more? Does it seem like a sample mean of 3390 grams is unusual?
A random sample of 36 newborn girls is obtained and they have a mean birth weight of 3272 grams. What is the probability of randomly selecting another 36 newborn girls and getting a mean birth weight that is 3272 grams or more? Does it seem like a sample mean of 3272 grams is unusual?
Come up with an example from your own life or work in which a multiple regression analysis might reveal important trends. Without actually doing any analysis, describe in words what you would look for through the multiple regression and how the answers might be useful.
A random sample of 100 newborn girls is obtained and they have a mean birth weight of 2966 grams. What is the probability of randomly selecting another 100 newborn girls and getting a mean birth weight that is 2966 grams or lower? Does it seem like a sample mean of 2966 grams is unusual?
Although scatterplots are rare in the news, they are not unheard of. Find a scatterplot of any kind in a news article (recent or not). Draw a best-fit line by eye. Discuss what predictions, if any, can be made from your best-fit line.
The ages (in years) of the four U.S. presidents when they were assassinated in the office are 56(Lincoln), 49 (Garfield), 58 (McKinley), and 46 (Kennedy). Consider these four ages to be a population.a. Assuming that two of the ages are randomly selected to form samples of size n = 2 with
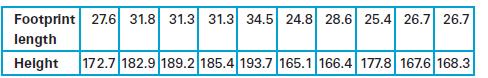
The following table lists the footprint length (in centimeters) and height (in centimeters) of 10 subjects (including both men and women).a. Use either a scatterplot or a formula for the linear correlation coefficient to determine whether there is a correlation between the two variables. b.
Find a recent news report in which a correlation is used to make a prediction. Evaluate the validity of the prediction, considering all of the cautions described in this section. Overall, do you think the prediction is valid? Why or why not?
Many of the most impoverished nations have high population growth rates, which can make it even more difficult to raise a population out of poverty. Demographers, therefore, look for correlations that might help people in these nations achieve lower population growth rates. Research some of the
The College of Portland has a total enrollment of N = 2444 students and 269 of them are lefthanded. You conduct a survey of n = 50 students and find that 8 of them are lefthanded.a. What is the population proportion, p, of left-handed students?b. What is the sample proportion, pn, of left-handed
Research asbestos, its sources, and its effects. Discuss the correlations that have helped researchers understand adverse health effects from asbestos exposure. Discuss efforts to prevent those adverse health effects.
A population consists of a batch of 25,344 aspirin tablets, and it includes 1,014 that are defective because they do not meet specifications. A random sample of n = 250 of the tablets is obtained and tested, with the result that 18 of them are defective.a. What is the population proportion, p, of
Research the correlations that have helped researchers understand lead poisoning. Discuss efforts to prevent it. Include discussion of the causes and effects of the lead poisoning that occurred in the water supply of Flint, Michigan.
Assume that the population of heights of adult males has a normal distribution with a mean of m = 174.1 centimeters (cm) and a standard deviation of s = 7.1 cm.a. If a sample of size n = 100 adult males results in a mean height of x = 172.0 cm, how many standard deviations is the sample mean away
Data from the Centers for Disease Control and the Department of Energy show that as the numbers of people who drown in swimming pools increases, the power generated by nuclear plants also increases.
It has been found that when gas prices increase, the distances that vehicles are driven tend to get shorter.
When 50 adult females were randomly selected and their pulse rates were measured, the mean of 75.5 beats per minute (bpm) was obtained. When the sample size was increased to 147 adult females, a mean of 74.0 bpm was obtained. Is the mean from the larger sample closer to the population mean than the
Astronomers have discovered that, with the exception of a few nearby galaxies, all galaxies in the universe are moving away from our solar system. Moreover, the farther away the galaxy is, the faster it is moving away.
In a clinical trial, 11,000 male physicians were treated with aspirin and another 11,000 male physicians were given a placebo. A variable of interest was the proportion of heart attacks among the physicians. Do the results from this study apply to females? Why or why not?
Among all of the 50,000 aspirin tablets produced by a pharmaceutical company over a given period, a sample of 200 tablets is tested and the mean amount of aspirin in these tablets is found to be 328 milligrams (mg) with a standard deviation of 12 mg.
Data from the National Vital Statistics Reports and the U.S. Department of Agriculture show that over the past several years in Maine, the divorce rate declined and per capita, margarine consumption also declined.
Among all of the 50,000 aspirin tablets produced by a pharmaceutical company over a given period, a sample of 200 tablets is tested and it is found that 4% of them do not meet specifications.
A college has 3427 enrolled students. When 50 of them were randomly selected for a survey, it was found that 10% of them were in favor of fees for parking permits.
If a best-fit line is inserted in a scatterplot, it must pass through every point on the graph.
For a random sample of 575 randomly selected car batteries, it was found that their output had a mean of 12.2volts and a standard deviation of 1.4 volts.
Based on what you’ve learned about the cause of global warming and its potential consequences, what do you think we should be doing about it, if anything?
A scatterplot is a graph in which the points are scattered throughout, without any noticeable pattern.In Exercise, determine whether the given statement is true or false.
Our study measured the birth weights and incidence of jaundice among a sample of babies born at our hospital, and we found x = 6.7 pounds and pn = 0.45, or 45% showed signs of jaundice.Does It Make Sense? For Exercises, determine whether the statement makes sense (or is clearly true) or does not
Investigate some of the likely consequences of global warming. If current trends continue, what changes can you expect in the world by the year 2050? By the year 2100?
If r = 1 or r = -1, then all points in the scatterplot lie directly on the best-fit line.In Exercise, determine whether the given statement is true or false.
In seeking to understand the factors that affect a college graduate’s future income, researchers conducted a multiple regression analysis that examined the effects of major, grade point average, the ranking of the college, parental affluence, and parental education.Does It Make Sense? For
The correlation I found was so strong that a careful calculation showed it had less than a 1 in 100,000 probability of occurring by chance. Therefore, I can reasonably conclude that one variable is the cause of the other.
Although Nielsen surveys only a few thousand households out of the millions that own TVs, they have a good chance of getting an accurate estimate of the proportion of the population watching the Super Bowl.Does It Make Sense? For Exercises, determine whether the statement makes sense (or is clearly
If r = 0.200, then r2 = 0.040 and 4% of the plotted points lie on the best-fit line.In Exercise, determine whether the given statement is true or false.
The College Board website gives the distribution of SAT scores (usually in 50-point bins). Collect these data and construct a histogram for each part of the test. Discuss the validity of the claim that SAT scores are normally distributed
Using sample data on footprint lengths and heights from men, the equation of the best-fit line is obtained, and it is used to find that a man with a footprint length of 36 inches is predicted to have a height of 144 inches, or 12 feet.Does It Make Sense? For Exercises, determine whether the
Nielsen Media Research determined the precise proportion of all Americans watching the Super Bowl by conducting a survey of a few thousand households.Does It Make Sense? For Exercises, determine whether the statement makes sense (or is clearly true) or does not make sense (or is clearly false).
Showing 200 - 300
of 1156
1
2
3
4
5
6
7
8
9
10
11
12
Step by Step Answers