New Semester
Started
Get
50% OFF
Study Help!
--h --m --s
Claim Now
Question Answers
Textbooks
Find textbooks, questions and answers
Oops, something went wrong!
Change your search query and then try again
S
Books
FREE
Study Help
Expert Questions
Accounting
General Management
Mathematics
Finance
Organizational Behaviour
Law
Physics
Operating System
Management Leadership
Sociology
Programming
Marketing
Database
Computer Network
Economics
Textbooks Solutions
Accounting
Managerial Accounting
Management Leadership
Cost Accounting
Statistics
Business Law
Corporate Finance
Finance
Economics
Auditing
Tutors
Online Tutors
Find a Tutor
Hire a Tutor
Become a Tutor
AI Tutor
AI Study Planner
NEW
Sell Books
Search
Search
Sign In
Register
study help
sciences
statistical reasoning for everyday life
Statistical Reasoning For Everyday Life 5th Edition Jeff Bennett, William Briggs, Mario Triola - Solutions
There were 1,038,280 bankruptcy cases filed last year, and in the year 2000 there were 1,276,900 bankruptcy cases filed Relative Change. Exercises each provide two values. For each pair of values, use a percentage to express their relative change or difference. Use the second given value as the
The area codes (such as 617) of the telephone numbers of survey subjects.Qualitative versus Quantitative Data. In Exercises, determine whether the data described are qualitative or quantitative,and explain why?
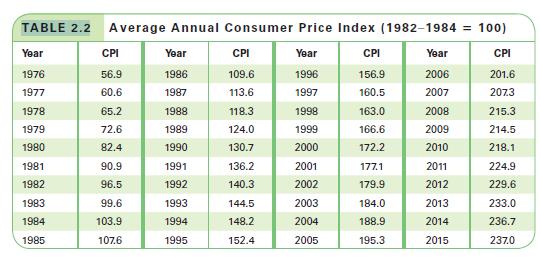
In 2005, the average price of electricity was 10.0 cents per kWh (kilowatt-hour), and in 2015, the average price was 13.8 cents per kWh. Compare the increase in the price of electricity to the increase in price corresponding to the CPI.Consumer Price Index. In Exercises, use the Consumer Price
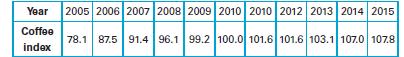
If you spent $4.75 for a pound of coffee in 2015, what would the price have been in 2010?Coffee Index. In Exercises, use the following table of index numbers based on the price of a pound of coffee. The index numbers use 2010 as the base year Year 2005 2006 2007 2008 2009 2010 2010 2012 2013 2014
The U.S. population is now 323,447,281, and in 2000 it was 282,171,957.Relative Change. Exercises each provide two values. For each pair of values, use a percentage to express their relative change or difference. Use the second given value as the reference value, and express results to the nearest
Periodically, a survey is conducted in which subjects are asked if they wash their hands after using a public restroom.
The SAT scores of randomly selected applicants to colleges.Qualitative versus Quantitative Data. In Exercises, determine whether the data described are qualitative or quantitative,and explain why?
There are now 256 million registered passenger cars, and in 1990 there were 193 million.Relative Change. Exercises each provide two values. For each pair of values, use a percentage to express their relative change or difference. Use the second given value as the reference value, and express
The number of households with a television in use when surveyed by Nielsen Media Research.Qualitative versus Quantitative Data. In Exercises, determine whether the data described are qualitative or quantitative,and explain why?
In 1980, the average price of a gallon of gas was $1.22, and in 2015 the average price was $2.52. Compare the increase in the price of a gallon of gasoline to the increase in price corresponding to the CPI.Consumer Price Index. In Exercises, use the Consumer Price Index values from Table 2.2. TABLE
The average annual cost (tuition, fees, and room and board) at four-year public universities rose from $2550 in 1980 to $19,548 in 2015. Compare the increase in the cost of college to the increase in cost corresponding to the CPI.Consumer Price Index. In Exercises, use the Consumer Price Index
The number of daily newspapers in the United States is now 1486, and it was 2226 in 1990.Relative Change. Exercises each provide two values. For each pair of values, use a percentage to express their relative change or difference. Use the second given value as the reference value, and express
The television shows being watched by households surveyed by Nielsen Media Research.Qualitative versus Quantitative Data. In Exercises, determine whether the data described are qualitative or quantitative,and explain why?
The average annual cost (tuition, fees, and room and board) at four-year private colleges rose from $5600 in 1980 to $43,921 in 2015. Compare the increase in the cost of college to the increase in cost corresponding to the CPI.Consumer Price Index. In Exercises, use the Consumer Price Index values
In studying different prehistoric societies, an archeologist measures head circumferences of skulls.Qualitative versus Quantitative Data. In Exercises, determine whether the data described are qualitative or quantitative,and explain why?
If you spent $14,222 for goods, services, and housing in 1985, what would the same purchases have cost in 2010?Consumer Price Index. In Exercises, use the Consumer Price Index values from Table 2.2. TABLE 2.2 Average Annual Consumer Price Index (1982–1984 =
Randomly selected adult subjects are asked to report their total annual income.
You spent $23,875 for goods, services, and housing in 2014, what would the same purchases have cost in 1980?Consumer Price Index. In Exercises, use the Consumer Price Index values from Table 2.2. TABLE 2.2 Average Annual Consumer Price Index (1982–1984 =
If you spent $12,250 on goods, services, and housing in 2000, what would the same purchases have cost in 2015?Consumer Price Index. In Exercises, use the Consumer Price Index values from Table 2.2. TABLE 2.2 Average Annual Consumer Price Index (1982–1984 =
The responses (yes, no, or no response) from survey subjects when asked a question.Qualitative versus Quantitative Data. In Exercises, determine whether the data described are qualitative or quantitative,and explain why?
Olympic athletes are categorized according to the sport in which they compete, such as track and field, cycling, or gymnastics.Qualitative versus Quantitative Data. In Exercises, determine whether the data described are qualitative or quantitative, and explain why.
Measurements of blood alcohol concentration (BAC), which represent how much alcohol is found in the blood.Qualitative versus Quantitative Data. In Exercises, determine whether the data described are qualitative or quantitative, and explain why.
If the CPI increases, must wage also increase? Explain.Does It Make Sense? For Exercises, determine whether the statement makes sense (or is clearly true) or does not make sense (or is clearly false). Explain clearly; not all of these have definitive answers, so your explanation is more important
Explain the difference between the terms percent (%) and percentage points. Give an example of how they can differ for the same situation.
Do a Web search using “benefit of tax cuts” and find an article arguing for or against a particular tax cut proposal or policy. Briefly summarize the article and discuss whether you think it made its case well.
Why can it be misleading to give measurements with more precision than is justified by the measurement process?Does It Make Sense? For Exercises, determine whether the statement makes sense (or is clearly true) or does not make sense (or is clearly false). Explain clearly; not all of these have
A researcher measures the braking reaction time of a subject and records a value of 2.4 seconds, but the subject’s actual braking reaction time is 1.9 seconds. What is the relative error?
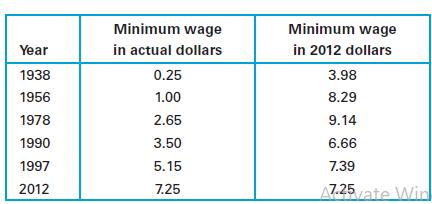
Minimum Wage. The following table lists the federal hourly minimum wage in both actual dollars at the time and 2012 dollars (based on data from the U.S. Department of Labor).a. According to the table, how much is $0.25 in 1938 dollars worth in 2012 dollars?b. According to the table, how much is
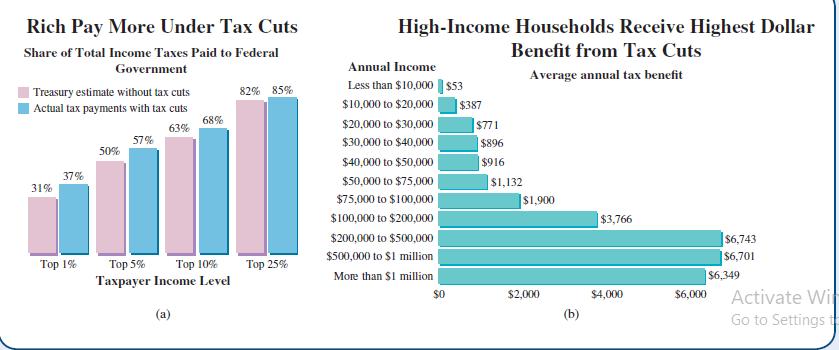
Do you think that either of the charts in Figure 2.4 accurately portrays the overall “fairness” of the tax cuts? If so, which one and why? If not, how do you think the data could have been portrayed more fairly?Figure 2.4 Rich Pay More Under Tax Cuts High-Income Households Receive Highest
Explain why temperatures on the Fahrenheit or Celsius scales are at the interval level of measurement while distances are at the ratio level.
In making price comparisons, why is it important to adjust prices for the effects of inflation? Briefly describe how we use the CPI to adjust prices.
Explain the difference between the key words of and more than when dealing with percentages. How are their meanings related?
The Academy Awards, the Heisman Trophy, and the New York Times “Bestseller List” are just three examples of selections that are determined by the votes of specially selected individuals. Pick one of these selection processes, and describe who votes and how those people are chosen. Discuss
Search through recent newspapers or journals and find an example of an observational, retrospective study. Briefly describe the study and summarize its conclusions
Motivated by a student’s death due to binge drinking, the College of Newport conducts a study of student drinking by randomly selecting 10 different classes and interviewing all of the students in each of those classes.
If all subjects in the aspirin treatment group are athletes and all subjects in the control group are not athletes, then there is a danger of which of the following: (a) Samples that are too small(b) Confounding(c) Blinding
If we see a placebo effect, it means: (a) The experiment was not really double-blind(b) The experimental groups were too small(c) Pulse rates were lowered among some of those in the placebo group.
The purpose of the placebo is: (a) To prevent participants from knowing whether they belong to the treatment group or the control group; (b) To distinguish between the cases and the controls in a case-control study; (c) To determine whether pulse rates are affected by participation
The subjects do not know whether they are given aspirin or a placebo, and the evaluators who measure the pulse rates also do not know. This trial is: (a) Single-blind(b) Double-blind(c) Not blinded
I wanted to know approximately what fraction of students at my school are left-handed, so I used a convenience sample in which I surveyed all of the students in my statistics class.
If we learn that the sample is representative of the population, which of the following best describes the results: (a) The results found for the sample are similar to those we would find for the entire population(b) The sample is very large(c) The sample was chosen in the best possible wayIn
In testing the effectiveness of a new vaccine, suppose that researchers used males for the treatment group and females for the placebo group. What is confounding, and how would it affect such an experiment?
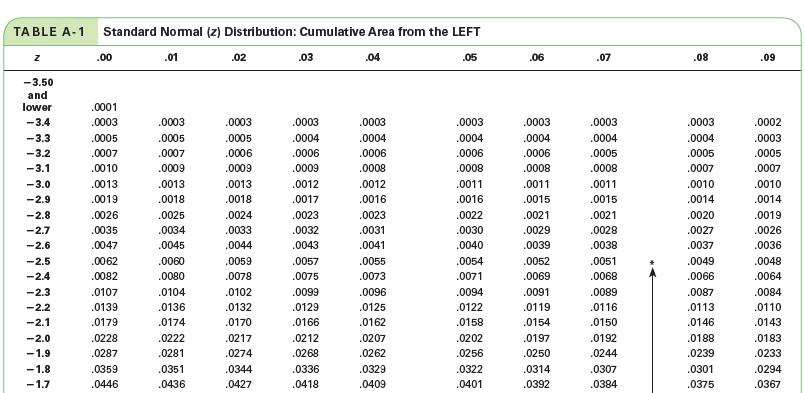
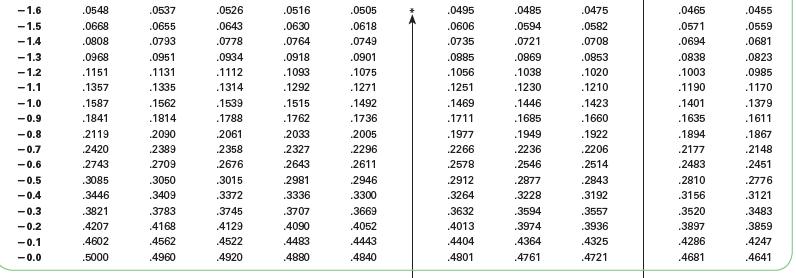
z = -1.7 for H0 : μ = 36.9 degrees and Ha: μ 36.9 degreesUsing P-Values to Reject or Not Reject. In Exercise, use Table A-1 to find the P-value that corresponds to the given standard score, and determine whether to reject the null hypothesis at the 0.05 significance level. Is the alternative
Researchers developed a questionnaire to identify compulsive buyers. A random sample of 32 subjects who identified themselves as compulsive buyers was obtained, and these subjects had a mean questionnaire score of 0.83 with a standard deviation of 0.24. Test the claim that the population of
When interpreting a P-value of 0.009, a researcher states that the results are statistically significant because the P value is very small, indicating that the results are not likely to occur by chance.
A handy mnemonic for interpreting the P-value in a hypothesis test is this: “If the P (value) is low, then the null must go.Does It Make Sense? For Exercise, determine whether the statement makes sense (or is clearly true) or does not make sense (or is clearly false). Explain clearly. Not all of
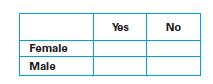
Test statistic: x2 = 3.957; significance level: 0.05 Test statistic: x2 = 3.499; significance level: 0.05 Survey Results. In the Exercise, assume that a yes/no survey question is presented to a simple random sample of male and female subjects and the results are summarized in a two-way table with
Investigate how GM crops may play a role in reducing global warming. Does this alter your own opinions about them in any way? Explain.
Test statistic: x2 = 12.336; significance level: 0.01Test statistic: x2 = 3.499; significance level: 0.05 Survey Results. In the Exercise, assume that a yes/no survey question is presented to a simple random sample of male and female subjects and the results are summarized in a two-way table with
A simple random sample of epicenter depths of 51 earthquakes has a mean of 9.808 kilometers (km) and a standard deviation of 5.013 km. Determine the critical value of t and the margin of error, and then construct the 95% confidence interval estimate of the mean epicenter depth of all earthquakes.
Test statistic: x2 = 3.849; significance level: 0.01Test statistic: x2 = 3.499; significance level: 0.05 Survey Results. In the Exercise, assume that a yes/no survey question is presented to a simple random sample of male and female subjects and the results are summarized in a two-way table with
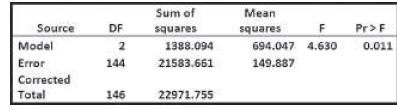
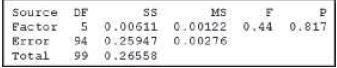
A random sample of adult females is partitioned into the age categories 18–24, 25–50, and over 50. The pulse rates of the subjects in the three different age categories are measured, and the analysis of variance results obtained from Excel are shown in Figure 10.6. Use a significance level of
A random sample of M&Ms is partitioned into six categories according to color. The weights (in grams) are obtained, and the analysis of variance results are as shown in the display in Figure 10.5.a. What is the null hypothesis?b. What is the alternative hypothesis?c. Identify the P-value.d. Is
Based on information from the National Cyber Security Alliance, 93% of computer owners believe that they have antivirus programs installed on their computers. In a random sample of 400 scanned computers, it is found that 380 of them (or 95%) actually have antivirus programs. Use the sample data
A study was conducted to estimate hospital costs for accident victims who wore seat belts. Twenty randomly selected cases have a distribution that appears to be approximately bell-shaped with a mean of $9004 and a standard deviation of $5629 (based on data from the U.S. Department of
A medical researcher wants to test the claim that healthy adults have a mean body temperature less than 98.6 F.
In a KRC Research poll, 1002 adults were asked if they felt vulnerable to identity theft, and 53% of them said “yes.” Test the claim that the majority of adults feel vulnerable to identity theft.
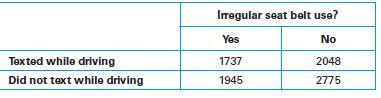
In a study of high school students at least 16 years of age, researchers obtained the survey results summarized in the accompanying table. Use a 0.05 significance level to test the claim of independence between texting while driving and irregular seat belt use. Are those two risky behaviors
Each car in a sample of seven cars was tested for nitrogen-oxide emissions (in grams per mile), and the following results were obtained: 0.06, 0.11, 0.16, 0.15, 0.14, 0.08, 0.15 (based on data from the Environmental Protection Agency). Assume that nitrogen-oxide emissions are normally distributed
A medical researcher wants to test the claim that healthy adults have a mean body temperature of 98.6 F.
In a study of 1228 randomly selected medical malpractice lawsuits, it was found that 856 of them were dropped or dismissed. Test the claim that most medical malpractice lawsuits are dropped or dismissed.
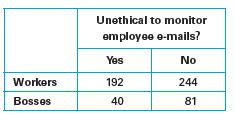
Workers and senior-level bosses were asked if it was seriously unethical to monitor emp oyee e-mails; the results are summarized in the following table (based on data from a Gallup poll). Use a 0.05 significance level to test the claim that the response is independent of whether the subject is a
Listed below are lengths (in minutes) of randomly selected movies. The lengths of all movies are assumed to be normally distributed.110 96 125 94 132 120 136 154 149 94 119 132a. Construct a 95% confidence interval estimate of the mean length of all movies.b. Is it reasonable for a manager of a
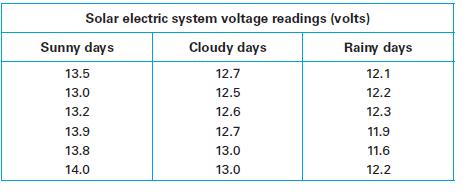
A student of one of the authors of this text lives in a home with a solar electric system. At the same time each day, she collected voltage readings (in volts) from a meter connected to the system and the results are listed in the accompanying table.Use a 0.05 significance level to test the claim
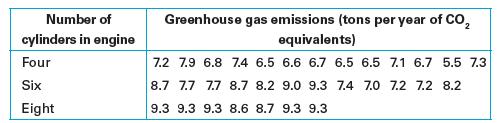
Listed below are measured amounts of greenhouse gas emissions from cars in three different categories. The measurements are in tons per year, expressed as CO2 equivalents. Use a 0.05 significance level to test the claim that the different car categories have the same mean amount of greenhouse gas
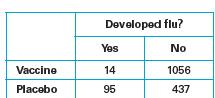
In a USA Today article about an experimental vaccine for children, the following statement appeared: “In a trial involving 1602 children, only 14 (1%) of the 1070 who received the vaccine developed the flu, compared with 95 (18%) of the 532 who got a placebo.”. Does the vaccine appear to be
The quality control manager at a manufacturing company claims that the proportion of defective transistors is greater than 0.03.
Listed below are brain volumes (in cubic centimeters or cm3) of adult subjects used in a study. Use the sample data to construct a 95% confidence interval estimate of the mean of the normally distributed brain volumes of the entire adult population. Given that typical brain volumes are between 950
The quality control manager at a manufacturing company claims that the proportion of defective transistors is 0.03.
Listed below are the measured “specific absorption rates” (SARs) of radiation (in watts per kilogram, or W/kg) from a sample of cell phones (when held to the head). The data are from the Environmental Working Group. The media often present reports about the dangers of cell phone radiation as a
A simple random sample of 16 different cereals is obtained, and the sugar content (in grams of sugar per gram of cereal) is measured for each cereal selected. Those amounts have a mean of 0.295 gram and a standard deviation of 0.168 gram. The amount of sugar in all cereals is assumed to be normally
Of the 98 participants in a drug trial who were given a new experimental treatment for arthritis, 56 showed improvement. Of the 92 participants given a placebo,49 showed improvement. Construct a two-way table for these data, and then use a 0.05 significance level to test the claim that improvement
Find a journal article that refers to the use of analysis of variance. Identify the test being used and describe the conclusion. Did the test result in rejection of the existence of equal means? What was the P-value? What was the role of the method of analysis of variance?
A sales representative claims that quarters inserted into her vending machines have a mean weight less than 5.64 grams.State the null and alternative hypothesis for a hypothesis, indicate whether the hypothesis test will be left tailed, right tailed or two tailed and clearly state the two possible
z = -3.0 for H0: = 15 centimeters and Ha: μ = 15 centimetersUsing P-Values to Reject or Not Reject. In Exercise, use Table A-1 to find the P-value that corresponds to the given standard score, and determine whether to reject the null hypothesis at the 0.05 significance level. Is the alternative
z = -1.5 for H0: μ = 15 centimeters and Ha: μ <15 centimetersUsing P-Values to Reject or Not Reject. In Exercise, use Table A-1 to find the P-value that corresponds to the given standard score, and determine whether to reject the null hypothesis at the 0.05 significance level. Is the
The Genetics and IVF Institute conducted a clinical trial of the XSORT method designed to increase the probability of conceiving a girl. As of this writing, 945 babies were born to parents using the XSORT method, and 93% of them were girls. Test the claim that the XSORT method is effective in
A random sample of 760 subjects was obtained, and each was tested for left-handed writing. Among the 240 males, 23 wrote with their left hand. Among the 520 females, 65 wrote with their left hand. The data are from the Education Resources Information Center. Construct a two-way table for these
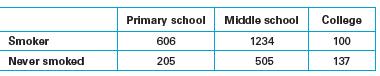
The table below summarizes results from a survey of males aged 15 or older living in the Minhang District of China. The males are categorized by their educational attainment and whether they smoke. Using a 0.05 significance level, test the claim that smoking is independent of educational
z = 3.0 for H0: μ = 15 centimeters and Ha: μ 7 15 centimetresUsing P-Values to Reject or Not Reject. In Exercise, use Table A-1 to find the P-value that corresponds to the given standard score, and determine whether to reject the null hypothesis at the 0.05 significance level. Is the alternative
Find a recent news article discussing the salaries of players on different professional sports teams, such as several baseball teams. Find the salaries and use analysis of variance to test the null hypothesis of equal means. Summarize your findings and write a brief report that includes your
A bookstore owner claims that the proportion of people who read books in print is not 0.23.State the null and alternative hypothesis for a hypothesis, indicate whether the hypothesis test will be left tailed, right tailed or two tailed and clearly state the two possible conclusions that address the
z = 1.5 for H0: μ = 15 centimeters and Ha: μ 7 15 centimetersUsing P-Values to Reject or Not Reject. In Exercise, use Table A-1 to find the P-value that corresponds to the given standard score, and determine whether to reject the null hypothesis at the 0.05 significance level. Is the alternative
A bookstore owner claims that the proportion of people who read books in print is greater than 0.25.State the null and alternative hypothesis for a hypothesis, indicate whether the hypothesis test will be left tailed, right tailed or two tailed and clearly state the two possible conclusions that
Given the claim that 10% of Americans are left-handed, randomly select at least 50 American students at your college and determine whether they are left-handed. Test the claim with a formal hypothesis test.
Use the Internet or library references to determine the proportion of Americans who smoke. Test the claim that the proportion of American students at your college who smoke is different from the proportion of all Americans. Collect sample data from at least 50 randomly selected students.
z = 1.7 for H0: μ = 125 pounds and Ha: μ 125 poundsUsing P-Values to Reject or Not Reject. In Exercise, use Table A-1 to find the P-value that corresponds to the given standard score, and determine whether to reject the null hypothesis at the 0.05 significance level. Is the alternative hypothesis
Use the Internet or library references to find the proportion of college students in the United States who are women. Test the claim that the proportion of women students at your college is different from the proportion of all U.S. college students. Collect sample data from at least 100 randomly
z = 2.1 for H0: μ = 232 pounds and Ha: μ 232 poundsUsing P-Values to Reject or Not Reject. In Exercise, use Table A-1 to find the P-value that corresponds to the given standard score, and determine whether to reject the null hypothesis at the 0.05 significance level. Is the alternative hypothesis
Choose two variables that appear to have a relationship that is worth investigating. One variable should have at least two categories of individuals—for example, two or more age categories, racial categories, or geographical locations. The other variable should have at least two categories for
z = -1.9 for H0: m = 0.55 liter and Ha: μ 0.55 literUsing P-Values to Reject or Not Reject. In Exercise, use Table A-1 to find the P-value that corresponds to the given standard score, and determine whether to reject the null hypothesis at the 0.05 significance level. Is the alternative
The Statistical Abstract of the United States and the Current Population Survey provide an extensive supply of social, economic, and vital statistics at the county, state, and local levels. Use their websites to compare state data to national data in the following way.a. Choose a variable of
It’s unusual to see a two-way table in a news article. But often a news story provides information that could be summarized in a two-way table. Find an article that discusses a relationship between two variables that could be expressed in a two-way table. Create the table.
The Carolina Tobacco Company advertised that its best-selling nonfiltered cigarettes contain 40 milligrams of nicotine or less, but Consumer Advocate magazine ran tests on 10 randomly selected cigarettes and found the amounts (in milligrams) shown below. 47.3 39.3 40.3 38.3 46.3 43.3 42.3
News reports often describe the results of statistical studies in which the conclusions came from a hypothesis test involving two-way tables. However, the reports rarely give the actual table or describe the details of the hypothesis test. Find a recent news report in which you think the
Use the sample data listed in Exercise 17 with a 0.05 significance level to test the claim that the sample is from a population with a mean equal to 1000 cm3 Exercise 17Listed below are brain volumes (in cubic centimeters or cm3) of adult subjects used in a study. Use the sample data to
Think of an example of something you’d like to know that could be tested with a hypothesis test on a two-way table. Without actually collecting data or doing any calculations, describe how you would go about conducting your study. That is, describe how you would collect the data, explain how you
z = -2.7 for H0: m = 120.5 kilograms and Ha: μ120.5 kilogramsUsing P-Values to Reject or Not Reject. In Exercise, use Table A-1 to find the P-value that corresponds to the given standard score, and determine whether to reject the null hypothesis at the 0.05 significance level. Is the alternative
z = -2.1 for H0: m = 24.7 miles and Ha: μ 24.7 milesUsing P-Values to Reject or Not Reject. In Exercise, use Table A-1 to find the P-value that corresponds to the given standard score, and determine whether to reject the null hypothesis at the 0.05 significance level. Is the alternative hypothesis
Use the sample data listed in Exercise 18 with a 0.05 significance level to test the claim that the sample is from a population with a mean less than 1.6 W/kg.Exercise 18Listed below are the measured “specific absorption rates” (SARs) of radiation (in watts per kilogram, or W/kg) from a sample
Showing 400 - 500
of 1156
1
2
3
4
5
6
7
8
9
10
11
12
Step by Step Answers