New Semester
Started
Get
50% OFF
Study Help!
--h --m --s
Claim Now
Question Answers
Textbooks
Find textbooks, questions and answers
Oops, something went wrong!
Change your search query and then try again
S
Books
FREE
Study Help
Expert Questions
Accounting
General Management
Mathematics
Finance
Organizational Behaviour
Law
Physics
Operating System
Management Leadership
Sociology
Programming
Marketing
Database
Computer Network
Economics
Textbooks Solutions
Accounting
Managerial Accounting
Management Leadership
Cost Accounting
Statistics
Business Law
Corporate Finance
Finance
Economics
Auditing
Tutors
Online Tutors
Find a Tutor
Hire a Tutor
Become a Tutor
AI Tutor
AI Study Planner
NEW
Sell Books
Search
Search
Sign In
Register
study help
sciences
statistical reasoning for everyday life
Statistical Reasoning For Everyday Life 5th Edition Jeff Bennett, William Briggs, Mario Triola - Solutions
If we record the means from 1000 rolls of 100 dice, the resulting distribution will be closer to a normal distribution than if we record the means from 1000 rolls of 10 dice.Does It Make Sense? For Exercises, determine whether the statement makes sense (or is clearly true) or does not make sense
What percentage of adult males have pulse rates greater than 53 bpm?Pulse Rates. In Exercises, assume that pulse rates of adult males are normally distributed with a mean of 70 beats per minute (bpm) and a standard deviation of 11 bpm.
Discuss personal experiences with the SAT among your classmates. Based on these personal experiences, what do you think the SAT is measuring? Do you think the test is a reasonable way to predict students’ performance in college?Why or why not?
The distribution of annual incomes of U.S. adults is a normal distribution.Does It Make Sense? For Exercises, determine whether the statement makes sense (or is clearly true) or does not make sense (or is clearly false). Explain clearly; not all of these have definitive answers, so your explanation
I found the standard score of the data value, even though I do not know the standard deviation of the data set.Does It Make Sense? For Exercises, determine whether the statement makes sense (or is clearly true) or does not make sense (or is clearly false). Explain clearly; not all of these have
What percentage of adult males have pulse rates less than 81 bpm?Pulse Rates. In Exercises, assume that pulse rates of adult males are normally distributed with a mean of 70 beats per minute (bpm) and a standard deviation of 11 bpm.
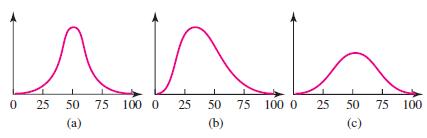
Identify the distribution in Figure 5.6 tha is not normal. Of the two normal distributions, which has the larger standard deviation? или 0 25 50 75 100 0 25 50 75 100 0 (a) (b) 25 50 75 100 (c)
Research the differences between the SAT as given from 2006–2015 and the new SAT instituted in 2016. Do you think the new approach is “better”? Do you think comparisons with past SAT scores can still be meaningful? Defend your opinions.
Weights of adult males are normally distributed with a mean of 85.5 kg and a standard deviation of 17.7 kg. Assume that many samples of size n are taken from a large population of adult males and the mean weight is computed for each sample.
What percentage of adult males have pulse rates between 59 and 92 bpm?Pulse Rates. In Exercises, assume that pulse rates of adult males are normally distributed with a mean of 70 beats per minute (bpm) and a standard deviation of 11 bpm.
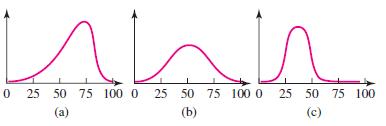
Identify the distribution in Figure 5.7 that is not normal. Of the two normal distributions, which has the larger standard deviation? nnn 0 25 50 75 100 0 25 50 75 100 0 25 50 75 100 (a) (b) (c)
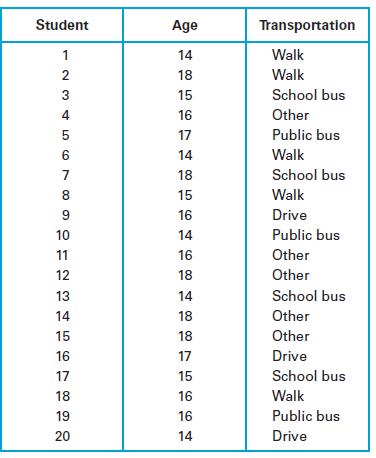
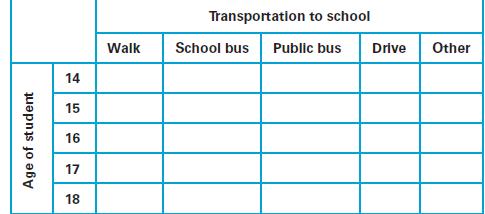
The students in a statistics class conduct a transportation survey of students in their high school. Among other data, they record the age and mode of transportation between home and school for each student. The following table gives some of the data that were collecteda. Classify the two
Pulse rates for adult females are normally distributed with a mean of 74.0 beats per minute (bpm) and a standard deviation of 12.5 bpm. Use the 68-95-99.7 rule to find the following values.a. Percentage of pulse rates less than 74 bpmb. Percentage of pulse rates between 49 and 99 bpmc. Percentage
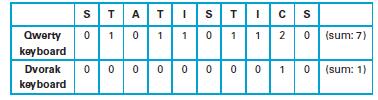
Refer to the Dvorak data in Exercise 21 in Section 3.1 and construct a dotplot. Compare the result to the dotplot from Exercise 21 above. Based on the results, does either keyboard configuration appear to be better? Explain.Exercise 21The traditional keyboard configuration is called a Qwerty
The amounts of rainfall (in inches) on each day of a year in Boston.Normal Distributions. For each of the data sets in Exercises, state whether you would expect it to be normally distributed. Explain your reasoning.
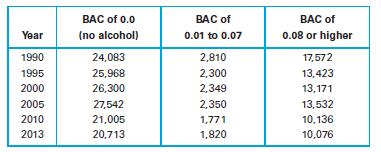
The following table lists the numbers of persons killed in fatal car crashes for three different categories of blood alcohol content (BAC) of drivers. (The data are from the U.S. Census Bureau.)Creating Graphics. Exercises give tables of real data. For each table, construct a graphical display of
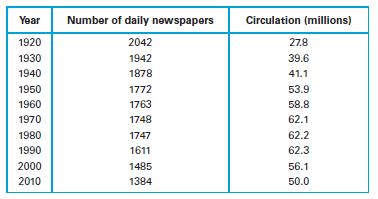
The following table gives the number of daily newspapers and their total circulation (in millions) for selected years since 1920 (from Editor & Publisher).Creating Graphics. Exercises give tables of real data. For each table, construct a graphical display of the data. Choose any graphic type
USA Today offers a daily pictograph for its “Snapshot.” Find a snapshot from a recent issue of USA Today. Briefly discuss its purpose and effectiveness.
The U.S. Energy Information Administration (EIA) website offers dozens of tables relating to energy use, energy prices, and pollution. Explore the selection of tables. Find a table of raw data that is of interest to you and convert it to an appropriate frequency table. Briefly discuss what you can
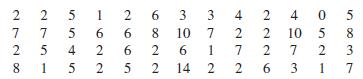
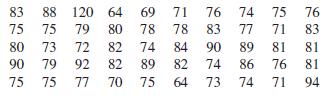
Listed below are the lengths (in minutes) of animated children’s movies. Construct a stemplot. Does the stemplot show the distribution of the data? If so, how? 83 75 80 90 75 88 75 73 79 75 20 19 22 2 27 4 80 82 82 70 120 79 72 77 64 69 78 74 89 75 1 78 84 82 4 71 78 83 76 74 75 76 77 71 83 90 89
Choose some topic that interests you and for which you think good statistical graphs should be available. Do an image search for the topic in Google, Bing, or another search engine. Does the search give you what you were looking for? Briefly discuss the value of the search results in terms of what
The website for the World Conservation Monitoring Centre in Great Britain provides data on extinct,endangered, and threatened animal species. Explore these data and summarize some of your more interesting findings with frequency tables.
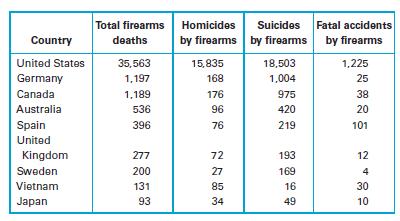
The following table summarizes deaths due to firearms in different nations in a recent year (data from the Coalition to Stop Gun Violence).Creating Graphics. Exercises give tables of real data. For each table, construct a graphical display of the data. Choose any graphic type that you feel is
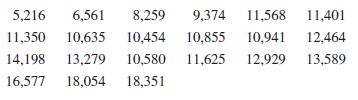
Listed below (in order by row) are annual high values of the Dow Jones Industrial Average from 1995 through 2015. Construct a time-series line chart of the data. Comment on the result. 11,401 5,216 6,561 8,259 9,374 11,568 11,350 10,635 10,454 10,855 10,941 12,464 11,625 12,929 13,589 14,198 13,279
Find an example in a recent news report of a graph that involves some type of perceptual distortion. Explain the effects of the distortion, and describe how the graph could have been drawn more honestly.
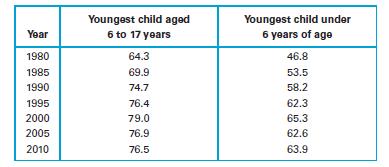
The following table lists labor force participation rates (as percentages) of mothers, categorized according to the age of their youngest child (based on data from the Bureau of Labor Statistics).Creating Graphics. Exercises give tables of real data. For each table, construct a graphical display of
The navel ratio is defined to be a person’s height divided by the height (from the floor) of his or her navel. An old theory says that, on average, the navel ratio of humans is the golden ratio: (1 + 15)/2. Measure the navel ratio of each person in your class. What percentage of students have a
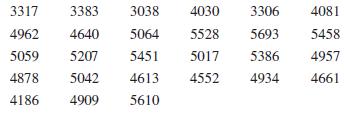
Listed below (in order by row) are the numbers of home runs in Major League Baseball for each year from 1990 through 2016. Construct a time-series line chart of the data. Is there a trend? 3317 3383 4962 4640 5059 5207 4878 5042 4186 4909 4030 3306 5528 5693 5386 4934 3038 5064 5451
Find an example in a recent news report of a graph in which the vertical scale does not start at zero. Suggest why the graph was drawn that way, and also discuss any ways in which the graph might be misleading as a result.
Collect your own frequency data for some set of categories that will not require binning. (For example, you might collect data by asking friends to do a taste test on some brand of cookie.) State how you collected your data, and make a list of all your raw data. Then summarize the data in a
Many websites offer contour maps with current weather data. Find at least two contour weather maps and discuss what they show.
Find an example in a recent news report of a graph that shows economic data over time. Are the data adjusted for inflation? Discuss the meaning of the graph, and describe any ways in which it might be deceptive.
Find recent data on international carbon dioxide emissions. Create a graph of the data and discuss any important features or trends that you notice.
Collect your own frequency data for some set of categories that will require binning (for example, weights of your friends or scores on a recent exam). State how you collected your data, and make a list of all your raw data. Then summarize the data in a frequency table. Include columns for relative
Go to the website for the U.S. Office of Management and Budget (OMB) and look for some of its charts related to the federal budget. Pick two charts of particular interest to you and discuss the data they show.
Find an example of a pictograph in a recent news report. Discuss what the pictograph attempts to show, and discuss whether the artistic embellishments help or hinder this purpose.
Explore the energy tables at the U.S. Energy Information Administration (EIA) website. Choose a table that you find interesting and make a graph of its data, using any of the graph types discussed in this section. Explain how you made your graph, and briefly discuss what can be learned from it.
Find a recent news article that includes some type of frequency table. Briefly describe the table, and explain how it is useful to the news report. Do you think the table was constructed in the best possible way for the article? If so, why? If not, what would you have done differently?
Find an example of a multiple bar graph in a recent news report. Comment on the effectiveness of the display. Could another display have been used to depict the same data?
Find a graph from a recent news report that, in your opinion, is truly outstanding in displaying data visually. Discuss what the graph shows, and explain why you think it is so outstanding.
Go to the website for the Statistical Abstract of the United States. Explore the selection of “frequently requested tables.” Choose one table of interest to you and make a graph from its data, using any of the graph types discussed in this section. Explain how you made your graph, and briefly
Find a recent news article that gives at least some data in the form of relative frequencies. Briefly describe the data, and discuss why relative frequencies were useful in this case.
Find an example of a stack plot in a recent news report. Comment on the effectiveness of the display. Could another display have been used to depict the same data?
Find a graph from a recent news report that, in your opinion, fails in its attempt to display data visually in a meaningful way. Discuss what the graph was trying to show, explain why it failed, and explain how it could have been done better.
Create an appropriate display of the navel data collected in Exercise 25 of Section 3.1. Discuss any special properties of this distribution.Exercise 25The navel ratio is defined to be a person’s height divided by the height (from the floor) of his or her navel. An old theory says that, on
Find a recent news article that gives at least some data in the form of cumulative frequencies. Briefly describe the data, and discuss why cumulative frequencies were useful in this case.
Find an example of a graphic showing geographical data in a recent news report. Comment on the effectiveness of the display. Could another display have been used to depict the same data?
Find a recent news article that includes a bar graph with qualitative data categories.a. Briefly explain what the bar graph shows, and discuss whether it helps make the point of the news article. Are the labels clear?b. Briefly discuss whether the bar graph could be recast as a dotplot.c. Is the
Look for a weather report that lists yesterday’s high temperatures in many American cities. Choosing appropriate bins, make a frequency table for the high-temperature data. Include columns for relative frequency and cumulative frequency.Briefly describe how and why you chose your bins.
Briefly describe at least two possible sources of confusion about the “average.”
What is a weighted mean, and when is it appropriate to use one?
he weights of 1000 AAA batteries of a single brand.Describing Distributions. For each distribution described in Exercises, answer the following questions:a. How many modes would you expect for the distribution?b. Would you expect the distribution to be symmetric, left-skewed, or right-skewed?
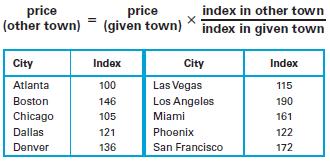
If a house is valued at $375,000 in San Francisco, find the price of a comparable house in Las Vegas.Housing Price Index. Realtors use an index to compare housing prices in major cities. The index numbers for several cities are given in the table below. In Exercises, use the following to find the
Body temperatures in Fahrenheit of all giraffes in Kenya.Levels of Measurement. For the data described in Exercises, identify the level of measurement (nominal, ordinal, interval, or ratio).
If a house is valued at $835,000 in Denver, find the price of a comparable house in Dallas.Housing Price Index. Realtors use an index to compare housing prices in major cities. The index numbers for several cities are given in the table below. In Exercises, use the following to find the price of a
If the population of Montana is 20% less than the population of New Hampshire, then Montana’s population is ____% of New Hampshire’s population.Of versus More Than. Fill in the blanks in Exercises. Briefly explain your reasoning in each case.
Weights of Corvettes that are currently registered in California.Levels of Measurement. For the data described in Exercises, identify the level of measurement (nominal, ordinal, interval, or ratio).
Scores of 0%, 1%, 2%, …, 100% used to rate the quality of a movie.Levels of Measurement. For the data described in Exercises, identify the level of measurement (nominal, ordinal, interval, or ratio).
If a house is valued at $835,000 in Dallas, find the price of a comparable house in Denver.Housing Price Index. Realtors use an index to compare housing prices in major cities. The index numbers for several cities are given in the table below. In Exercises, use the following to find the price of a
The population of the United States in 1860 was 31,443,321.Believable Facts? Exercises give statements of “fact” coming from statistical measurements. For each statement, briefly discuss possible sources of error in the measurement. Then, considering the precision with which the measurement is
A Gallup poll of 1012 American adults showed that 89% of Americans say that human cloning should not be allowed. The margin of error was 3 percentage points. Would it matter if a newspaper reported the margin of error as “3%”? Explain.The Vice President’s salary is currently 42% less than the
Types of movies (drama, comedy, etc.)Levels of Measurement. For the data described in Exercises, identify the level of measurement (nominal, ordinal, interval, or ratio).
Housing Price Index. Realtors use an index to compare housing prices in major cities. The index numbers for several cities are given in the table below. In Exercises, use the following to find the price of a home in the given town.Housing Price Index. Realtors use an index to compare housing prices
Over one full year, there were 33,804 deaths in the United States due to motor vehicle crashes.Believable Facts? Exercises give statements of “fact” coming from statistical measurements. For each statement, briefly discuss possible sources of error in the measurement. Then, considering the
A Pew Research Center survey of 3002 adults showed that the percentage who listen to National Public Radio is probably between 14% and 18% How should a newspaper report the margin of error? Explain.The Vice President’s salary is currently 42% less than the President’s salary, so the Vice
“Categories” 1, 2, 3, 4, and 5, used to describe the intensity of hurricanesLevels of Measurement. For the data described in Exercises, identify the level of measurement (nominal, ordinal, interval, or ratio).
Go to the Producer Price Index (PPI) home page. Read the overview and recent news releases. Write a short summary describing the purpose of the PPI and the ways it differs from the CPI. Also summarize any important recent trends in the PPI.Housing Price Index. Realtors use an index to compare
Last year, the population of China was 1,393,783,836Believable Facts? Exercises give statements of “fact” coming from statistical measurements. For each statement, briefly discuss possible sources of error in the measurement. Then, considering the precision with which the measurement is given,
In a test comparing vinyl and latex laboratory gloves, it was found that 63% of the vinyl gloves leaked (allowing viruses to pass through), but only 7% of the latex gloves leaked.Percentages of Percentages. Exercises describe changes in which the measurements themselves are percentages. Using the
Names, such as Katrina and Sandy, used to identify different hurricanesLevels of Measurement. For the data described in Exercises, identify the level of measurement (nominal, ordinal, interval, or ratio).
The percentage of the world’s population living in developed countries decreased from 27.1% in 1970 to 16.4% now.Percentages of Percentages. Exercises describe changes in which the measurements themselves are percentages. Using the first percentage as the reference value, express each change in
Use a search engine to find recent news about the Consumer Confidence Index. After studying the news, write a short summary of what the Consumer Confidence Index is trying to measure, including a description of any recent trends it has reported.
Use a search engine to find recent news about the Consumer Confidence Index. After studying the news, write a short summary of what the Consumer Confidence Index is trying to measure, including a description of any recent trends it has reported.Housing Price Index. Realtors use an index to compare
The five-year survival rate for Caucasians for all forms of cancer increased from 39% in the 1960s to 61% now.Percentages of Percentages. Exercises describe changes in which the measurements themselves are percentages. Using the first percentage as the reference value, express each change in two
Results from a clinical trial consisting of “true positive,” “false positive,” “true negative,” or “false negative” Levels of Measurement. For the data described in Exercises, identify the level of measurement (nominal, ordinal, interval, or ratio).
The United Nations reported that the global illegal drug trade has a value of $321.6 billion.Believable Facts? Exercises give statements of “fact” coming from statistical measurements. For each statement, briefly discuss possible sources of error in the measurement. Then, considering the
Based on current data, 99.3% of newborns survive the first five years of their lives, and 72.6% of people who reach age 80 years survive the next five years of their lives.
Go to a local supermarket and find the prices of a few staples, such as bread, milk, juice, and coffee. Compute the total cost of those items. Then go to a few small convenience stores and find the prices of the same items. Using the supermarket total as the reference value, compute the index
For the samples described in Exercise 6, the sample means will vary less than the original incomes.Does It Make Sense? For Exercises, determine whether the statement makes sense (or is clearly true) or does not make sense (or is clearly false). Explain clearly; not all of these have definitive
My height puts me in the 37th percentile for my gender, which means my height has a negative standard score.Does It Make Sense? For Exercises, determine whether the statement makes sense (or is clearly true) or does not make sense (or is clearly false). Explain clearly; not all of these have
The distribution of Chromebook sales data over the last year is not normal, because it has two modes corresponding to the holiday season and the back-to-school season.Does It Make Sense? For Exercises, determine whether the statement makes sense (or is clearly true) or does not make sense (or is
Do you think that comparisons of SAT scores over 2 years are meaningful? Over 10 years? Do you agree that the long-term trends indicate that students today have poorer verbal skills but better mathematical skills than those of a few decades ago? Defend your opinions.
Samples of 36 adult males are randomly selected and the mean is found for each sample. What is the standard deviation of the sample means?Pulse Rates. In Exercises, assume that pulse rates of adult males are normally distributed with a mean of 70 beats per minute (bpm) and a standard deviation of
The distribution of incomes of adults is a right-skewed distribution. Therefore, if we select many samples of 64 incomes at random from this distribution, the means of these samples will also have a right-skewed distribution.Does It Make Sense? For Exercises, determine whether the statement makes
My professor graded the final on a curve, and she gave a grade of A+ to anyone who had a standard score of 2 or more.Does It Make Sense? For Exercises, determine whether the statement makes sense (or is clearly true) or does not make sense (or is clearly false). Explain clearly; not all of these
Among a sample of 1037 adult women, pulse rates are normally distributed with a mean of 74.0 beats per minute, but 75% of the women have pulse rates greater than 74.0 beats per minute.Does It Make Sense? For Exercises, determine whether the statement makes sense (or is clearly true) or does not
Overall, do you think that kids today really are smarter than their parents and grandparents, or do you favor a different explanation for the Flynn effect? Discuss in a small group until you reach a consensus, then write a short “legal brief” explaining your group conclusion.
Samples of 36 adult males are randomly selected and the mean is found for each sample. What is the mean of the sample means?Pulse Rates. In Exercises, assume that pulse rates of adult males are normally distributed with a mean of 70 beats per minute (bpm) and a standard deviation of 11 bpm.
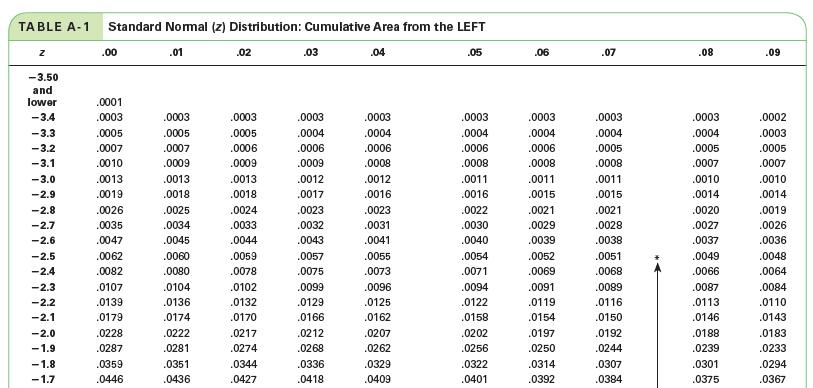
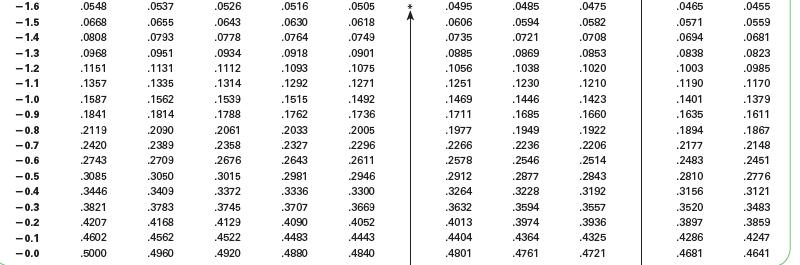
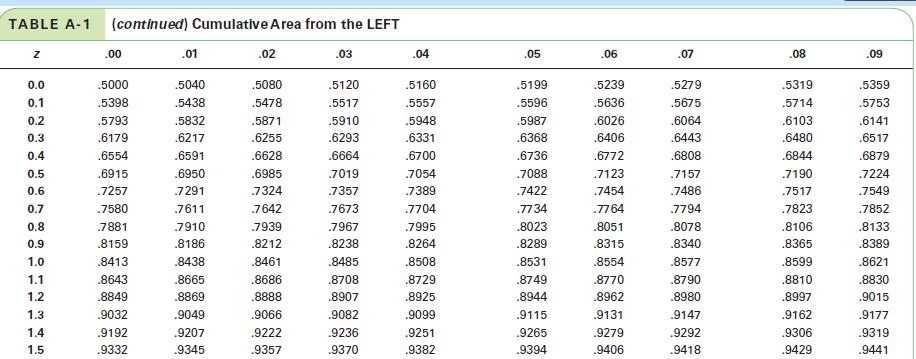
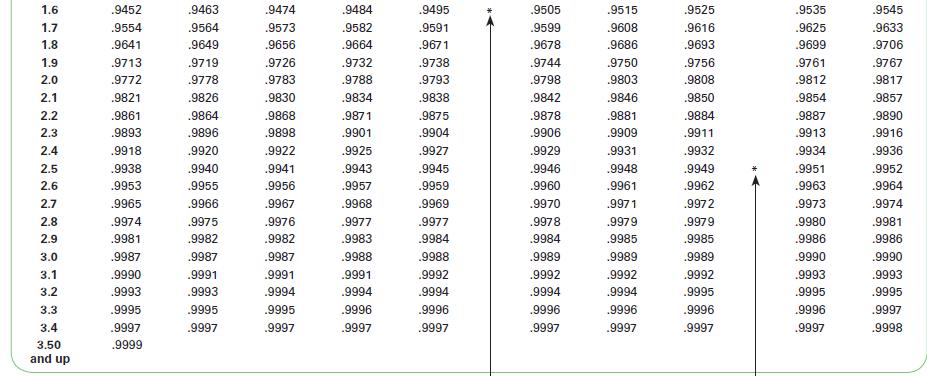
What is a percentile? Describe how Table A-1 (in Appendix A) allows you to relate standard scores and percentiles.Table A-1 TABLE A-1 Standard Normal (z) Distribution: Cumulative Area from the
A process consists of repeating this operation: Randomly select two values from a normally distributed population and then find the mean of the two values. The sample means will be normally distributed, even though each sample has only two values.Does It Make Sense? For Exercises, determine whether
Use Table A-1 to find the percentage of pulse rates of adult men between 60 and 80 bpm.Table A-1Pulse Rates. In Exercises, assume that pulse rates of adult males are normally distributed with a mean of 70 beats per minute (bpm) and a standard deviation of 11 bpm. TABLE A-1 (continued) Cumulative
Research the differences between the SAT as given from 2006–2015 and the new SAT was instituted in 2016. Do you think the new approach is “better”? Do you think comparisons with past SAT scores can still be meaningful? Defend your opinions.
Briefly describe the four conditions under which we can expect a data set to have a nearly normal distribution. Give an example of a set of data that might be approximated by the normal distribution.
Briefly explain a major reason why the Central Limit Theorem is useful in statistics.
What is a standard score? How do you find the standard score for a particular data value?
Discuss personal experiences with the SAT among your classmates. Based on these personal experiences, what do you think the SAT is measuring? Do you think the test is a reasonable way to predict students’ performance in college? Why or why not?
What does the area under the normal distribution curve represent? What is the total area under the normal distribution curve?
What is the Central Limit Theorem? When does it apply?
For a normal distribution, approximately what fraction of data values lie more than 1 standard deviation above the mean? When might data values be considered unusual? Explain.
Notice that scores for males have been consistently higher than scores for females. Why do you think this is the case?Do you think that changes in the education system could eliminate this gap? Defend your opinions.
Showing 800 - 900
of 1156
1
2
3
4
5
6
7
8
9
10
11
12
Step by Step Answers