New Semester
Started
Get
50% OFF
Study Help!
--h --m --s
Claim Now
Question Answers
Textbooks
Find textbooks, questions and answers
Oops, something went wrong!
Change your search query and then try again
S
Books
FREE
Study Help
Expert Questions
Accounting
General Management
Mathematics
Finance
Organizational Behaviour
Law
Physics
Operating System
Management Leadership
Sociology
Programming
Marketing
Database
Computer Network
Economics
Textbooks Solutions
Accounting
Managerial Accounting
Management Leadership
Cost Accounting
Statistics
Business Law
Corporate Finance
Finance
Economics
Auditing
Tutors
Online Tutors
Find a Tutor
Hire a Tutor
Become a Tutor
AI Tutor
AI Study Planner
NEW
Sell Books
Search
Search
Sign In
Register
study help
sciences
statistical reasoning for everyday life
Statistical Reasoning For Everyday Life 5th Edition Jeff Bennett, William Briggs, Mario Triola - Solutions
Look back at the six guidelines for establishing causality. Discuss whether or how each guideline is met by current data on and understanding of global warming.
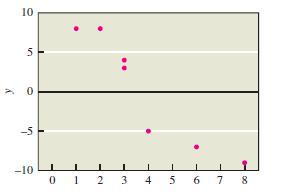
Refer again to the scatterplot in Figure 7.24. Does there appear to be a significant correlation between the two variables?Figure 7.24 10 -5 -10 0 1 7. 2 3 4 5 6 8
Fill in the blank: If r = 0.900, then _____ % of the variation in the response variable y can be explained by the linear relationship between x and y as described by the best-fit line
The data barely deviate at all from the best-fit line, and they produce this value for the square of the correlation coefficient: r2 = 0.3.Does It Make Sense? For Exercises, determine whether the statement makes sense (or is clearly true) or does not make sense (or is clearly false). Explain
If a scatterplot shows no correlation, then there cannot be any relationship between the two variables.
Does It Make Sense? For Exercises, determine whether the statement makes sense (or is clearly true) or does not make sense (or is clearly false). Explain clearly. Not all of these statements have definitive answers, so your explanation is more important than your chosen answer.I selected three
Have you ever helped a child learn to read? Compare your experiences with those of other classmates who have worked with young children.
I used a best-fit line for data showing the ages and heights of thousands of boys of various ages to predict the mean height of 9-year-old boys.Does It Make Sense? For Exercises, determine whether the statement makes sense (or is clearly true) or does not make sense (or is clearly false). Explain
I created a scatterplot of CEO salaries and corporate revenue for 10 companies and found a negative correlation, but when I left out a data point for a company whose CEO took no salary, there was no correlation for the remaining data.
How does the sample size affect how close to normal a distribution of either sample means or sample proportions will be? What are the means and standard deviations of the distributions in each case?
Have you ever helped a child learn to read? Compare your experiences with those of other classmates who have worked with young children.
Estimate the correlation coefficient for the data points in the scatterplot in Figure 7.24.Figure 7.24 10 -5 -10 0 1 3 4 5 6 7 8 2.
What is multiple regression? When is it useful?
If a correlation is very strong, can we conclude that one variable causes a change in the other variable? Why or why not?
What is a sample mean? What is a sample proportion? Summarize the notation used for these statistics.
Currently, the NAEP tests are given to only a few thousand of the millions of school children in the United States. Some people advocate giving similar tests to all students, on either a voluntary or a mandatory basis. Do you think such “standardized national testing” is a good idea? Why or why
What does the square of the correlation coefficient, r2, tell us about a best-fit line?
What are the three possible explanations for a correlation?
What is a sampling error? How does it differ from other sources of error? In general, how does the sampling error increase or decrease with larger sample sizes? Explain.
Do you think that standardized tests like those administered by the NAEP are valid ways to measure academic achievement? Why or why not?
Which of the following are likely to have a correlation?a. Amounts donated to charities in a year and annual incomesb. Hat sizes and annual incomes of randomly selected adultsc. Braking reaction times and weights of randomly selected adultsd. Height and arm span of randomly selected subjectse.
Briefly list five important cautions to keep in mind when making predictions with bestfit lines.
Briefly explain how data that actually come from two distinct groups, both with strong correlations, can appear uncorrelated when grouped together. Does this mean that you should always break data into as many subgroups as possible? Why or why not?
Distinguish between the distribution of sample means and distribution of sample proportions.
One result of the NAEP reading tests is that students in private schools tend to score significantly higher than students in public schools. Does this imply that private schools are “better” than public schools? Defend your opinion.
What is a best-fit line? How is a best-fit line useful?
Briefly explain how an outlier can make it appear that there is a correlation when there is none. Also briefly explain how an outlier can make it appear that there is no correlation when there is one. Under what circumstance is it reasonable to ignore outliers when studying correlations?
Find a news article or research report that cites or makes use of a probability distribution. Provide a one-paragraph discussion.
Find a news article or research report that refers to a subjective probability. Provide a one-paragraph discussion.
Find a news article or research report that makes use of a relative frequency (or empirical) probability. Provide a one-paragraph discussion.
Find a news article or research report that cites a theoretical probability. Provide a one-paragraph discussion.
Suppose you want to conduct a survey involving a sensitive question that not all participants may choose to answer honestly (for example, a question involving cheating on taxes or drug use). Here is a way to conduct the survey and protect the identity of respondents. We will assume that the
Toss three coins at once 50 times and record the outcomes in terms of the number of heads. Based on your observations, give the relative frequency probabilities of the outcomes. Do they agree with the theoretical probabilities? Explain and discuss your results.
Find a standard thumb tack and practice tossing it onto a flat surface. Notice that there are two different outcomes: The tack can land point down or point up.a. Toss the tack 50 times and record the outcomes.b. Give the relative frequency probabilities of the two outcomes based on these results.c.
Using current data from a website, construct a table showing the probability of meeting a male or a female in each of these age categories: 0–5, 6–10, 11–20, 21–30,31–40, 41–50, 51–60, 61–70, 71–80, over 80.
After constructing a table that is similar to Table 6.2 and shows all possible outcomes of tossing four coins at once, find the following.a. Find the probability that all four tosses are the same (all heads or all tails).b. Find the probability that the four tosses are not all the same.c. What is
Find a recent news report that gives current data about vital statistics or life expectancy. Summarize the report and the statistics, and discuss any personal or social implications of the new data.
Find a recent news article discussing some aspect of travel safety (such as risk of accidents in automobiles or airplanes, the efficacy of child car seats, or the effects of talking on a cell phone while driving). Summarize any given statistics about risks, and give your overall opinion regarding
Halfway through the season, a basketball player has made 72% of her free throws. What is the probability that her next free throw will be successful?Relative Frequency Probabilities. Use the relative frequency method to estimate the probabilities in Exercises.
The book Against the Gods: The Remarkable Story of Risk by Peter Bernstein (John Wiley, 1996) is an award-winning account of the history of probability and risk assessment. Find the book in a library or bookstore (it’s a worthwhile purchase), and identify a particular event that changed our
What is the probability of a 100-year flood happening this year?Relative Frequency Probabilities. Use the relative frequency method to estimate the probabilities in Exercises.
The Royal Statistical Society (headquartered in London) has proposed a system of risk magnitudes and risk factors analogous to the Richter scale for measuring earthquakes. Go to the Internet to learn how these measures of risk are defined and computed. Using these measures, discuss the risks of
After recording the forecasts of your local meteorologist for 30 days, you conclude that she gave a correct forecast for 26 days. What is the probability that her next forecast will be correct?Relative Frequency Probabilities. Use the relative frequency method to estimate the probabilities in
You will find many life expectancy calculators available on the Internet; try a few of them. Do they seem to give accurate or realistic results? Explore the statistical techniques that are used to make life expectancy tables.
Suppose you randomly select a family with four children. Assume that births of boys and girls are equally likely.a. How many birth orders are possible? List them in a probability distribution table.b. What is the probability that the family has four children of the same gender?c. What is the
A columnist for the New York Daily News (Stephen Allensworth) provided tips for selecting numbers in New York State’s lottery.He advocated a system based on the use of “cold digits,” which are digits that hit once or not at all in a seven-day period. He made this statement: “That [system]
Find data regarding life expectancies in Uganda over the past few decades. You will see that Ugandan life expectancy has risen dramatically in the past decade. What explains this rise, and what lessons might it have for improving life expectancy in other African nations?
Find data about how and why male and female life expectancies are changing with time. Why do women have longer life expectancies than men? Should we expect male life expectancies to catch up with female life expectancies in the future? Summarize your findings with a short report.
The New England College of Medicine uses an admissions test with many multiple-choice questions, each with five possible answers, only one of which is correct. If you guess randomly on every question, what score might you expect to get? (Express the answer as a percentage.)
You can find a great deal of data on the Web about life expectancies around the world. How does U.S. life expectancy compare to life expectancy in other developed countries? What might explain the differences you see? Based on your findings, discuss potential implications for social or government
A bag contains 13 red M&Ms, 25 orange M&Ms, 8 yellow M&Ms, 8 brown M&Ms, 27 blue M&Ms, and 19 green M&Ms. When randomly selecting one M&M, what is the probability of drawing a red M&M? A blue M&M? A yellow M&M? An M&M that is not orange?Theoretical
What would the life expectancy for men be in 2100? Do you think this calculation gives a more or less realistic estimate of life expectancy in 2100 than was found in Example 5? Explain.
What is the probability of not buying a defective smartphone when quality control surveys indicate that 2% of all smartphones purchased are defective?Complementary Events. Exercises involve complementary events. In each exercise, find the probability of the given event. State any assumptions that
Describe an incident in your own life that did not meet your expectation, defied the odds, or seemed unlikely to have occurred by chance. Would you call this incident statistically significant? To what did you attribute the event?
What would the life expectancy for women be in 2100? Do you think this calculation gives a more or less realistic estimate of life expectancy in 2100 than was found in Example 5? Explain.
What is the probability of randomly selecting a person and getting someone who does not have type O blood, given that 45% of people have type O blood?Complementary Events. Exercises involve complementary events. In each exercise, find the probability of the given event. State any assumptions that
Find a recent news story about a statistical study that used an experiment to determine whether some new treatment was effective. Based on the available information, briefly discuss what you can conclude about the statistical significance of the results. Given this significance (or lack thereof),
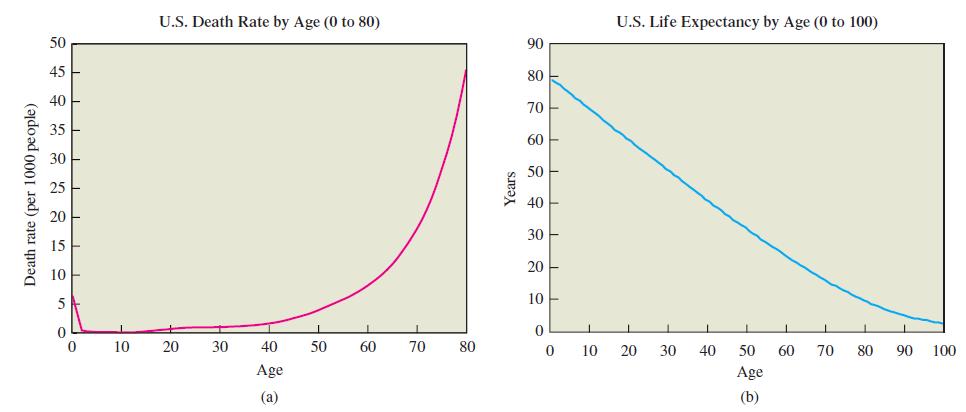
Estimate the death rate for 25-year-olds. If the population of people this age is 42 million, how many people of this age can be expected to die in a year?Mortality Rates. For Exercise, use the graphs in Figure 6.13 to answer the following questions.Figure 6.13 U.S. Death Rate by Age (0 to 80) U.S.
Based on current life expectancy data, to what age is the average 80-year-old expected to live?Life in This Century. Example 5 assumed that the life expectancy between 2000 and 2100 would increase by the same absolute amount as it did between 1900 and 2000. For women, life expectancy in the 20th
What is the probability of finding that the next President of the United States was not born on Saturday?Complementary Events. Exercises involve complementary events. In each exercise, find the probability of the given event. State any assumptions that you use.
Find a recent newspaper article on a statistical study in which the idea of statistical significance is used. Write a one-page summary of the study and the result that is considered to be statistically significant. Also include a brief discussion of whether you believe the result, given its
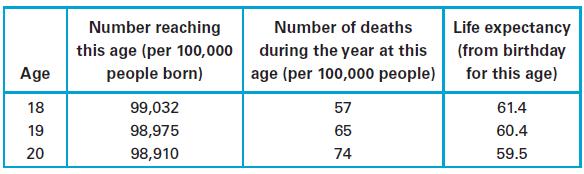
Find the death rate of 19-year-olds per 100,000 people during the year. How many 19-year-olds would be expected to die out of 10,000 people?Vital Statistics. For Exercise, use the data in the following table, which consists of some vital statistics for people in the United States aged years. Number
Describe a situation you know of in which someone lost nearly everything through gambling. Did his or her strategy appear to be rational, or did it appear to be the result of a destructive addiction?
What is the probability that a 75% free throw the shooter will miss her next free throw?Complementary Events. Exercises involve complementary events. In each exercise, find the probability of the given event. State any assumptions that you use.
Using an almanac or the Internet, find the lengths of the principal rivers of the world. Construct a list of the leading digits only. Does any particular digit occur more often than the others? Does that digit occur significantly more often? Explain.
What is the probability of randomly selecting a day of the week and not picking a day whose name includes the letter “t”?Complementary Events. Exercises involve complementary events. In each exercise, find the probability of the given event. State any assumptions that you use.
Find advertisements for your state lottery (or Powerball). Do the advertisements give a fair assessment of the probabilities did you find in Question 3? Do they seem deceptive in any way? Explain.
Finding that the next baby born to a couple is a girl, given that the couple already has two children and they are both boysTheoretical Probabilities. For Exercises, use the theoretical method to determine the probability of the given outcome or event. State any assumptions that you need to
Compare the death rates per 1000 people for California and the United States.
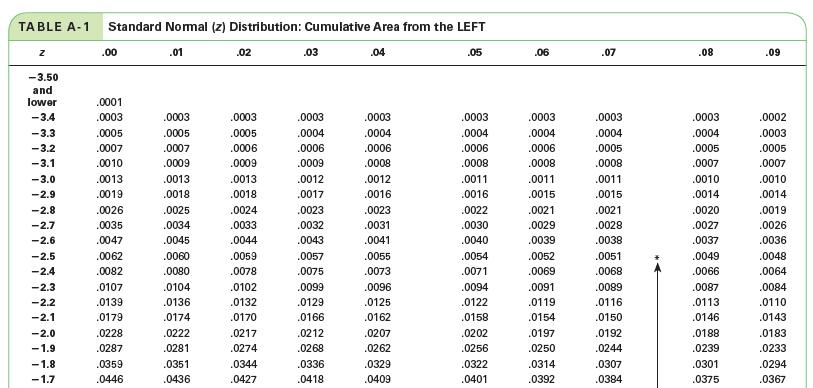
Based on data from the College Board, SAT scores on the Math Level 1 test are normally distributed with a mean of 621 and a standard deviation of 96.a. Find the percentage of scores greater than 600.b. Find the percentage of scores less than 700.c. Find the percentage of scores between 550 and 650.
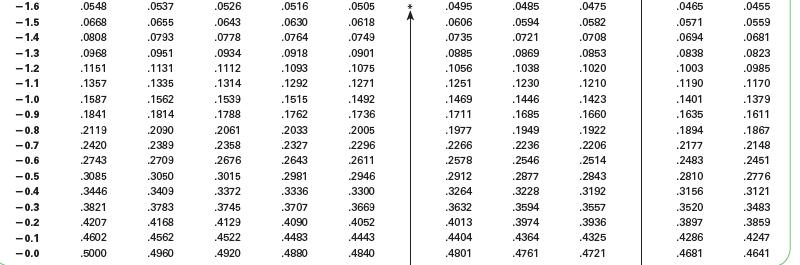
Percentage of scores less than 91IQ Scores. For Exercises, sketch the normal distribution of IQ scores, which has a mean of 100 and a standard deviation of 15, then shade the described area. Use Table A-1 to find the indicated quantities.Table A-1 TABLE A-1 Standard Normal (z) Distribution:
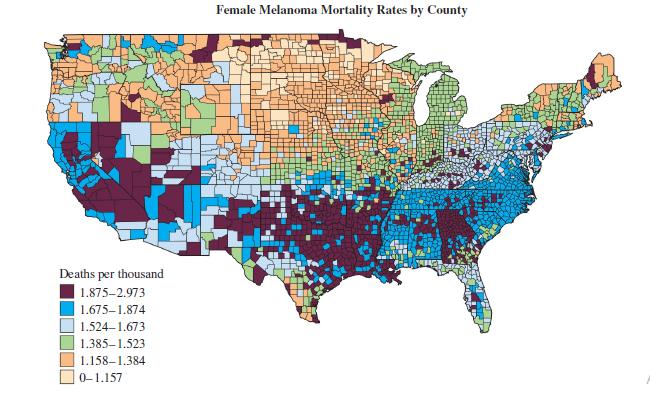
Are there any locations that stand out as unusual and that might therefore warrant special study? ExplainMelanoma Mortality. For Exercises, refer to Figure 3.26, which shows the female mortality rates from melanoma (a form of skin cancer) across the counties of the United States. Female Melanoma
Are there any locations that stand out as unusual and that might therefore warrant special study? ExplainMelanoma Mortality. For Exercises, refer to Figure 3.26, which shows the female mortality rates from melanoma (a form of skin cancer) across the counties of the United States. Female Melanoma
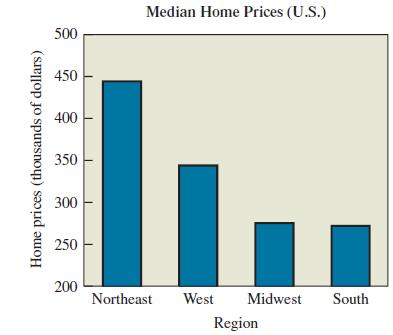
Figure 3.35 shows the median home prices in regions of the United States. How is the graph misleading? How could it be drawn so that it is not misleading? Median Home Prices (U.S.) 500 450 400 350 300 250 200 Northeast West Midwest South Region Home prices (thousands of dollars)
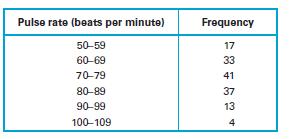
What are the lowest and highest possible pulse rates that could be included in the frequency table?Most Appropriate Display. Exercises describe data sets but do not give actual data. For each data set, describe the data as qualitative or quantitative, and then state the type of graphic that you
A statistics professor with too much time on his hands weighed each M&M candy in a bag of 465 plain M&M candies.a. One of the 465 M&Ms weighed 0.776 gram and it was heavier than 25 of the other M&Ms. What is the percentile of this particular value?b. One of the 465 M&Ms weighed
Births at a hospital in New York State occurred on the different days of the week (in the order Monday through Sunday) with these frequencies: 52, 66, 72, 57, 57, 43, 53. Construct a frequency table with a column for relative frequencies given as percentages. Do the data seem reasonable?
Births at a hospital in New York State occurred on the different days of the week (in the order Monday through Sunday) with these frequencies: 52, 66, 72, 57, 57, 43, 53. Construct a frequency table with a column for relative frequencies given as percentages. Do the data seem reasonable?
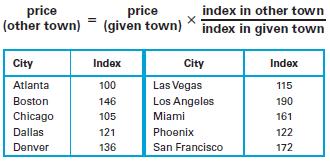
If a house is valued at $940,000 in Los Angeles, find the price of a comparable house in Chicago.Housing Price Index. Realtors use an index to compare housing prices in major cities. The index numbers for several cities are given in the table below. In Exercises, use the following to find the price
A quality control engineer wants to draw attention to the car parts that require repair most often, so she uses a Pareto chart to illustrate the frequencies of repairs for the various car parts.Does It Make Sense? For Exercises, determine whether the statement makes sense (or is clearly true) or
In a KRC Research poll of 1002 subjects, 53% said that they felt vulnerable to identity theft.
If a house is valued at $940,000 in Chicago, find the price of a comparable house in Los Angeles.Housing Price Index. Realtors use an index to compare housing prices in major cities. The index numbers for several cities are given in the table below. In Exercises, use the following to find the price
The speeds of commercial aircraft in the air at any one point in time.Discrete or Continuous. In Exercises, state whether the data described are discrete or continuous, and explain why.
In a Taylor Nelson Sofres Research survey of 703 workers, 61% of them said that they got their jobs through networking.
Twenty-five people, including yourself, are to measure the length of a room to the nearest tenth of a millimeter. Assume that everyone uses the same well-calibrated measuring device, such as a tape measure.a. All 25 measurements are not likely to be exactly the same; some will be higher than the
Number of commercial aircraft in the air at any point in time.Discrete or Continuous. In Exercises, state whether the data described are discrete or continuous, and explain why.
The bakery menu claims that there are 12 doughnuts in a bag, but the baker always puts 13 doughnuts (the true value) in each bag.
The times (years) it takes college students to earn a bachelor’s degree, such as 4 years, 412 years, 5 years, and so on.Discrete or Continuous. In Exercises, state whether the data described are discrete or continuous, and explain why.
The exact times required by students to reach their first class.Discrete or Continuous. In Exercises, state whether the data described are discrete or continuous, and explain why.
Last year, France had 82 million international tourists. The United States had 63 million international tourists.Relative Change. Exercises each provide two values. For each pair of values, use a percentage to express their relative change or difference. Use the second given value as the reference
The official distance for a marathon is 26 miles 385 yards, or 26.21875 miles, but the organizers of a marathon map a course that is actually 26.34567 miles in length.
The arrival delay times recorded for a random sample of flights from New York to Chicago.Discrete or Continuous. In Exercises, state whether the data described are discrete or continuous, and explain why.
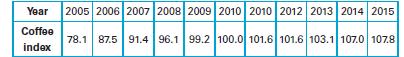
If you spent $3.19 for a pound of coffee in 2006, what would the price have been in 2012?Coffee Index. In Exercises, use the following table of index numbers based on the price of a pound of coffee. The index numbers use 2010 as the base year Year Coffee index 2005 2006 2007 2008 2009 2010 2010
Chicago’s O’Hare Airport handled 67 million passengers last year. The busiest airport in the world, Atlanta’s Hartsfield Airport, handled 95 million passengers last year. Relative Change. Exercises each provide two values. For each pair of values, use a percentage to express
You receive a Visa credit card bill for $512.50, but it includes a charge of $8.00 that was not valid. (That is, the true credit card bill should be $8.00 less than the bill claims.)
The number of likes for a specific post on FacebookDiscrete or Continuous. In Exercises, state whether the data described are discrete or continuous, and explain why.
Last month, 34,781 Toyota Camry cars were sold, and there were 10,096 Ford Mustangs sold.Relative Change. Exercises each provide two values. For each pair of values, use a percentage to express their relative change or difference. Use the second given value as the reference value, and express
The accuracy of gas pumps is routinely measured by government agencies that collect samples using measuring devices known to be accurate.
If you spent $5.62 for a pound of coffee in 2012, what would the price have been in 2007?Coffee Index. In Exercises, use the following table of index numbers based on the price of a pound of coffee. The index numbers use 2010 as the base year Year 2005 2006 2007 2008 2009 2010 2010 2012 2013 2014
If you spent $2.90 for a pound of coffee in 2005, what would the price have been in 2015?Coffee Index. In Exercises, use the following table of index numbers based on the price of a pound of coffee. The index numbers use 2010 as the base year Year 2005 2006 2007 2008 2009 2010 2010 2012 2013 2014
Showing 300 - 400
of 1156
1
2
3
4
5
6
7
8
9
10
11
12
Step by Step Answers