New Semester
Started
Get
50% OFF
Study Help!
--h --m --s
Claim Now
Question Answers
Textbooks
Find textbooks, questions and answers
Oops, something went wrong!
Change your search query and then try again
S
Books
FREE
Study Help
Expert Questions
Accounting
General Management
Mathematics
Finance
Organizational Behaviour
Law
Physics
Operating System
Management Leadership
Sociology
Programming
Marketing
Database
Computer Network
Economics
Textbooks Solutions
Accounting
Managerial Accounting
Management Leadership
Cost Accounting
Statistics
Business Law
Corporate Finance
Finance
Economics
Auditing
Tutors
Online Tutors
Find a Tutor
Hire a Tutor
Become a Tutor
AI Tutor
AI Study Planner
NEW
Sell Books
Search
Search
Sign In
Register
study help
mathematics
statistics
Introduction To Business Statistics 7th Edition Ronald M. Weiers - Solutions
In the 2009 stress tests applied to the nation€™s biggest banks, the U.S. government determined that 10 of them needed a greater cushion of capital in order to absorb losses in a worst-case economic scenario. The banks, the bailout they received, and the additional cushion they were deemed to
For a sample of 100 employees, a personnel director has collected data on x = the number of years an employee has been with the firm and y = the number of shares of company stock the employee owns. The data are in file a. Generate a scatter diagram that includes the best-fit linear equation for
A rental management executive has collected data on square footage and monthly rental fee for 80 apartments in her city. The data are in file XR02045. Considering square footage as the independent variable and monthly rental fee as the dependent variable: a. Generate a scatter diagram that includes
When variables are used as the basis for a contingency table, what scale of measurement must they represent?
Differentiate between simple tabulation and crosstabulation, and give a real or hypothetical example of each.
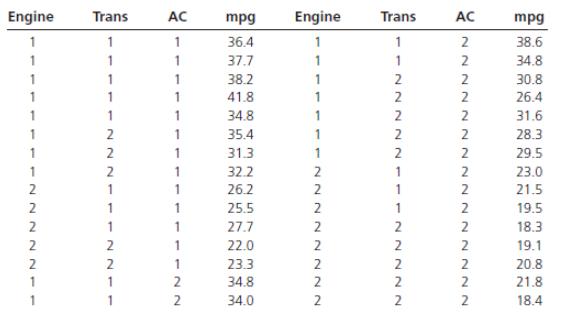
The 30 vehicles operated by a taxi service have been listed according to their engine (1 = diesel, 2 = gasoline), transmission (1 = manual, 2 = automatic), and whether they have air conditioning (1 = no air conditioning, 2 = air conditioning). These characteristics, along with the miles per gallon
For the fleet described in Exercise 2.48,a. Construct a simple tabulation in which the counts are according to the type of engine.b. Construct a cross-tabulation describing the fleet, using type of engine and whether the vehicle has air conditioning as the categorization variables.c. Construct a
The National Center for Health Statistics reports the following age breakdown of deaths in the United States during 2006. Source: The New York Times Almanac 2009, p. 392. Age (Years) Number of Deaths (Thousands) under 15............... 39.80 15–under 25 ..............34.23 25–under 35
For the fleet described in Exercise 2.48,a. Construct a simple tabulation in which the counts are according to the type of trans mission.b. Construct a cross-tabulation describing the fleet, using type of transmission and whether the vehicle has air conditioning as the categorization variables.c.
A high school guidance counselor has examined the 60 colleges and universities that are on her “highly recommended” list for her school’s graduating seniors. The data she has collected on each college or university include highest degree level offered (1 = bachelor’s, 2 = master’s, 3 =
For the schools described in Exercise 2.51,a. Construct a simple tabulation in which the counts are according to the type of campus setting.b. Construct a cross-tabulation describing the schools, using the type of campus setting and whether the school is public or private as the categorization
An interdisciplinary research team has examined 35 U.S. cities, reviewing and grading each according to the following performance areas: financial management, capital projects, personnel policies, information technology, and managing for results .a The grades awarded were letter grades such as
For the cities described in Exercise 2.53,a. Construct a simple tabulation in which the counts are according to the grade on personnel policies.b. Construct a cross-tabulation describing the cities, using the grade on personnel policies and the grade on managing for results as the categorization
The breakdown of U.S. cities having a population of at least 10,000 persons has been reported as follows.a. How many cities have a population of at least 25,000 but less than 500,000?b. How many cities have a population less than 250,000?c. How many cities have a population of at least 100,000 but
The National Oceanic and Atmospheric Administration reports the following record high temperatures (degrees Fahrenheit) in 50 U.S. cities. These data are also provided in the file XR02056.a. Construct a stem-and-leaf display for these data.b. Construct a frequency distribution.c. Determine the
The average daily cost to community hospitals for patient stays during 2006 for each of the 50 U.S. states was as follows:These data are also provided in the file XR02057.a. Construct a stem-and-leaf display for these data.b. Construct a frequency distribution.c. Determine the interval width and
In 2007, unemployment rates in the 50 U.S. states were reported as follows. These data are also provided in the f le XR02058.a. Construct a stem-and-leaf display for these data.b. Construct a frequency distribution for these data.c. Determine the interval width and the class mark for each of the
During 2007, sales of new, privately owned homes in the total United States and in the western states were broken down into price categories as follows:Convert these data to relative frequency distributions, one for the total United States, the other for the western states. Do the results appear to
Using the frequency distribution in Exercise 2.5, identify the following for the 15–under 25 class: (a) Frequency, (b) Upper and lower limits, (c) Width, and (d) Midpoint.
The following stem-and-leaf output has been generated by Minitab. The data consist of two-digit integers.a. From this display, is it possible to determine the exact values in the original data? If so, list the data values. If not, provide a set of data that could have led to this display. b.
The following stem-and-leaf output has been generated by Minitab. The data consist of three-digit integers.a. From this display, is it possible to determine the exact values in the original data? If so, list the data values. If not, provide a set of data that could have led to this display. b.
For the period 2001€“2008, the Bristol-Myers Squibb Company, Inc. reported the following amounts (in billions of dollars) for (1) net sales and (2) advertising and product promotion. The data are also in the file XR02062.For these data, construct a line graph that shows both net sales and
If possible with your statistical software, construct a dotplot for the data of Exercise 2.56 (use data file XR02056). Are there any cities for which the record high temperature is so high that it would appear to be an outlier? If so, which one(s)?Exercise no .56
If possible with your statistical software, construct a dotplot for the data of Exercise 2.57 (use data file XR02057). Are there any states for which the average daily cost was so high that it would appear to be an outlier? If so, which one(s)?Exercise no 2.57
If possible with your statistical software, use the dotplot method to compare the 50-state unemployment rates in 1980 with those in 2007. Use the same scale for each dotplot, then comment on whether unemployment appears to have changed in terms of its range (highest minus lowest) or in the general
Among the information in its top-50 list of the nation’s law schools, U.S. News & World Report provided two reputation scores (with maximum 5 5.0) for each school: one from academicians, the other from lawyers/ judges. The magazine also provided the most recent acceptance rate (%),
For the law schools discussed in Exercise 2.67, and using the data in fi le XR02067, a. Construct a scatter diagram where the dependent variable is the percentage of graduates who were employed immediately upon graduation, and the independent variable is the reputation score provided by the
The household saving rates (percentage of disposable household income that goes into savings) have been reported for several countries —including the United States, Canada, France, Germany, and Japan—for the years 1980 through 1997. The percentages are listed in data file XR02069. a. Construct
For the nations and household saving rates in Exercise 2.69, and using the data in file XR02069, a. Construct a scatter diagram using the household saving rates in the United States and Germany as the two variables. It doesn’t really matter which one you consider to be the independent variable.
An air-compressor manufacturer purchases mechanical components from two different suppliers (MechSup = 1 or 2) and electrical/motor components from three different suppliers (ElectSup = 1, 2, or 3), with final assembly being carried out by one of two technicians (Tech = 1 or 2). Following
For the situation and data described in Exercise 2.71, and using data file XR02071, a. Construct a simple tabulation in which the counts are according to which company supplied the electrical/ motor components. b. Construct a cross-tabulation describing the 100 compressors tested, using
For commercial banks in each state, the U.S. Federal Deposit Insurance Corporation has listed their total deposits (billions of dollars) as follows. Source: Bureau of the Census,Construct a frequency distribution and a histogram for these data.
The accompanying data describe the hourly wage rates (dollars per hour) for 30 employees of an electronics firm:Construct a frequency distribution and a histogram for these data.
1. Using 10-yard intervals beginning with 200.0€“under 210.0, 210.0€“under 220.0, on up to 290.0€“under 300.0, construct a frequency distribution for the distances traveled by the new ball.2. Using the same intervals as in part 1, construct a frequency distribution for
The major shopping areas in the community of Springdale include Springdale Mall, West Mall, and the downtown area on Main Street. A telephone survey has been conducted to identify strengths and weaknesses of these areas and to find out how they fit into the shopping activities of local residents.
Determine the mean and the median wage rate for the data in Exercise 2.9.In exercise
An observer stands at an overpass and, for each motorcycle that passes below, records the value of x = the number of riders on the motorcycle. a. What value would you anticipate for the mode of her data? Why? b. Would you anticipate that the mean would be greater than or less than the mode? Why? c.
In preparation for upcoming contract negotiations, labor and management representatives of the Hoffer Concrete Company have been collecting data on the earnings of a sample of employees (ranging from the president to the lowest paid “go-fer”) at similar firms. Assuming that such sample data are
For the U.S. News & World Report top-50 U.S. law schools in Exercise 2.67, find the mean and median scores that the schools received from the academic evaluators. Compare these with the mean and median scores awarded by the lawyer/judge evaluators. Does either set of evaluators seem to provide
Each of the 100 air compressors described in Exercise 2.71 was tested to measure the amount of pressure it could exert. Find the mean and the median pressure, and comment on possible skewness of the data. The data are in file XR02071.
A personnel administrator has collected data on 100 employees, including gender, age, and number of days absent during the previous year. Compare the mean and median number of days absent for females (coded as gender = 1) versus males (coded as gender = 2) within the company. The data are in file
For the data in Exercise 3.14, compare the mean and median ages for female employees (gender code = 1) versus male employees (gender code = 2). The data are in file XR03014. Exercise 3.14 Compare the mean and median number of days absent for females (coded as gender = 1) versus males (coded as
For the sample of computer website hits described in Exercise 3.3, determine the range, the mean absolute deviation, the standard deviation, and the variance.Exercise 3.3According to the hit counter that records daily visitors to her site, the numbers of visits during the past 20 days have been as
For the sample of Saturday-morning cartoon violence counts described in Exercise 3.4, determine the range, the mean absolute deviation, the standard deviation, and the variance.Exercise 3.4A social scientist for a children’s advocacy organization has randomly selected 10 Saturday-morning
During July 2005, the seven most-visited shopping websites (with number of visitors, in millions) were: eBay (61.7), Amazon (42.0), Wal-Mart (22.6), Shopping.com (22.4), Target (20.5), Apple Computer (17.4), and Overstock.com (17.2). Considering these as a population, determine:a. The mean, median,
Using the data in Exercise 2.11, determine the mean and the median number of goals per season that Mr. Gretzky scored during his 20 seasons in the National Hockey League.Exercise no 2.11
For a sample of 11 employers, the most recent hourly wage increases were 18, 30, 25, 5, 7, 2, 20, 12, 15, 55, and 40 cents per hour. For these sample data, determine:a. The mean, median, range, and midrange.b. The mean absolute deviation.c. The standard deviation and variance.
According to the U.S. Environmental Protection Agency, a sample of 10 subcompact models shows the following estimated values for highway fuel economy (mpg): 40, 33, 32, 30, 27, 29, 27, 23, 21, and 10. For these sample data, determine:a. The mean, median, range, and midrange.b. The mean absolute
For a sample of eight apartment buildings in Chicago, the percentage-occupancy rates during a recent month were as shown below:For these sample data, determine:a. The mean, median, range, and midrange.b. The mean absolute deviation.c. The standard deviation and variance.
Determine the first, second, and third quartiles for the data in Exercise 3.20; then calculate the interquartile range and the quartile deviation.Exercise 3.20For a sample of 11 employers, the most recent hourly wage increases were 18, 30, 25, 5, 7, 2, 20, 12, 15, 55, and 40 cents per hour. For
Determine the first, second, and third quartiles for the data in Exercise 3.21; then calculate the interquartile range and the quartile deviation.Exercise 3.21According to the U.S. Environmental Protection Agency, a sample of 10 subcompact models shows the following estimated values for highway
During the 1999 holiday shopping season, Keynote Systems, Inc. visited a number of e-commerce websites to see how long it took for the site to come up on the PC of a consumer using a 56K modem. The average time for Walmart.com was 23.35 seconds. Under the assumption that the company visited
Data file XR03014 includes the number of absences from work for a sample of 100 employees. For the variable representing number of days absent, determine and interpret the following: a. The mean, median, range, and midrange. b. The mean absolute deviation. c. The standard deviation and variance.
Data file XR02028 shows the depths (in meters) that 80 water-resistant watches were able to withstand just before leakage. For the watches in this sample, determine and interpret the following: a. The mean, median, range, and midrange. b. The mean absolute deviation. c. The standard deviation and
A manufacturing firm has collected information on the number of defects produced each day for the past 50 days. The data have been described by the accompanying Minitab box-and-whisker plot. a. What is the approximate value of the median? The first and third quartiles? b. What do the asterisks (*)
According to Chebyshev€™s theorem, what per centage of observations should falla. Within 2.5 standard deviations of the mean?b. Within 3.0 standard deviations of the mean?c. Within 5.0 standard deviations of the mean?
Erika operates a website devoted to providing information and support for persons who are interested in organic gardening. According to the hit counter that records daily visitors to her site, the numbers of visits during the past 20 days have been as follows: 65, 36, 52, 70, 37, 55, 63, 59, 68,
For the data in Exercise 3.20, determine the percentage of observations that fall within k = 1.5 standard deviation units from the mean. Do the results support Chebyshev’s theorem? In Exercise For a sample of 11 employers, the most recent hourly wage increases were 18, 30, 25, 5, 7, 2, 20, 12,
Standardize the data in Exercise 3.21, then identify the percentage of observations that fall within k = 2.0 standard deviation units from the mean. Do the results support Chebyshev’s theorem?Exercise 3.21According to the U.S. Environmental Protection Agency, a sample of 10 subcompact models
The manufacturer of an extended-life lightbulb claims the bulb has an average life of 12,000 hours, with a standard deviation of 500 hours. If the distribution is bell shaped and symmetrical, what is the approximate percentage of these bulbs that will last a. between 11,000 and 13,000 hours? b.
For college-bound high school seniors from a certain midwestern city, math scores on the Scholastic Aptitude Test (SAT) averaged 480, with a standard deviation of 100. Assume that the distribution of math scores is bell shaped and symmetrical. a. What is the approximate percentage of scores that
For data set A, the mean is $1235, with a standard deviation of $140. For data set B, the mean is 15.7 inches, with a standard deviation of 1.87 inches. Which of these two data sets has the greater relative dispersion?
A sample of 20 customers from Barnsboro National Bank reveals an average savings account balance of $315, with a standard deviation of $87. A sample of 25 customers from Wellington Savings and Loan reveals anaverage savings account balance of $8350, with a standard deviation of $1800. Which of
A resort catering to golfers has reported the average income of golfer households to be $95,000. Assume that this average had been based on the 100 incomes in file XR03036. a. Construct and interpret the box-and-whisker plot for the data. b. Standardize the data; then determine the mean and
In Exercise 3.14, the personnel director has collected data describing 100 employees, with one of the variables being the number of absences during the past year. Using data file XR03014, describe the variable, number of absences.a. Construct and interpret the box-and-whisker plot for the number of
Exercise 3.25 described a study in which e-commerce researchers visited walmart.com on multiple occasions during the holiday shopping season and measured the time (in seconds) it took for the site to come up on the computer screen. Data file XR03025 contains results that we assumed could have been
Using the data in Exercise 3.5, construct a frequency distribution.a. Determine the approximate values of the mean and standard deviation.b. Compare the approximate values from part (a) with the actual values.c. Construct a frequency distribution with twice as many classes as before, then repeat
A social scientist for a children’s advocacy organization has randomly selected 10 Saturday-morning television cartoon shows and carried out a content analysis in which he counts the number of incidents of verbal or physical violence in each. For the 10 cartoons examined, the counts were as
A sample consisting of 100 employees has been given a manual-dexterity test. Given the accompanying frequency distribution, determine the approximate mean and standard deviation for these data.Data for Exercise 3.40Score Number of Persons5–under 15........... 715–under 25........... 925–under
Eighty packages have been randomly selected from a frozen food warehouse, and the age (in weeks) of each package is identified. Given the frequency distribution shown, determine the approximate mean and standard deviation for the ages of the packages in the warehouse inventory.Data for Exercise
In Exercise 3.14, two of the variables examined by the personnel director were age and number of absences during the past year. Using the data in file XR03014, generate a scatter diagram (with y = number of absences and x = age), fit a linear equation to the data, then determine and interpret the
In the U.S. News & World Report top-50 U.S. law schools in Exercise 2.67, the listing for each school included two rating scores: one from academic evaluators and another from lawyer/judge evaluators. Using the data in file XR02067, generate a scatter diagram with axes of your choice, fit a linear
The U.S. National Center for Health Statistics has compiled data on death rates (deaths per 100,000 people) from heart disease and cancer for the 50 states. The states and their respective death rates from these two diseases are provided in data file XR03046. Generate a scatter diagram with axes of
A report on the average price of a sample of brand-name prescription drugs with their generic equivalents has found the generics to be considerably cheaper. The drugs and the average prices for their brand-name versus generic versions are listed in data file XR03047. Generate a scatter diagram with
The first seven customers of the day at a small donut shop have checks of $1.25, $2.36, $2.50, $2.15, $4.55, $1.10, and $0.95, respectively. Based on the number of customers served each day, the manager of the shop claims that the shop needs an average check of $1.75 per person to stay profitable.
A dental supplies distributor ships a customer 50 boxes of product A, 30 boxes of B, 60 boxes of C, and 20 boxes of D. The unit shipping costs (dollars per box) for the four products are $5, $2, $4, and $10, respectively. What is the weighted mean for shipping cost per unit?A computer and
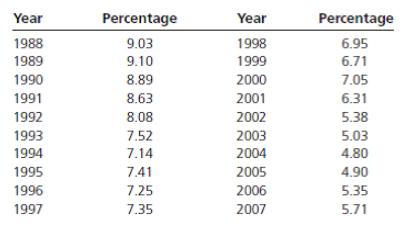
For 1988 through 2007, the net rate of investment income for U.S. life insurance companies was as follows. What was the mean net rate of investment income for this period? The median?
The 2007 top-grossing feature film was Spiderman 3, a product that brought in $336.5 million at the box office. The gross receipts for this and the rest of the top- 20 feature films of that year are shown below. Determine the mean and median for these data. Is there a mode? If so, what is its
According to Honda Motor Co., Inc., the exchange rate (yen per U.S. dollar) from 1998 through 2005 was 123, 128, 112, 111, 125, 122, 113, and 108. Determine the mean and median for these data. Is there a mode? If so, what is its numerical value?A computer and statistical software will be desirable
Natural History magazine has published a listing of the maximum speeds (in mph) for a wide variety of animals, including those shown in the table.a. Determine the mean and the median for these data.b. Is there a mode? If so, what is its numerical value?A computer and statistical software will be
The cafeteria manager at a manufacturing plant has kept track of the number of cups of coffee purchased during each of the past 90 working days.a. Using the following descriptive statistics, construct a box-and-whisker plot for the data. Does the distribution appear to be symmetrical? If not, is it
A grocery store owner has found that a sample of customers purchased an average of 3.0 pounds of luncheon meats in the past week, with a sample standard deviation of 0.5 lb.a. If the store€™s meat scale is off by 0.1 lb (e.g., a purchase listed as 1 lb actually weighs 1.1 lb), what will be the
For a sample of five different years from the period 1960 through 2007, it is found that U.S. work stoppages involving at least 1000 workers occurred 268 times in one of these years, with 424, 235, 145, and 44 work stoppages in the other four.a. Determine the mean, median, range, and midrange.b.
A quality control supervisor has taken a sample of 16 bolts from the output of a thread-cutting machine and tested their tensile strengths. The results, in tons of force required for breakage, are as follows:a. Determine the mean, median, range, and midrange.b. Calculate the mean absolute
The accompanying box-and-whisker plot represents the number of gallons of water used by 80 households over a 1-day period. Determine the approximate values for the median, the first and third quartiles, and the range. Does the distribution appear to be skewed? If so, is it positively skewed or
A testing firm has measured the power consumption of 40 dorm-size microwave ovens selected at random from the manufacturer€™s production line. Given the following box-and-whisker plot, determine the approximate values for the median, the first and third quartiles, and the range. Does the
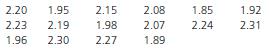
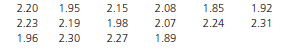
A law enforcement agency, administering breathalyzer tests to a sample of drivers stopped at a New Year€™s Eve roadblock, measured the following blood alcohol levels for the 25 drivers who were stopped:a. Calculate the mean and standard deviation for this sample.b. Use Chebyshev€™s theorem
Use the coefficient of variation to compare the variability of the data in Exercise 3.57 with the variability of the data in Exercise 3.60.A computer and statistical software will be desirable and useful. However, any necessary calculations can also be done with the aid of a pocket calculator. For
Using the frequency distribution in Exercise 3.53, determine the approximate mean and standard deviation for the underlying data.A computer and statistical software will be desirable and useful. However, any necessary calculations can also be done with the aid of a pocket calculator. For readers
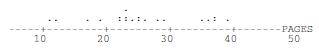
The following dotplot describes the lengths, in pages, of a sample consisting of 20 reports generated by a consulting firm during the past 3 months. Based on the dotplot, what are the values for the median and the first and third quartiles?A computer and statistical software will be desirable and
For the sample data presented in the dotplot of Exercise 3.63, construct a frequency distribution in which the classes are 10€“under 20, 20€“under 30, and 30€“under 40. If this frequency distribution were all that we knew about the underlying data, what approximate values would be
According to the Energy Information Administration, the average U.S. household spends $1196 per year for electricity. Assume that this finding could have been based on the electricity expenditures reported by 250 households,with the data in file XR03065.a. Confirm the mean and determine the median
Bride€™s magazine reports the cost of the average honeymoon as $5111. Assume that their findings could have been based on the honeymoon expenditures of a sample consisting of 300 couples whose costs are listed in data file XR03066.a. Confirm the mean and determine the median and the standard
During 2005, 1,186,000 college-bound high school seniors took the ACT college admission test. The average score on the mathematics component was 20.7, with a standard deviation of 5.0. We are assuming that the math scores in data file XR03067 could have been the math scores for a sample of 400
During 2005, 1,186,000 college-bound high school seniors took the ACT college admission test. The average score on the mathematics component was 20.7, with a standard deviation of 5.0. We are assuming that the math scores in data file XR03067 could have been the math scores for a sample of 400
Data for a sample of college players eligible to enter the National Football League include weight (pounds) and time (seconds) required to sprint 40 yards. Using the data listed in file XR03068, and with weight as the x (indepen dent) variable and time as the y (dependent) variable, generate a
During a five-year period, the Federal Aviation Administration took administrative actions (letters of correction or warning notices) and levied fines against U.S. airline companies for various safety-related reasons. For each airline involved, data file XR03069 lists the number of administrative
A reference book lists the following maximum life spans (in years) for animals in captivity:What is the mean of these maximum life spans? The median?
According to a utility company, utility plant expenditures per employee were approximately $50,845, $43,690, $47,098, $56,121, and $49,369 for the years 2005 through 2009. Employees at the end of each year numbered 4738, 4637, 4540, 4397, and 4026, respectively. Using the annual number of employees
When we last visited the Thorndikes, one of the company€™s engineers had just developed a new golf ball. According to the engineer, the new ball incorporates some changes that may enable it to travel farther than conventional golf balls. The engineer, an avid golfer herself, is very
Showing 30800 - 30900
of 88243
First
302
303
304
305
306
307
308
309
310
311
312
313
314
315
316
Last
Step by Step Answers
.png)
.png)

.png)
-1.png)
-2.png)
-1.png)
-2.png)
.png)
.png)
.png)
.png)
.png)
-1.png)
-2.png)
-1.png)
-2.png)
.png)
.png)
.png)
.png)
.png)
.png)

.png)
.png)
.png)
-1.png)
-2.png)
.png)
-1.png)
-2.png)
-1.png)
-2.png)
.png)
.png)
-1.png)
-2.png)
-1.png)
-2.png)
-1.png)
-2.png)
-1.png)
-2.png)
.png)
.png)
-1.png)
-2.png)
.png)
.png)
.png)
.png)
.png)
.png)
.png)

