New Semester
Started
Get
50% OFF
Study Help!
--h --m --s
Claim Now
Question Answers
Textbooks
Find textbooks, questions and answers
Oops, something went wrong!
Change your search query and then try again
S
Books
FREE
Study Help
Expert Questions
Accounting
General Management
Mathematics
Finance
Organizational Behaviour
Law
Physics
Operating System
Management Leadership
Sociology
Programming
Marketing
Database
Computer Network
Economics
Textbooks Solutions
Accounting
Managerial Accounting
Management Leadership
Cost Accounting
Statistics
Business Law
Corporate Finance
Finance
Economics
Auditing
Tutors
Online Tutors
Find a Tutor
Hire a Tutor
Become a Tutor
AI Tutor
AI Study Planner
NEW
Sell Books
Search
Search
Sign In
Register
study help
mathematics
statistics
Business Analytics Data Analysis And Decision Making 6th Edition S. Christian Albright, Wayne L. Winston - Solutions
Modify the employee scheduling model so that employees are paid $10 per hour on weekdays and $15 per hour on weekends. Change the objective so that you now minimize the weekly payroll. (You can assume that each employee works eight hours per day.) Is the previous optimal solution still optimal?
In the blending model suppose there is a chemical ingredient called C1 that both gasoline and heating oil need. At least 3% of every barrel of gasoline must be C1, and at least 5% of every barrel of heating oil must be C1. Suppose that 4% of all crude oil 1 is C1 and 6% of all crude oil 2 is C1.
A city (labeled C for convenience) is trying to sell municipal bonds to support improvements in recreational facilities and highways. The face values (in thousands of dollars) of the bonds and the due dates (years from now) at which principal comes due are listed in the file P14_104.xlsx. An
In the current version of the blending model, a barrel of any input results in a barrel of output. However, in a real blending problem there can be losses. Suppose a barrel of input results in only a fraction of a barrel of output. Specifically, each barrel of either crude oil used for gasoline
We warned you about clearing denominators in the quality constraints. This problem indicates what happens if you don't do so.a. Implement the quality constraints as indicated in Inequality (14.3). Then run Solver with the simplex method. What happens? What if you run Solver with the GRG nonlinear
In the original Grand Prix example, the total capacity of the three plants is 1550, well above the total customer demand. Would it help to have 100 more units of capacity at plant 1? What is the most Grand Prix would be willing to pay for this extra capacity? Answer the same questions for plant 2
The optimal solution to the original Grand Prix problem indicates that with a unit shipping cost of $132, the route from plant 3 to region 2 is evidently too expensive-no autos are shipped along this route. Use SolverTable to see how much this unit shipping cost would have to be reduced before some
In the RedBrand example, suppose the plants cannot ship to each other and the customers cannot ship to each other. Modify the model appropriately, and rerun Solver. How much does the total cost increase because of these disallowed routes?
Modify the RedBrand example so that all flows must be from plants to warehouses and from warehouses to customers. Disallow all other arcs. How much does this restriction cost RedBrand, relative to the original optimal shipping cost?
In the RedBrand example, the costs for shipping from plants or warehouses to customer 2 were purposely made high so that it would be optimal to ship to customer 1 and then let customer‑1 ship to customer 2. Use SolverTable appropriately to do the following. Decrease the unit shipping costs from
In the RedBrand example the arc capacity is the same for all allowable arcs. Modify the model so that each arc has its own arc capacity. You can make up the arc capacities.
How much influence can the employee requirements for one, two, or three days have on the weekly schedule in the employee scheduling example? You are asked to explore this in the following questions.a. Let Monday's requirements change from 17 to 25 in increments of 1. Use SolverTable to see how the
The RedBrand model in the file RedBrand Logistics Multiple Product Finished.xlsx assumes that the unit shipping costs are the same for both products. Modify the model so that each product has its own unit shipping costs. You can assume that the original unit shipping costs apply to product 1, and
How difficult is it to expand the RedBrand model? Answer this by adding a new plant, two new warehouses, and three new customers, and modify the spreadsheet model appropriately. You can make up the required input data. Would you conclude that these types of spreadsheet models scale easily?
In the RedBrand model in the file RedBrand Logistics Shrinkage Finished.xlsx, change the assumptions. Now instead of assuming that there is some shrinkage at the warehouses, assume that there is shrinkage in delivery along each route. Specifically, assume that a certain percentage of the units sent
In the employee scheduling example, suppose that each full-time employee works eight hours per day. Thus, Monday's requirement of 17 workers can be viewed as a requirement of 8(17) = 136 hours. The post office can meet its daily labor requirements by using both full-time and part-time employees.
In the employee scheduling example, suppose the employees want more flexibility in their schedules. They want to be allowed to work five consecutive days followed by two days off or to work three consecutive days followed by a day off followed by two consecutive days followed by another day off.
In the employee scheduling example, suppose that the company can force employees to work one day of overtime each week on the day immediately following this five-day shift. For example, an employee whose regular shift is Monday to Friday can also be required to work on Saturday. Each employee is
As it currently stands, investment 7 in the Tatham capital budgeting model has the lowest ROI, 10%. Keeping this same ROI, can you change the cash requirement and NPV for investment 7 in such a way that it is selected in the optimal solution? Does this lead to any general insights? Explain.
In the employee scheduling example, suppose the company has 28 full-time employees and is not allowed to fire any of them or hire more. Determine a schedule that maximizes the number of weekend days off received by these employees.
In the electricity pricing model, the demand functions have positive and negative coefficients of prices. The negative coefficients indicate that as the price of a product increases, demand for that product decreases. The positive coefficients indicate that as the price of a product increases,
Use SolverTable in the blending model to see whether, by increasing the selling price of gasoline, you can get ansoptimal solution that produces only gasoline, no heating oil. Then use SolverTable again to see whether, by increasing the selling price of heating oil, you can get an optimal solution
In the electricity pricing model, we assumed that the capacity level is a decision variable. Assume now that capacity has already been set at 0.65 million of mWh . (Note that the cost of capacity is now a sunk cost, so it is irrelevant to the decision problem.) Change the model appropriately and
Use SolverTable in the blending model to find the shadow price of crude oil 1-that is, the amount Chandler would be willing to spend to acquire more crude oil 1. Does this shadow price change as Chandler keeps getting more of crude oil 1? Answer the same questions for crude oil 2.
How sensitive is the optimal blending solution (barrels of each output sold and profit) to the required quality levels? Answer this by running a two-way SolverTable with these three outputs. You can choose the values of the two inputs to vary.
Consider a modification of the RedBrand model where there are N plants, M warehouses, and L customers. Assume that the only allowable arcs are from plants to warehouses and from warehouses to customers. If all such arcs are allowable- all plants can ship to all warehouses and all warehouses can
The employee scheduling model in this chapter was purposely made small (only seven decision variable cells). What would make a similar problem for a company like McDonald's much harder? What types of constraints would be required? How many decision variable cells (approximately) might there be?
Explain why it is problematic to include a constraint such as the following in an LP model for a blending problem:
"It is essential to constrain all shipments in a transportation problem to have integer values to ensure that the optimal LP solution consists entirely of integer-valued shipments." Is this statement true or false? Why?
What is the relationship between transportation models and more general logistics models? Explain how these two types of linear optimization models are similar and how they are different.
Unlike the small logistics models presented here, real-world logistics problems can be huge. Imagine the global problem a company like FedEx faces each day. Describe as well as you can the types of decisions and constraints it has. How large (number of decision variables, number of constraints)
Suppose that you formulate and solve an integer programming model with a cost-minimization objective. Assume that the optimal solution yields an objective cell value of $500,000. Now, consider the same linear optimization model without the integer restrictions. That is, suppose that you drop the
The portfolio optimization model presented here is the standard model: minimize the variance (or standard deviation) of the portfolio, as a measure of risk, for a given required level of expected return. In general, the goal is to keep risk low and expected return high. Can you think of other
Use @RISK's Define Distributions tool to show a uniform distribution from 400 to 750. Then answer the following questions. a. What are the mean and standard deviation of this distribution? b. What are the 5th and 95th percentiles of this distribution? c. What is the probability that a random number
You are making several runs of a simulation model, each with a different value of some decision variable (such as the order quantity in the Walton calendar model), to see which decision value achieves the largest mean profit. Is it possible that one value beats another simply by random luck? What
It is very possible that when you use a correlation matrix as input to the RISKCORRMAT function in an @RISK model, the program will inform you that this is an invalid correlation matrix. Provide an example of an obviously invalid correlation matrix involving at least three variables, and explain
Consider a situation where there is a cost that is either incurred or not. It is incurred only if the value of some random input is less than a specified cutoff value. Why might a simulation of this situation give a very different average value of the cost incurred than a deterministic model that
If you want to replicate the results of a simulation model with Excel functions only, not @RISK, you can build a data table and let the column input cell be any blank cell. Explain why this works.
Suppose you simulate a gambling situation where you place many bets. On each bet, the distribution of your net winnings (loss if negative) is highly skewed to the left because there are some possibilities of really large losses but not much upside potential. Your only simulation output is the
You plan to simulate a portfolio of investments over a multiyear period, so for each investment (which could be a particular stock or bond, for example), you need to simulate the change in its value for each of the years. How would you simulate these changes in a realistic way? Would you base it on
Big Hit Video must determine how many copies of a new video to purchase. Assume that the company's goal is to purchase a number of copies that maximizes its expected profit from the video during the next year. Describe how you would use simulation to shed light on this problem. Assume that each
Many people who are involved in a small auto accident do not file a claim because they are afraid their insurance premiums will be raised. Suppose that City Farm Insurance has three rates. If you file a claim, you are moved to the next higher rate. How might you use simulation to determine whether
A building contains 1000 lightbulbs. Each bulb lasts at most five months. The company maintaining the building is trying to decide whether it is worthwhile to practice a "group replacement" policy. Under a group replacement policy, all bulbs are replaced every T months (where T is to be
Why is the RISKCORRMAT function necessary? How does @RISK generate random inputs by default, that is, when RISKCORRMAT is not used?
Consider the claim that normally distributed inputs in a simulation model are bound to lead to normally distributed outputs. Do you agree or disagree with this claim? Defend your answer.
We have separated the examples in this chapter into operations, finance, marketing, and sports categories. List at least one other problem in each of these categories that could be attacked with simulation. For each, identify the random inputs, possible probability distributions for them, and any
Suppose you are an HR (human resources) manager at a big university, and you sense that the university is becoming too top-heavy with full professors. That is, there do not seem to be as many younger professors at the assistant and associate levels as there ought to be. How could you study this
You are an avid basketball fan, and you would like to build a simulation model of an entire game so that you could compare two different strategies, such as man-to-man versus zone defense. Is this possible? What might make this simulation model difficult to build?
Suppose you are a financial analyst and your company runs many simulation models to estimate the profitability of its projects. If you had to choose just two measures of the distribution of any important output such as net profit to report, which two would you choose? Why? What information would be
Software development is an inherently risky and uncertain process. For example, there are many examples of software that couldn't be "finished" by the scheduled release date-bugs still remained and features weren't ready. (Many people believe this was the case with Office 2007.) How might you
Health care is continually in the news. Can (or should) simulation be used to help solve, or at least study, some of the difficult problems associated with health care? Provide at least two examples where simulation might be useful.
The Access database file Foodmart.mdb mentioned earlier has the tables and relationships shown in Figure 17.1. Import the tables into an Excel Data Model. Then create a pivot table that shows, for each product family, the percentage of the total revenue from stores in each of the three countries
Continuing the previous problem, the same data have been split into two sets in the file P17_10.xlsx. The first 9500 observations are in the Training Data sheet, and the last 500 observations are in the Prediction Data sheet. In this latter sheet, the values in the Catalog Purchase and Online
Using the same data as in the previous problem, use Neural-Tools, with the PNN algorithm, to perform the classification. Even though there are only 74 companies, you can still use 20% of them for testing. Then at the end of the run, respond Yes to the sensitivity analysis. This lets you see how
A classification algorithm was used to predict Yes/No values for a given training data set, and then the results were applied to 100 observations in a testing data set. The actual Yes/No values and the estimated probabilities of Yes for these 100 observations are listed in the file P17_13.xlsx.
The file P17_15.xlsx contains data on 178 wines. They are categorized into three types, labeled A, B, and C. The rest of the variables are numeric properties of the wines. Use Neural-Tools to classify these wines. Use the PNN algorithm, and check the Variable Impact Analysis option in the Train
Continuing the previous problem, the file P17_16. xlsx contains the same wine data. Using a Microsoft Data Mining add-in (not discussed here), a decision tree classification was performed (with 0% of the cases held out for testing). You can see the resulting tree in the Tree sheet. Write out the
Neural nets (and Neural-Tools) can also be used when the dependent variable is continuous, not categorical. In this case, the method is an alternative to multiple regression. The file P17_17.xlsx contains fairly old Boston housing data that appears frequently in data mining discussions. The
The file P17_19.xlsx contains various data on 325 metropolitan cities in the United States. Cell comments in row 1 explain some of the variables. A Microsoft Data Mining add-in (not discussed here) was used to cluster these cities, with the results shown in the file. There are four clusters,
Proceed as in the previous problem, but now create a pivot table that shows, for stores in each country, the percentage of units sold in each of the three product families (Drink, Food, and Non-Consumable). For example, you should find that 70.83% of all units sold in Canada were in the Food family?
Continuing problem 15, the file P17_20.xlsx contains the same wine data. Instead of trying to use a classification algorithm to classify wines into the three known types (A, B, and C), it is interesting to see if a clustering algorithm can discover these known categories. The file contains the
Using the data in the file P17_21.xlsx, the same data as in Problem 19, use the method in Example 17.4 to find four clusters of cities. Note that there are two text variables, Crime_Trend and Unemployment_Threat. You can ignore them for this problem. Write a short report about the clusters you
Using the data in the file P17_15.xlsx, the same data as in Problem 20, use the method in Example 17.4 to find three clusters of wine types. (Of course, don't use the Type variable when creating clusters.) Write a short report about the clusters you find. Does the clustering agree with the Type
This problem lets you see how dissimilarity, the key to clustering, might be calculated and then used for prediction. The file P17_23.xlsx contains data for 10people. The value of Amount Spent for person 10 is unknown, and the ultimate purpose is to use the data for the first 9 people to predict
The lasagna data discussed in the chapter is repeated in the file 17_24.xlsx. Instead of trying to classify a dependent variable, Have Tried, this file shows the result of clustering. Specifically, a Microsoft Data Mining Detect Categories algorithm (not discussed here) was used, arbitrarily
(Requires Power Pivot) The file P17_25.xlsx contains salaries of all Major League Baseball players in 2015 in one sheet and geographical information about the teams in another sheet. Use Power-Pivot and Power View to create a map with bubbles indicating the size of total salary, either by city or
The file P17_26.xlsx contains Gender, Age, Education, and Success (Yes/No) data of 1000 people. The purpose is to see how a classification tree method can use the first three variables to classify Success. You start with 564 Yes values and 436 No values. This is quite diverse (close to 50-50), and
Proceed as in Problem 1, but now create a pivot table that has two fields from the Products table, Product Family and Product Department, in the Rows area and two fields from the Stores table, Country and Region, in the Columns area. Use this to find the percentage of revenue from any product
The file Adventure Works.cub contains sales data on biking and related products. It was created in Microsoft SQL Server software and stored as an offline cube. There are two dimension hierarchies, Product Model Categories and Product Model Lines, that categorize the products in slightly different
The file P17_05.xlsx contains data on 100 consumers who drink beer. Some of them prefer light beer, and others prefer regular beer. A major beer producer believes that the following variables might be useful in discriminating between these two groups: gender, marital status, annual income level,
Using the same beer preference data in the file P17_05.xlsx, discretize the Income and Age variables according to their quartiles. Then use the naïve Bayes procedure to classify the 100 customers as having Regular or Light preference. Based on these results, consider a new customer: Male, Married,
Admissions directors of graduate business programs constantly review the criteria they use to make admission decisions. Suppose that the director of a particular top-20 MBA program is trying to understand how she and her staff discriminate between those who are admitted to their program and those
Using the same admissions data in the file P17_07.xlsx, discretize the GMAT Score and Undergraduate GPA variables according to their quartiles. Then use the naïve Bayes procedure to classify the 100 applicants as Yes or No for admittance. (Remember that classifications can be based on the
A company that sells through a catalog and online through the Web has collected data on 10,000 potential customers. The data are in the file P17_09.xlsx. They include RFM (Recency, frequency, and monetary) variables, which are popular in marketing research, as well as yes/no data on whether the
Explain what a star schema is all about. How does it help to provide useful information in pivot tables?
What are the strengths and drawbacks of neural nets versus classification trees?
Clustering algorithms always start with a dissimilarity measure. Why it is not always obvious how to develop such a measure?
Suppose a hospital wants to create a database with the star schema structure. What dimensions and facts might it store?
How does the OLAP methodology allow you to "drill down" in a pivot table?
What is the advantage of creating an OLAP cube file, especially for extremely large databases?
Explain briefly what a Data Model in Excel (2013 and later) represents. Also, explain briefly what you can now do in Excel with the new PowerPivot tool that you couldn't do in previous versions of Excel.
How does the general classification problem discussed in Section 17-3 differ from the general problem analyzed with regression, and why does standard regression not work for the classification problem?
What is the main purpose of logistic regression, and how does it differ from the type of regression, discussed in Chapters 10 and 11?
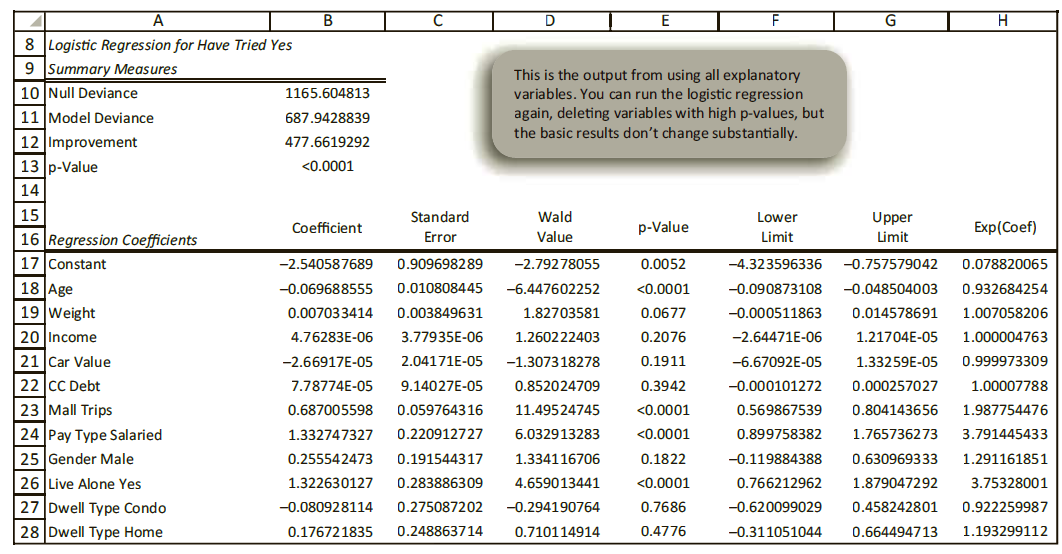
Suppose that a term in a logistic regression equation is 0.687*MallTrips, as in Figure 17.17. Explain, exactly what this means.Figure 17.17
Suppose you are trying to classify a variable where 96% of its observations equal 0 and only 4% equal 1. You run a logistic regression, and the classification table shows that 97% of the classifications are correct. Why might this large percentage still not be cause for celebration?
The file P18_01.xlsx contains the counts of unique visitors to popular websites from April 2008 to April 2009. There are actually two sheets, one for news sites and one for sports sites. For each sheet, rearrange the data or do whatever it takes to create the two charts shown in the file?
Continuing the previous problem, the files P18_10 1987.txt through P18_10 1990.txt contain data on Barry Bonds's at-bats during each of the four seasons 1987-1990. The file P18_10 Variables.txt lists the variables in each file. Import each year's data into Excel. Then bring all of the data into a
The files P18_11 Temp.txt, P18_11 Precip.txt, and P18_11 Drought.txt contain monthly data on temperature, precipitation, and drought for various states and regions in the U.S. The file P18_11 Description. txt describes the data. In particular, it indicates that each of the data files is fixed
The file P18_12.txt contains yearly data for the number of licensed drivers (those under 18, those over85, and total) by gender and state. Import this data into Excel and save it as an Excel (.xlsx) file. Useappropriate text functions (unless you want to do it manually) to shorten the variable
The file P18_13.txt contains yearly salary data for full professors at several Big Ten universities. For each university, there is data on the average salary for full professors, the number of full professors, and the total paid to all full professors. Import this data into Excel. The variable
Starting with the file Shirt Orders.mdb from Example 18.5, find all of the records from the Orders table that correspond to orders for between 50 and 100 items (inclusive) made by the customer Rags to Riches for the product Short-sleeve Polo. Return the dates, units ordered, and discounts for each
Starting with the file Shirt Orders.mdb from Example 18.5, find all of the records from the Orders table that correspond to orders for more than 75 items made by the customer Threads for products designed to be worn by women. Return the dates, units ordered, and product description for each of
Fine Shirt Company would like to know how many units of its products designed for each gender subset (i.e., men, women, and both genders) were sold to each customer during each quarter of the past five years (i.e., from the first quarter of 2012 through the fourth quarter of 2016). Starting with
Fine Shirt Company would like to know how many units of each of its products were sold to each customer during each year of the period 2012-2016. Starting with the file Shirt Orders.mdb from Example 18.5, perform an appropriate query and bring the results back to Excel as a pivot table to answer
The file P18_02.xlsx contains yearly data on nine of the Big Ten universities. There are two pieces of data for each university for each year: the count of full professors, and the total amount paid to these professors. Rearrange the data or do whatever it takes to create the chart shown in the
Import the salary data for the Baltimore Ravens NFL team from the website http://www.sportscity.com/nfl/salaries/baltimore-ravens-salaries/. Can you import data from other NFL teams from similar websites?
The website www.aflcio.org/Corporate-Watch/ Paywatch-2014/100-Highest-Paid-CEOs lists the compensations of the 100 highest paid CEOs, as of 2014. Import these data into Excel?
Websites such as finance.yahoo.com/q/is?s=KO provide income statements for companies. The information after the question mark identifies the company, in this case Coca Cola with stock symbol KO. Import data from such a site into Excel, where you can choose the company?
Websites such asfinance.yahoo.com/q/hp?s=AA&a=00&b=29&c=2001&d=00&e=29&f=2010&g=m contain historical stock price data. The information after the question mark indicates the company, in this case Alcoa with stock symbol AA, and the time period. Import data from such a
The file P18_24.xlsx contains a data set that represents 30 responses from a questionnaire concerning the president's environmental policies. Each observation lists the person's age, gender, state of residence, number of children, annual salary, and opinion of the president's environmental
Showing 75000 - 75100
of 88243
First
744
745
746
747
748
749
750
751
752
753
754
755
756
757
758
Last
Step by Step Answers
.png)