New Semester
Started
Get
50% OFF
Study Help!
--h --m --s
Claim Now
Question Answers
Textbooks
Find textbooks, questions and answers
Oops, something went wrong!
Change your search query and then try again
S
Books
FREE
Study Help
Expert Questions
Accounting
General Management
Mathematics
Finance
Organizational Behaviour
Law
Physics
Operating System
Management Leadership
Sociology
Programming
Marketing
Database
Computer Network
Economics
Textbooks Solutions
Accounting
Managerial Accounting
Management Leadership
Cost Accounting
Statistics
Business Law
Corporate Finance
Finance
Economics
Auditing
Tutors
Online Tutors
Find a Tutor
Hire a Tutor
Become a Tutor
AI Tutor
AI Study Planner
NEW
Sell Books
Search
Search
Sign In
Register
study help
business
business analytics data
Introduction To Business Analytics 1st Edition Vernon Richardson, Marcia Watson - Solutions
Go to https://finance.yahoo.com/ and extract at least 20 years of annual return data for two mutual funds. Perform a similar analysis to the one that was conducted for the introductory case to this chapter.
To examine the impact of the COVID-19 pandemic on the economy, go to the U.S. Department of Labor’s website on unemployment insurance weekly claims data (https://oui.doleta.gov/unemploy/claims.asp). Extract weekly data for two states for 2020 through 2021. Use summary measures to compare and
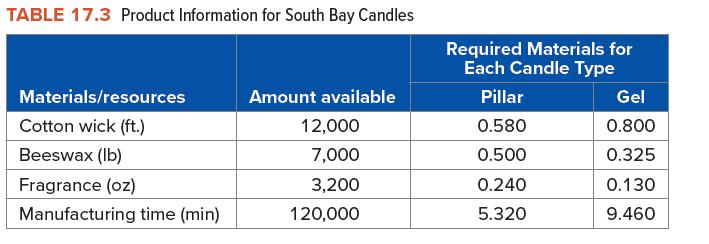
South Bay Candles makes two types of scented candles: 10-inch pillars and 2-inch decorative gel. The production requirements for each product and available resources are shown in Table 17.3. The sales price for each pillar and each gel candle is $2.15 and $3.55, respectively. Analyze the data
The accompanying data file shows the net profit (Net_Profit), counter sales (Counter_Sales), and drive-through sales (Drive_Sales) for a chain of 100 fastfood restaurants. All variables are measured in millions of dollars.a. Construct the five-number summary for each variable.b. Interpret the
The accompanying data file shows the net profit (Net_Profit) counter sales (Counter_Sales), and drive-through sales (Drive_Sales) for a chain of 100 fast-food restaurants. All variables are measured in millions of dollars.a. Calculate the sample standard deviation for counter sales and
An oil and gas company has two refineries that produce light and heavy crude oil. The first refinery can produce 500 barrels of light crude oil and 300 barrels of heavy crude oil per day, and the second refinery can produce 600 barrels of light crude oil and 450 barrels of heavy crude oil per day.
A financial portfolio usually consists of a number of investment options such as stocks and mutual funds. Visit online sources such as the Wall Street Journal (www.wsj.com), Google Finance (www.google.com/finance), or Yahoo Finance (finance.yahoo.com), and choose three corporate stocks or mutual
A pet daycare facility offers pet sitting services where owners can drop off their pets for training and socializing with other pets. To feed the pets, the daycare makes two types of pet food. A bag of freeze-dried nuggets costs $7.99 and contains 21 units of proteins, 4 units of fiber, and 15
At a shipping warehouse, a manager has purchased two warehouse automation robots, an autonomous mobile robot (AMR) and a preprogrammed aerial drone. The AMR can retrieve 17 packages per hour, and its operating cost is $3.50 per hour. The aerial drone can retrieve 28 packages per hour, and its
Use tabular and graphical methods to examine the salaries of sales representatives along with other variables of
Use tabular and graphical methods to examine the result of a Covid test along with other variables of
An urban university conducts a transportation survey of its students, faculty, and staff to learn about commuting patterns. The accompanying data file shows each respondent’s most common mode of commuting (Bicycle, Drive_Alone, Public_Transit, Walk, and Other).a. Construct the frequency and the
The COVID-19 pandemic resulted in the distinctive rise of online learning. At a recent conference, 10 out of 15 professors indicated that they will use elements of online learning post-pandemic. Suppose two of these faculty members are randomly selected.a. What is the probability that both of them
Develop a logistic regression model for predicting if the respondent is outgoing in adulthood. Use cross-validation to select the appropriate predictor variables. In order to estimate this model, you have to first handle missing observations using the missing or the imputation
A logistic regression is estimated to analyze the probability of complications for male patients resulting from a serious infection. Predictor variables include the patient’s weight, age, and whether he is diabetic (Diabetes equals 1 if diabetic, 0 otherwise). The accompanying data file includes
Choose a college of interest and use the sample of enrolled students to best predict a student’s college grade point average. Explore interactions of the relevant predictor variables and use model selection criteria to select the best predictive model. In order to estimate these models, you have
Amanda Chen is the manager of a subscription firm that sells products on a scheduled time basis. She would like to analyze the impact on subscription due to a recent marketing initiative where customers are offered a varying one-time percentage discount (Discount). The response variable Subscribe
Develop a model for predicting a player’s salary. For predictor variables, consider age (quadratic effect), height, weight, and relevant performance measures. Use model selection criteria to assess the choice of predictor variables as well as the functional form (linear or exponential). In order
The net promoter score (NPS) is a key indicator of customer satisfaction and loyalty. Use data on employees in the software product group with a college degree to develop the logistic regression model for predicting if a sales rep will score an NPS of 9 or more. Use cross-validation to select the
Choose two comparable college towns. Develop a predictive, model for the sale price of a house for each college town. Explore loglinear transformations, dummy variables, and interactions of the relevant predictor variables. Use model selection criteria to select the best predictive model. Interpret
The net promoter score (NPS) is a key indicator of customer satisfaction and loyalty. Use data on employees in the hardware product group with a college degree to develop a regression model that analyzes the effect of cognitive and noncognitive factors on NPS. Use model selection criteria to find
Visit a public health website such as the World Health Organization (https://covid19.who.int/) and the U.S. Centers for Disease Control and Prevention (https://www.cdc.gov/) and explore the COVID-19 data. Write a report comparing the mortality rates, defined as the fatality probability conditional
Estimate and interpret a logistic regression model to predict COVID testing results using the appropriate predictor variables. Note: You may need to first subset the data based on age, sex, and/or contact due to the data size constraints of software
Automobiles, including cars and light trucks, are the most held nonfinancial assets among Americans, which are often financed through loans. Peter Firsov works in the car loan division of a major commercial bank. He wants to use a data-driven strategy to identify borrowers who are likely to default
Subset the data to include any one county of your choice. Develop a logistic regression model to analyze the probability of a head-on crash using predictor variables such as the weather condition, amount of daylight, and whether or not the accident takes place on a highway. Use the appropriate
The accompanying file contains historical data for 400 customers related to automobile loans. The information includes whether the customer defaulted on the loan (Default = 1 for default, 0 otherwise) and the corresponding loan-to-value ratio (LTV in %), FICO credit score (FICO), and customer
A logistic regression model is estimated to analyze the probability of complications for male patients resulting from a serious infection. Predictor variables include the patient’s weight and age and whether he is diabetic (Diabetes equals 1 if diabetic, 0 otherwise). The accompanying data file
The manager is concerned about the attrition rate at her gym. She would like to identify the profile of loyal members who retain the membership for at least one year. The accompanying data file contains information on whether the member has been loyal (Loyal = 1 if the member stayed at the gym for
Consider the accompanying data file to estimate the logistic regression model for predicting loyalty (Loyal equals 1 if the member stayed at the gym for at least one year, 0 otherwise). Predictor variables include the member’s age and income (in $1,000s) and whether he/she joined on a single plan
Consider the accompanying data file for predicting an interview call (Yes or No). Use the k-fold cross validation method, with k = 4, to compare the accuracy rates of two logistic regression models. Predictor variables for Model 1 include GPA, Male (1 for male, 0 otherwise), and Looks (1 for good
Use the accompanying data file to analyze subscription (Subscribe equals 1 if a customer subscribes, 0 otherwise). Also included in the data file are the percentage discount (Discount) and the customer’s age and sex.a. Estimate the logistic regression model for subscription using discount and age
A recent study analyzed the influence of looks on a candidate’s chances of getting called for an interview. Interestingly, more interviews were granted to plain looking women than to attractive women. The exact opposite was true for men, who benefited from the beauty premium. An experiment was
Use the accompanying data file to analyze loyalty (Loyal equals 1 if the member stayed at the gym for at least one year, 0 otherwise). Also included in the file are the member’s age and income (in $1,000s) and whether he/she joined on a single plan (Single equals 1 if on a single plan, 0
Use the accompanying data file to analyze subscription (Subscribe equals 1 if a customer subscribes, 0 otherwise). Also included in the file are the percentage discount (Discount) and the customer’s age and sex.a. Estimate the logistic regression model to predict the odds of subscription for
Subset the data set to include only college-educated sales professionals in the software product group. Predict whether the sales professional will receive a high (9 or 10) net promoter score (NPS) or not using predictor variables such as age, sex, tenure with the company, number of professional
Subset the data to include only those individuals who lived in an urban area. Predict whether or not an individual’s marriage will end up in a divorce, a separation, or a remarriage using predictor variables such as sex, parents’ education, height, weight, number of years of education,
Amazon.com, Inc., was a money-losing company when it went public on May 15, 1997, with an IPO valued at a modest $438 million. Amazon has since had an epic run as a public company, worth over a trillion dollars in 2020. An important question for investors and other stakeholders is if Amazon’s
Subset the data to include only one of the colleges. Predict whether an admitted applicant will eventually decide to enroll at the college using predictor variables such as gender, race, high school GPA, SAT/ACT score, and parents’ education level. You will have to first subset the data to
Subset the data to include only the accidents that occured in one city or during one month. Predict whether or not a car crash will result in fatality or severe injuries by using predictor variables such as the weather condition, amount of daylight, and whether or not the accident takes place on a
Develop a model to predict COVID testing results using predictor variables such as whether an individual has certain symptoms (i.e., cough, fever, sore throat, shortness of breath, and headache), age, sex, and whether the individual had contact with confirmed COVID cases. Discuss the predictive
A linear trend model estimated from 30 days of data is given by y ̂ = 80.20 + 0.62t . Use the estimated model to forecast y for the next two days.
COVID-19 disease caused a worldwide pandemic in 2020 and necessitated the need for public health organizations to gather and provide COVID-19 data to study the spread of the disease. Visit https://github.com/owid/covid-19 data/tree/master/public/data to find daily data on confirmed cases, deaths,
Subset the data to select only those individuals who lived in an urban area. Reduce the dimensionality of the data by converting numerical variables such as age, height, weight, number of years of education, number of siblings, family size, number of weeks employed, self-esteem scale, and income
Select the data for one of the three colleges. Reduce the dimensionality of the data by converting numerical variables such as high school GPAs, college GPAs, SAT scores, and ACT scores into a smaller set of principal components that retain at least 90% of the information in the original
Subset the data to include only the employees who work in the hardware division and have a college degree. Reduce the dimensionality of the data by converting numerical variables such as age, years with the company, number of certifications, feedback scores, and salary into a smaller set of
Subset the data to include only those individuals who lived in an urban area. Develop a decision tree model to predict an individual’s body mass index (BMI) or whether an individual is going to be overweight or not using predictor variables such as sex, number of years of education, parents’
Subset the data to include only the accidents that occurred in one city or during one month. Develop a decision tree model that predicts whether an automobile accident results in fatal or severe injuries using predictor variables, such as traffic violation category, weather condition, type of
Subset the data to include only college-educated sales professionals in the software product group. Develop a decision tree model to predict whether or not the sales professional will receive a high (9 or 10) net promoter score (NPS), using predictor variables, such as age, sex, tenure with the
Develop a series of decision tree models to predict how likely a given university applicant will be accepted by the colleges based on the applicant’s sex, race, high school GPA, SAT/ACT score, and parents’ years of
Develop a decision tree model to predict the sale price of a house by using predictor variables, such as number of bedrooms, number of bathrooms, home square footage, lot square footage, and age of the house. As real estate values can differ dramatically from region to region, you may want to
Subset the data to include only one of the three colleges. Group college applicants into clusters based on categorical variables of your choice (e.g., sex, parent’s education). Determine the appropriate number of clusters. Report the characteristics of each cluster and explain how they are
Subset the data to include only one of the three colleges. Find a combination of numerical and categorical variables to include in cluster analysis. Determine the appropriate number of clusters and write a report to explain your decision and describe how each cluster is different from other
Subset the data set to include only sales professionals in one of the two product groups. Cluster the sales professionals based on numerical variables of your choice (e.g., age, salary). Determine the appropriate number of clusters. Describe each cluster and compare the average net promoter scores
Group NBA players into clusters based on either their career performance or performance statistics from a particular season (e.g., 2013–2014). Determine an appropriate number of clusters, and write a report based on the clustering
Subset the data set to include only those individuals who lived in an urban area. Cluster the individuals using a combination of numerical and categorical variables. Determine the appropriate number of clusters and write a report to describe the differences between
Perform association rule analysis on the positive COVID-19 tests. Which attributes of the patients tend to be present simultaneously for those patients who tested positive for COVID-19? Cluster the patients based on their attributes. Determine the appropriate number of clusters and describe the
Consider a major Internet company whose social media platform you use regularly. Suppose this company is considering purchasing one of its competitors to gain market share. Develop a spreadsheet model to help this company analyze the impact of the purchase on its revenues, costs, and profits.
A real estate developer wants to analyze the profitability of developing a new residential community with 100 single-family homes and 200 apartment units. Research the costs of real estate development in your area for such a residential community. Your model should take into account the housing
An airline company is going through a major cost reduction effort that involves reducing the number of flights by 20%, increasing fuel efficiency by 5%, and offering to 10% of the pilots and flight attendants early retirement programs. Research the cost data of a major airline and develop a
The accompanying spreadsheet model, which is designed to analyze profits, contains an error.a. Use the model auditing tools to identify the error. Is the error due to circular reference, incorrect cell reference, or invalid user inputs?b. To ensure that the user of the spreadsheet model enters a
The accompanying spreadsheet model, which is designed to compute student grades, contains some errors.a. Show and review the formulas in the spreadsheet model. Which cells are most likely to contain formulas with errors?b. For each of the suspected cells, identify the precedents and dependents of
The accompanying spreadsheet model, which is designed to compute commissions and salaries, contains some errors.a. Use the model auditing tools and techniques to identify the errors. Are the errors due to circular reference, incorrect cell reference, or invalid user inputs?b. Repair the spreadsheet
A grocery store manager wants to analyze customer spending data by product categories: fresh baked goods, meat and dairy, produce, and frozen food. For each shopping trip, about 30% of shoppers purchase baked good items, and the spending in this category tends to follow a uniform distribution
An airline company has a flight with a capacity of 150 seats regularly scheduled from Boston to San Francisco. On average, only 90% of the ticket holders show up for the flight, and the airline usually overbooks the flight by 10%. The ticket price is normally distributed with a mean of $350 and a
A young couple starts a college-savings fund for their newborn baby and invests $20,000 in a broad market index fund and $10,000 in a high-growth index fund. Historically, the annual return of the broad market index fund follows a normal distribution with an average return of 6.73% and a standard
Describe specific types of questions asked in auditing that might require descriptive, diagnostic, predictive, and prescriptive analytics (one question for each). Also describe the types of specific tools and techniques that could be used to address each of those questions.
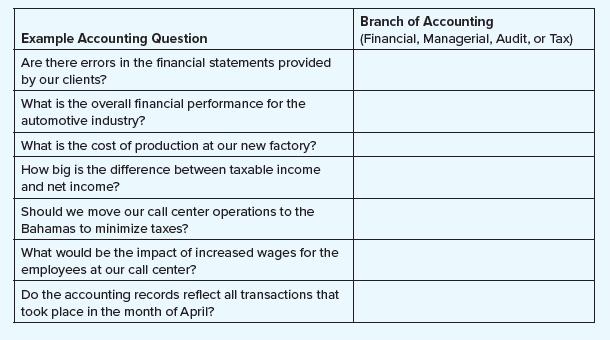
Match the branch of accounting (financial, managerial, audit, or tax) to each example accounting question. Example Accounting Question Are there errors in the financial statements provided by our clients? What is the overall financial performance for the automotive industry? What is the cost of
Describe the role of tax accounting.
A graph displaying net income over the past four years results from which type of analytics?a. Descriptive analyticsb. Diagnostic analyticsc. Predictive analyticsd. Prescriptive analytics
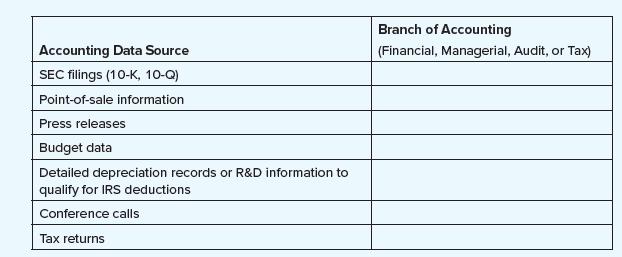
Match the accounting data sources to the branch of accounting (financial, managerial, audit, or tax). Accounting Data Source SEC filings (10-K, 10-Q) Point-of-sale information Press releases Budget data Detailed depreciation records or R&D information to qualify for IRS deductions Conference
Budget data are an example of which kind of accounting data?a. Financial accountingb. Managerial accountingc. Auditingd. Tax accounting
Describe specific types of questions asked in tax accounting that might require descriptive, diagnostic, predictive, and prescriptive analytics (one question for each). Also describe the types of specific tools and techniques that could be used to address each of those questions.
Managerial accounting does not have any rules and standards. How do managerial accountants know which information to analyze?
You’re an auditor and you’re looking for fraudulent transactions.Requireda. If you had access to any accounting records you wanted (with details of every transaction), where would you look? Explain.b. How would you find kickbacks to employees from vendors? Where would you look?c. What type of
Which form is a required annual submission to the Securities and Exchange Commission?a. 10-Qb. 10-Kc. 8-Kd. Press release
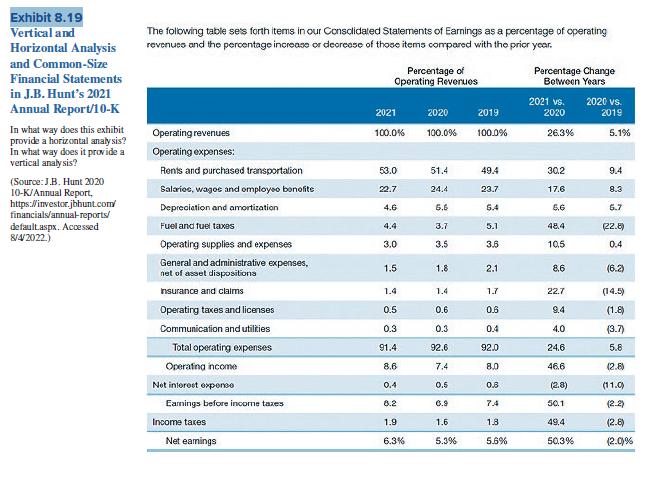
Refer to Exhibit 8.19. Is J.B. Hunt’s performance improving or declining overall? Why is it improving or declining in the most recent year? Which specific line items help you answer these questions?Exhibit 8.19 Exhibit 8.19 Vertical and Horizontal Analysis and Common-Size Financial Statements in
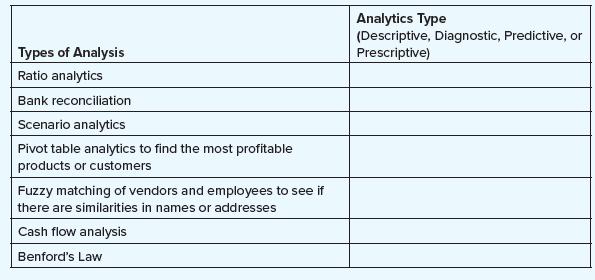
Match each type of analysis to its analytics type (descriptive, diagnostic, predictive, or prescriptive). Types of Analysis Ratio analytics Bank reconciliation Scenario analytics Pivot table analytics to find the most profitable products or customers Fuzzy matching of vendors and employees to see
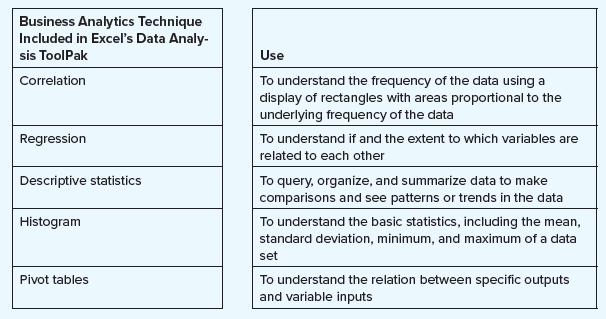
Match the business analytics technique included in Excel’s Data Analysis Tool-Pak to its use. Business Analytics Technique Included in Excel's Data Analy- sis ToolPak Correlation Regression Descriptive statistics Histogram Pivot tables Use To understand the frequency of the data using a display
Describe questions that external and internal auditors can use business analytics to answer.
What are some examples of diagnostic analytics for those in financial accounting? Managerial accounting?
Assessing a company’s cost structure is an example of which type of analytics?a. Descriptive analyticsb. Diagnostic analyticsc. Predictive analyticsd. Prescriptive analytics
Describe sources of financial accounting data helpful in addressing questions associated with descriptive analytics.
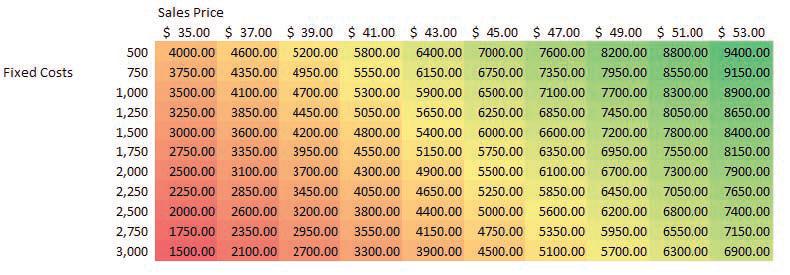
Using the exhibit and description in Problem 7 above, evaluate the sensitivity ofn profits to changing levels of fixed costs and product sales price.Requireda. Which has a greater impact on profitability, a $2 increase in sales price or a $250 decrease in total fixed costs?b. How does conditional
Management accountants can use the following table to perform a sensitivity analysis, evaluating the company’s changing profitability based on two important inputs: (1) the level of total fixed costs and (2) the sales price of the product. Note that the analysis varies the sales price from $35 to
What prescriptive analytics technique is used to determine the break-even level of sales?a. Sensitivity analysisb. Scenario analysisc. Cash flow analysisd. Goal-seek analysis
How does vertical analysis serve as a descriptive analytics technique to describe what is happening?
Which type of analytics looks for anomalies and outliers? Defend your choice.
What is the difference between the predictive analytics techniques of classification and regression?
Which predictive analytics technique is generally used to forecast future sales, earnings, and cash flows?a. Time series analysisb. Classificationc. Regressiond. Goal-seek analysis
Download the Costs of Production data set in Excel. Note the Units of Production (labeled Production) in Column B and the Total Costs (labeled Cost) by week.Requireda. Perform a regression analysis with Cost as the dependent (outcome) variable and Production as the independent variable.b. Estimate
Which analytics technique evaluates the percentage change in performance from one period to the next?a. Verticalb. What-ifc. Classificationd. Horizontal
Which type of analytics will analysts use to optimize company performance based on expected changes in tax law? Explain.
Which type of analytics will a company use to answer the question of whether it should rent or own its headquarters office building? Explain.
The Human Resources department of a large technology company maintains personnel information on each employee’s personality type based on the Myers-Briggs assessment. The accompanying data file shows each employee’s personality type (Analyst, Diplomat, Explorer, or Sentinel) as well as sex
The accompanying data file shows the salary (in $) and work experience (in years) for 100 employees in a marketing
The Human Resources department of a large technology company maintains personnel information on each employee’s personality type based on the Myers-Briggs assessment. The accompanying data file shows each employee’s personality type (Analyst, Diplomat, Explorer, or Sentinel) as well as sex
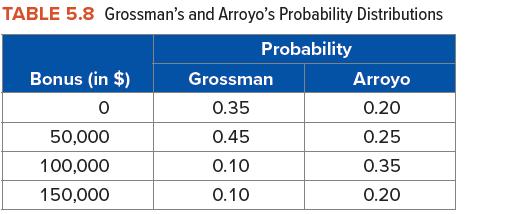
Senior executives at Skyhigh Construction, Inc., participate in a pick-your-salary plan. They choose salaries in a range between $125,000 and $150,000. By choosing a lower salary, an executive has an opportunity to make a larger bonus. If Skyhigh does not generate an operating profit during the
Approximately 23% of Americans will not use an online bank (The Ascent, January 21, 2021).a. In a sample of 50 Americans, what is the probability that more than 20% do not use an online bank?b. In a sample of 200 Americans, what is the probability that more than 20% do not use an online bank?c.
A local pharmacy administers an average of 84 Covid-19 vaccines per week. The vaccine shots are evenly administered across all days.a. Find the probability that the number of vaccine shots administered on a Wednesday is more than 8 but less than 12.b. Find the probability that the number of vaccine
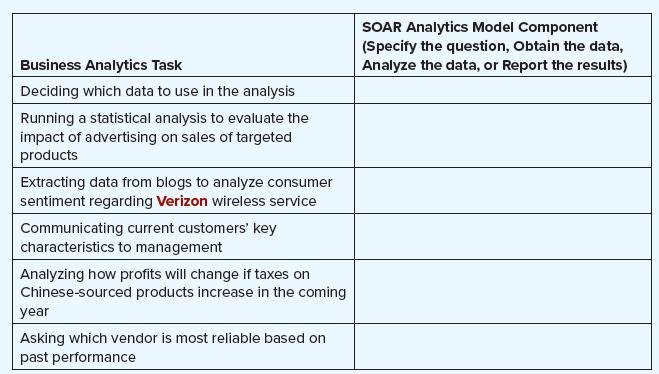
For each business analytics task, identify the correct step in the SOAR analytics model. Business Analytics Task Deciding which data to use in the analysis Running a statistical analysis to evaluate the impact of advertising on sales of targeted products Extracting data from blogs to analyze
Showing 3600 - 3700
of 4107
First
28
29
30
31
32
33
34
35
36
37
38
39
40
41
42
Step by Step Answers