New Semester
Started
Get
50% OFF
Study Help!
--h --m --s
Claim Now
Question Answers
Textbooks
Find textbooks, questions and answers
Oops, something went wrong!
Change your search query and then try again
S
Books
FREE
Study Help
Expert Questions
Accounting
General Management
Mathematics
Finance
Organizational Behaviour
Law
Physics
Operating System
Management Leadership
Sociology
Programming
Marketing
Database
Computer Network
Economics
Textbooks Solutions
Accounting
Managerial Accounting
Management Leadership
Cost Accounting
Statistics
Business Law
Corporate Finance
Finance
Economics
Auditing
Tutors
Online Tutors
Find a Tutor
Hire a Tutor
Become a Tutor
AI Tutor
AI Study Planner
NEW
Sell Books
Search
Search
Sign In
Register
study help
business
business statistics communicating
Statistics Without Maths For Psychology 7th Edition Chistine Dancey, John Reidy - Solutions
1. The narrower the confidence intervals:(a) The more confidence you can place in your results(b) The less you can rely on your results(c) The greater the chance that your results were due to sampling error(d) None of the above
2. Statistical significance:(a) Is directly equivalent to psychological importance(b) Does not necessarily mean that results are psychologically important(c) Depends on sample size(d) Both (b) and (c) above
3. All other things being equal, repeated-measures designs:(a) Have exactly the same power as independent designs(b) Are often less powerful than independent designs(c) Are often more powerful than independent designs(d) None of the above
4. All other things being equal:(a) The more sample size increases, the more power decreases(b) The more sample size increases, the more power increases(c) Sample size has no relationship to power(d) The more sample size increases, the more indeterminate the power
5. Power is the ability to detect:(a) A statistically significant effect where one exists(b) A psychologically important effect where one exists(c) Both (a) and (b) above(d) Design flaws
6. Effect size is:(a) The magnitude of the difference between conditions(b) The strength of a relationship or association(c) Both of these(d) Neither of these
7. Sample means are:(a) Point estimates of sample means(b) Interval estimates of population means(c) Interval estimates of sample means(d) Point estimates of population means
8. All other things being equal, the more powerful the statistical test:(a) The wider the confidence intervals(b) The more likely the confidence interval will include zero(c) The narrower the confidence interval(d) The smaller the sample size
9. Power can be calculated by a knowledge of:(a) The statistical test, the type of design and the effect size(b) The statistical test, the criterion significance level and the effect size(c) The criterion significance level, the effect size and the type of design(d) The criterion significance
10. A power level of 0.3 means:(a) You have a 30% chance of detecting an effect(b) You have a 49% chance of detecting an effect(c) You have a 70% chance of detecting an effect(d) You have a 0.7% chance of detecting an effect
11. Look at the following output for an independent t-test:
12. A researcher has found a correlation coefficient of r = +0.30, CI(95%) = -0.2 - (+0.7). Which is the most sensible conclusion? We are 95% confident that the population regression line would be:(a) Positive (+0.30)(b) Zero(c) Negative (-0.2)(d) Between -0.2 and +0.7
13. Look at the following output from a paired t-test analysis:Which is the most sensible answer?
14. It is more important to know the power of a study when:(a) The study has large participant numbers and is statistically significant(b) The study has large participant numbers and is not statistically significant(c) The study has small participant numbers and is statistically significant(d) The
15. Relative to large effect sizes, small effect sizes are:(a) Easier to detect(b) Harder to detect(c) As easy to detect(d) As difficult to detect
16. What are your chances of finding an effect (if one exists) when power = 0.6?(a) 50:50(b) 60:40(c) 40:60(d) 60:60
17. Confidence intervals around a mean value give you:(a) A range within which the population mean is likely to fall(b) A range within which the sample mean is likely to fall(c) A point estimate of the population mean(d) A point estimate of the sample mean
18. As your statistical test grows more powerful, does your confidence interval become:(a) Wider(b) Narrower(c) It makes no difference
19. If d = 0.89, then the effect size is said to be:(a) Zero(b) Weak(c) Moderate(d) Strong
20. When is a knowledge of power more important?(a) When you find an effect(b) When you don’t find an effect(c) It makes no difference
■ analyse the association between categorical variables
■ report another measure of effect (Cramer’s V)
■ report the results of such analyses.
Measures of association test for a relationship between two or more variables. This means the design is:(a) Repeated-measures(b) Between-participants(c) Correlational
(a) How many of you smoke and drink?
(b) How many smoke but do not drink?
(c) How many do not smoke but do drink?
(d) How many abstain from both?
Decide whether the following situations are best suited to Pearson’s r or x2 The relationships between:(a) Height (cm) and weight (kg)(b) Distance run (metres) and time taken (minutes and seconds)(c) A person’s body shape and occupational level (professional, clerical, manual)(d) Length of
Cramer’s V is:(a) A measure of difference(b) A correlation coefficient(c) An equivalent statistic to Fisher’s Exact Probability Test(d) A CV value?
1. What are the expected frequencies for the four cells?
2. What is the x2 value?
3. What is the probability value?
4. What can you conclude from the results?
1. What is the x2 value?
2. What is the probability value?
3. What do the results tell you?
1. Fisher’s Exact Probability Test is used when:(a) The calculations for x2 are too difficult(b) You have more than 25% of cells with expected frequencies of less than 5 in a 2 * 2 design(c) You have more than 25% of cells with expected frequencies of less than 5 in a 3 * 2 contingency table(d)
2. Cramer’s V is:(a) A victory sign made after performing Cramer’s statistical test(b) A measure of effect based on standardised scores(c) A correlational measure of effect converted from x2(d) A measure of difference
3. How many women were in the Tuesday morning group?(a) 127(b) 43(c) 99(d) 210
4. Pearson’s x2 has an associated probability of:(a) 60.001(b) 0.00004(c) 0.00124(d) None of these
5. The number of people in this analysis is:(a) 231(b) 170(c) 124(d) 525
6. 290 people are asked which of five types of cola they prefer. Results are as follows
What are the expected frequencies for the cells:(a) 57(b) 58(c) 290(d) None of the above
7. Look at the following output:
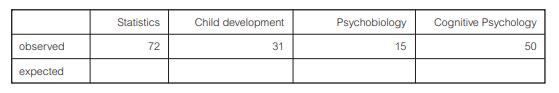
8. Look at the following table:What is the value of the expected frequencies?(a) 32 (b) 50 (c) 42 (d) 25 Psychobiology 31 15 15 observed expected Statistics 72 2 Child development Cognitive Psychology 50
9. A one-variable x2 is also called:(a) Goodness-of-fit test(b) x2 test of independence(c) x2 4 * 2(d) 2 * 2 x2
10. The value of x2 will always be:(a) Positive(b) Negative(c) High(d) It depends
11. The Yates’ correction is sometimes used by researchers when:(a) Cell sizes are huge(b) Cell sizes are small(c) They analyse data from 2 * 2 contingency tables(d) Both (b) and (c) above
12. The x2 value is:(a) 12.162(b) 21.516(c) 22.305(d) 525
13. The x2 value has an exact probability level of:(a) 0.0004(b) 0.05(c) 0.01055(d) 0.00796
14. The value of Cramer’s V is:(a) 0.05(b) 0.008(c) 0.099(d) 0.010
15. Look at the following 2 * 2 contingency table, taken from 150 participants:
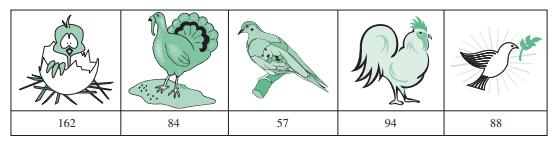
16. 485 people are asked which of five types of bird pictures they prefer to be put on a ‘stop all wars’campaign. Results are as follows:What are the expected frequencies for the cells?(a) 79 (b) 97 (c) 485 (d) 5 162 84 57 94 88
17. In order to find out the effect size after performing a x2 analysis, we:(a) convert Cramer’s V to x2(b) convert x2 to Cramer’s V(c) square the x2 value(d) convert x2 to Fisher’s Z
18. Look at the following table.This is called a:(a) 2 * 2 contingency table (b) 3 * 2 contingency table (c) 1 * 2 chi-square table (d) 2 * 2 chi-square table
19. The general purpose for which a 2 * 2 x2 analysis is used is to discover whether:(a) There is a significant association between two categorical variables(b) There is an association between two continuous variables(c) Two groups of participants differ on two variables(d) None of the above
20. If you are performing a 4 * 4 x2 analysis and find you have broken the assumptions, then you need to:(a) Look at the results for a Fisher’s exact probability test(b) Look to see whether it is possible to collapse categories(c) Investigate the possibility of a t-test(d) Give up
■ Scores must be drawn from a normally distributed population. We assume this is the case if our sample data show a normal distribution: the more participants we have in the study, the more likely it is that the distribution will be normal (see section 3.7).
■ There must be homogeneity of variance. This means that the variances are similar for the different groups. SPSS will test for this. In the case of the independent ANOVA, the test is called Levene’s Test. In the case of the repeated-measures ANOVA, it is F Max.
■ In a repeated-measures analysis, there is an additional assumption – that of sphericity. However, there is an adjustment used in repeated-measures ANOVA when this assumption has been violated. The adjustment is called the Greenhouse–Geisser Epsilon, and is given routinely in SPSS.
1. First, ANOVA calculates the mean for each of the three groups.
2. Then it calculates the grand mean (the three means are added together, then divided by 3).
3. For each group separately, the total deviation of each individual’s score from the mean of the group is calculated. This is the within-groups variation.
4. Then the deviation of each group mean from the grand mean is calculated. This is the between-groups variation.
Consider a design that has four independent conditions. Think of some reasons why scores in the different conditions might be different from each other. Then consider some of the reasons why participants might vary within each group?
In calculating an effect size between two conditions in a one-way ANOVA, you obtain an effect size (d) of 0.490. The conclusion is that the means differ by:(a) About half a standard deviation(b) About a quarter of a standard deviation(c) 4.9 standard deviations(d) None of the above
1. Parametric one-way independent ANOVA is a generalisation of:(a) The paired t-test(b) The independent t-test(c) x2(d) Pearson’s r
2. Which is the most appropriate conclusion?(a) There are statistically significant differences between the three groups of students on ENJOYMENT(b) There are important differences between the three groups but these are not statistically significant(c) There are no statistical or important
3. The following is also given with the above printout:What can you conclude from this?(a) The variances of the groups are significantly different from each other (b) The variances of the groups are similar (c) The variances are heterogeneous (d) None of the above
4. Here are the results for the KNOWLEDGE questionnaire, which the students completed after their one-hour lecture:Which is the most sensible conclusion?(a) There are significant differences between the groups on KNOWLEDGE; specifically, Colin Cashew’s group retained more of the lecture than the
5. The F-ratio is a result of:(a) Within-groups variance/between-groups variance(b) Between-groups variance/within-groups variance(c) Between-groups variance * within-groups variance(d) Between-groups variance + within-groups variance
6. The relationship between the F-ratio and t-value is explained by:(a) t 3 = F(b) F2 = t(c) t 2 = F(d) f 3 = t
7. Professor P. Nutt is examining the differences between the scores of three groups of participants. If the groups show homogeneity of variance, this means that the variances for the groups:(a) Are similar(b) Are dissimilar(c) Are exactly the same(d) Are enormously different
8. Differences between groups, which result from our experimental manipulation, are called:(a) Individual differences(b) Treatment effects(c) Experiment error(d) Within-participants effects?
9. Herr Hazelnuss is thinking about whether he should use a related or unrelated design for one of his studies. As usual, there are advantages and disadvantages to both. He has four conditions. If, in a related design, he uses ten participants, how many would he need for an unrelated design?(a)
10. Individual differences within each group of participants are called:(a) Treatment effects(b) Between-participants error(c) Within-participants error(d) Individual biases
11. Dr Colin Cashew allots each of 96 participants randomly to one of four conditions. As Colin Cashew is very conscientious, he meticulously inspects his histograms and other descriptive statistics, and finds that his data are perfectly normally distributed. In order to analyse the differences
12. The assumption of sphericity means that:(a) The variances of all the sample groups should be similar(b) The variances of the population difference scores should be the same for any two conditions(c) The variances of all the population difference scores should be similar(d) The variances of all
13. If, in an analysis of variance, you obtain a partial eta2 of 0.52, then how much of the variance in scores on the dependent variable can be accounted for by the independent variable?(a) 9%(b) 52%(c) 25%(d) 27%
14. Calculating how much of the total variance is due to error and the experimental manipulation is called:(a) Calculating the variance(b) Partitioning the variance(c) Producing the variance(d) Summarising the variance
15. The following is output relating to a post-hoc test, after a one-way ANOVA:
16. Look at the following output, which relates to a repeated-measures ANOVA with three conditions.Assume sphericity has been violated.
Which is the most appropriate statement?The difference between the conditions represented by:(a) F(2,12) = 7.82, p = 0.007(b) F(1,6) = 7.82, p = 0.030(c) F(2,12) = 7.82, p = 0.030(d) F(1.6) = 7.82, p = 0.031
17. Which is the most appropriate answer? The effect size is:(a) 5.7%(b) 57%(c) 0.57%(d) 5%
18. Which is the most appropriate statement?(a) F(2,12) = 5.62, p = 0.020(b) F(1,6) = 5.62, p = 0.051(c) F(2,12) = 5.62, p = 0.049(d) F(1,6) = 5.62, p = 0.055
19. Which two conditions show the largest difference?(a) 1 and 2(b) 2 and 3(c) 1 and 4(d) They are identical
20. Assuming that the null hypothesis is true, the difference between conditions 1 and 2 has a:(a) 5% chance of arising by sampling error(b) 6% chance of arising by sampling error(c) 19% chance of arising by sampling error(d) 20% chance of arising by sampling error
■ teach you about an extension of the one-way ANOVA to include two or more IVs
■ describe three different ANOVA designs, each with two IVs:
– the first ANOVA will have two between-participants IVs
– the second will have two within-participants IVs
– the third will have one between- and one within-participants IV
■ explain, with all these designs, how the variance is allocated between the various conditions and
how we might evaluate the degree of interaction between our two IVs
■ illustrate how we can break down interaction effects to find out precisely how one IV is interacting with the second IV; such analyses are called simple effects.
Will there be an overall difference between anxious and non-anxious participants in the number of words recalled?
Will memory be best for negative words or neutral words?
Will there be difference between anxious and non-anxious participants in the type of words best remembered?
Which of the following describe simple effects?(a) The difference between chewing gum and no chewing gum in the talking condition(b) The overall difference between the tea and non-tea drinking groups(c) The effects of noise in only the mathematics exam(d) The effects of cognitive behaviour therapy
Showing 6300 - 6400
of 7675
First
57
58
59
60
61
62
63
64
65
66
67
68
69
70
71
Last
Step by Step Answers