New Semester
Started
Get
50% OFF
Study Help!
--h --m --s
Claim Now
Question Answers
Textbooks
Find textbooks, questions and answers
Oops, something went wrong!
Change your search query and then try again
S
Books
FREE
Study Help
Expert Questions
Accounting
General Management
Mathematics
Finance
Organizational Behaviour
Law
Physics
Operating System
Management Leadership
Sociology
Programming
Marketing
Database
Computer Network
Economics
Textbooks Solutions
Accounting
Managerial Accounting
Management Leadership
Cost Accounting
Statistics
Business Law
Corporate Finance
Finance
Economics
Auditing
Tutors
Online Tutors
Find a Tutor
Hire a Tutor
Become a Tutor
AI Tutor
AI Study Planner
NEW
Sell Books
Search
Search
Sign In
Register
study help
business
business statistics
Business Statistics 2nd Edition Robert A Donnelly, Robert Donnelly Jr - Solutions
Joyce can hire a market research firm to conduct a survey to better ascertain the demand for this product. The cost of the survey is $20,000. If the market has strong demand for the product, the probability that the survey will predict a strong demand is 80%. If the market has a weak demand for the
Beth needs to decide how much of her earnings to deposit into her employer’s FSA. She is considering $1,000,$1,500, $2,000, and $2,500 and is currently in a 25% tax bracket. Construct a decision table showing the costs of depositing these amounts along with annual medical expenses of $1,000,
Beth has estimated that the probabilities of experiencing medical expenses of $1,000, $1,500, $2,000, and $2,500 during the upcoming year are 0.10, 0.20, 0.30, and 0.40 respectively.a. Choose the amount of earnings Beth should deposit in the FSA using this probability data.b. What is the most that
Spirit Airlines needs to decide to overbook 0, 1, 2, or 3 passengers on its flight from Atlantic City to Myrtle Beach.Historically, the airlines has experienced 0, 1, 2, or 3 no shows per flight on this route. Construct a decision table showing the costs associated with each combination of
Spirit Airlines has figured out that the probabilities of experiencing 0, 1, 2, and 3 no shows for the flight between Atlantic City and Myrtle Beach are 0.16, 0.32, 0.25, and 0.27 respectively.a. Choose the best number of passengers to overbook between these two destinations.b. What is the most
Using the decision table for this problem, choose the best decision for Texas Oil using the following criterion:a. Maximaxb. Maximinc. Equally likelyd. Minimax regrete. Hurwicz using a = 0.4 Texas Oil owns a parcel of land that has the potential for containing much oil, some oil, or no oil
Based on historical data from the surrounding area, Texas Oil has assessed the probabilities of much, some, and no oil to 0.1, 0.3, and 0.6 respectively.a. Choose the best option for Texas Oil using the probability data.b. What is the most Texas Oil should pay for additional information about the
Texas Oil can do a geological test that costs $100,000 to determine the likelihood of finding oil underground. The results of the test can be positive, undecided, or negative with the probability of each being 0.12, 0.31, and 0.57 respectively.If the geological test comes back positive, the
Texas Oil can do a geological test that costs $100,000 to determine the likelihood of finding oil underground. The results of the test can be positive, undecided, or negative.If there is much oil underground, the probabilities of the test being positive, undecided, and negative are as
Consider the following sample data:6 19 14 5 16 14 10 Using a = 0.05, perform a hypothesis test to determine if the population median from which this sample has been drawn exceeds 10.AppendixLO1
Consider the following sample data:18 19 29 28 14 19 40 11 Using a = 0.05, perform a hypothesis test to determine if the population median from which this sample has been drawn equals 20.AppendixLO1
Using a = 0.10, perform a hypothesis test to determine if the population median is less than 25 using the following sample information.Data Value Number of Occurrences Below 25 36 Equal to 25 3 Above 25 15 AppendixLO1
Using a = 0.10, perform a hypothesis test to determine if the population median is equal to 40 using the following sample information.Data Value Number of Occurrences Below 40 18 Equal to 40 2 Above 40 27 AppendixLO1
Customers were asked if they prefer Product A or Product B. The results are as follows.Preference Number of Customers A 28 B 14 No preference 8 Using a = 0.05, perform a hypothesis test to determine if consumers prefer one product to the other.AppendixLO1
H&R Block, a tax preparation company, believes that the median tax refund for 2014 was greater than $3,000. To test this belief, the following random sample of 2014 refunds was collected. These data can also be found in the Excel file H&R Block.xlsx.$2,278 $4,116 $228 $5,988 $3,966$684 $3,398
AutoTrader.com claims that the median selling price of used cars during 2014 was $9,275. To test this claim, the following random sample of 2014 used car sales was collected.These data can also be found in the Excel file AutoTrader.xlsx.$14,840 $2,660 $7,800 $7,640 $10,750 $4,325 6,280 $21,100
Suppose Starbucks would like to determine if the median age of its customers is 42. The ages of 50 randomly sampled customers were recorded in the following table.Customer’s Age Number of Customers Below 42 30 Equal to 42 4 Above 42 16 Using a = 0.10, perform a hypothesis test to determine if the
Bob and Deb (no relation to your author) would like to retire someday and are considering relocating to cities where universities are present. Housing prices are a key factor in the decision. Bob, who happens to know a few things about statistics, would like to determine if the median selling price
To help with its next advertising campaign, Nike would like to know which activity fans prefer: watching professional basketball games (NBA) or watching college basketball games (NCAA). The following data show the preferences of a random sample of sports fans.Fan Preference Fan Preference 1 NCAA 9
Consider the following data from two independent samples:Sample A: 19 20 25 31 21 22 24 Sample B: 73 34 12 66 21 60 58 52 Perform a hypothesis test using a = 0.05 to determine if the population from which Sample B was drawn has a higher median than Sample A’s population.AppendixLO1
Consider the following data from two independent samples:Sample A: 54 28 61 54 10 64 82 Sample B: 93 73 46 61 62 67 Perform a hypothesis test using a = 0.05 to determine if the population from which Sample B was drawn has a different median than Sample A’s population.AppendixLO1
Consider the following data from two independent samples. These data can also be found in the Excel file Prob1813.xlsx.Sample A Sample B 32 30 17 79 18 16 45 31 22 29 35 35 28 30 34 56 31 41 42 56 31 18 49 Perform a hypothesis test using a = 0.05 to determine if the population from which Sample B
Consider the following data from two independent samples. These data can also be found in the Excel file Prob1814.xlsx.Sample A Sample B 22 30 54 50 18 5 46 57 47 44 10 51 25 33 39 49 51 41 29 36 22 40 44 39 9Perform a hypothesis test using a = 0.10 to determine if the population from which Sample
Suppose the National Foundation for Credit Counseling(NFCC) would like to determine if the median credit card debt for individuals ages 50 years or older exceeds the debt of those younger than 50 years. A random sample from each group was selected, and the credit card debt of each person is as
Michael Smith would like to open a new charter grade school and is considering Berks County or Chester County as possible locations. The annual household incomes in each county are a factor. Michael collected a random sample of household incomes for both counties.They are as follows (in thousands
The following data represent a random sample of annual profit-sharing bonuses paid to Ford and GM hourly employees last year. These data can also be found in the Excel file profit sharing.xlsx.Ford ($) GM ($)6,600 7,400 5,500 5,400 4,000 8,600 7,400 5,700 7,700 5,300 5,800 4,400 9,200 3,700 5,000
Suppose the U.S. Department of Labor would like to determine if construction workers in the Northeast work more hours per week than construction workers in the Southeast do. A random sample of workers in each region was selected, and the number of hours these people worked was recorded and is as
The following table shows the annual salaries, in thousands of dollars, earned by individuals who graduated with MBAs in 2012 and 2013. These data can also be found in the Excel file graduate salaries.xlsx.2012 Graduates ($) 2013 Graduates ($) 64.9 55.5 59.4 64.6 48.0 70.7 74.8 44.4 62.5 52.9 55.0
The following two samples were collected as matched pairs.Pair 1 2 3 4 5 6 7 Sample A 15 19 11 20 18 10 8 Sample B 12 10 14 6 14 8 6 Perform a hypothesis test using a = 0.05 to determine if the population represented by Sample A has higher values than the population represented by Sample
The following two samples were collected as matched pairs.Pair 1 2 3 4 5 6 7 8 Sample A 4 16 9 15 6 8 20 17 Sample B 17 12 10 16 1 8 9 10 Perform a hypothesis test using a = 0.05 to determine if the population represented by Sample B has lower values than the population represented by Sample
The following two samples were collected as matched pairs.Pair 1 2 3 4 5 6 7 8 Sample A 18 12 16 11 9 7 11 8 Sample B 14 2 6 6 1 8 4 4 Perform a hypothesis test using a = 0.10 to determine if the population represented by Sample A is different than the population represented by Sample B.AppendixLO1
The following two samples were collected as matched pairs.Pair 1 2 3 4 5 6 7 Sample A 15 7 12 9 9 7 16 Sample B 8 2 6 8 5 8 11 Perform a hypothesis test using a = 0.05 to determine if the population represented by Sample A is different than the population represented by Sample
According to Harrell Associates, a provider of research for airfare benchmarking, the lowest fares for airline tickets between the United States and Europe occur two months before a flight’s departure date. To test this claim, a random sample of seven flights to Europe was selected.The airfare
Suppose Hotels.com would like to determine if daily hotel rates in Orlando, Florida, are different on Thanksgiving Day than they are on New Year’s Day. To test this, a random sample of hotel rooms in Orlando was selected. The room rates were recorded on both days and are as follows. These data
Deb’s Creamery is a retail store that serves a variety of ice cream flavors. The owner would like to add a flavor to the menu and needs to decide between Blueberry Cheesecake and Lemon Custard. To help her decide, she randomly selects 10 customers and asks them to taste each flavor and rate them
ESPN would like to determine if the number of hours fantasy-football players spend during the week managing their teams has increased since last year. A random sample of players was chosen, and the number of hours they spent managing their teams was recorded during the first week of the 2012
Consider the following data collected from three independent populations. These data can also be found in the Excel file Prob 1828.xlsx.Sample 1 Sample 2 Sample 3 3 14 21 8 9 15 6 13 16 5 10 14 7 17 20 Perform a hypothesis test using a = 0.05 to determine if there is a difference in the populations
Consider the following data collected from three independent populations. These data can also be found in the Excel file Prob 1829.xlsx.Sample 1 Sample 2 Sample 3 19 21 15 5 26 13 8 14 12 11 19 17 10 10 16 18 24 Perform a hypothesis test using a = 0.05 to determine if there is a difference in the
Consider the following data collected from four independent populations. These data can also be found in the Excel file Prob 1830.xlsx.Sample 1 Sample 2 Sample 3 Sample 4 26 13 4 13 15 18 11 20 22 10 12 21 17 10 14 7 19 10 23 17 Perform a hypothesis test using a = 0.05 to determine if there is a
Suppose Orbitz would like to determine if the median airfares to Orlando, New York, and Los Angeles are different on Christmas Day. Random samples of Christmas Day airfares to these three cities were collected and are as follows. These data can also be found in the Excel file Orbitz.xlsx.Orlando
The following data are the selling prices, in thousands of dollars, of random samples of existing homes in three different regions of the United States. These data can also be found in the Excel file Midwest.xlsx.Midwest ($) Northeast ($) South ($)261 235 133 169 175 138 128 210 298 153 255 222 179
Because of the popularity of National Football League(NFL) games, tickets can be difficult to acquire if you are not a season ticket holder. Many people buy NFL tickets on the secondary market when the owners of season tickets to the games sell them. Suppose the NFL would like to determine if the
Suppose TurboTax, a developer of tax preparation software, would like to determine if the median state tax refund in 2013 differs among various regions of the country.A random sample of taxpayer refunds from Maryland, California, Louisiana, and Ohio were recorded and are as follows. These data can
Consider the following ordered pairs.Variable 1: 4 7 2 6 6 8 Variable 2: 6 9 4 5 7 10 Calculate the Spearman rank-order correlation coefficient.AppendixLO1
Perform a hypothesis test with the data from Problem 18.35 to determine if the population rank correlation coefficient is not equal to zero using a = 0.05.AppendixLO1
Consider the following ordered pairs.Variable 1: 7 6 2 3 8 8 10 Variable 2: 6 1 9 6 8 3 4 Calculate the Spearman rank-order correlation coefficient.AppendixLO1
Using a = 0.05, perform a hypothesis test with the data from Problem 18.35 to determine if the population rank correlation coefficient is less than zero.Applications AppendixLO1
The Human Resource Department at Neumann University would like to examine the relationship between a faculty member’s performance rating (measured on a scale of 1–20) and his or her annual salary increase. The following table shows these data for eight randomly selected faculty members. These
Suppose the Internet retailer Buy.com would like to investigate the relationship between the amount of time in minutes a purchaser spends on its Web site and the amount of money he or she spends on an order. The following table shows the data from a random sample of 12 customers. These data can
Suppose the U.S. Environmental Protection Agency (EPA)would like to investigate the relationship between the engine sizes of sedans and the miles per gallon (MPG) they get. The following table shows the engine size in cubic liters and rated miles per gallon for a selection of 2013 sedans. These
Comcast’s customer service department asks its customers to rate their over-the-phone service on a scale of 1–20 immediately after their service has been completed. The company then matches each customer’s rating with the number of minutes the person waited on hold. The following table shows
Suppose Consumer Reports would like to investigate the relationship between the battery life (in hours) and the screen size (in diagonal inches) of a laptop computer. The following table shows a random sample of eight laptops and the battery life and corresponding screen size of each. These data
First-time home buyers are an important segment of the housing market because this group allows current homeowners to sell their home and purchase another. In 2012, the median age of first-time homebuyers was 31 years old. To find out if the housing market is improving, suppose the Federal Housing
As a measure of productivity, Verizon Wireless records the number of customers each of its retail employees activates weekly. An activation is defined as either a new customer signing a cell phone contract or an existing customer renewing a contract. The following table shows the number of weekly
Suppose the Institute for College Access & Success would like to determine if there is a difference in the median amount of student-loan debt accrued by 2013 graduates in the states of California, Arizona, Pennsylvania, and Minnesota.A random sample of 2013 students from each state was selected and
In an effort to deal with the most recent budget crisis, the federal government has considered limiting the amount of mortgage interest taxpayers can deduct. Suppose the IRS would like to determine if the median mortgage interest deduction per taxpayer exceeded $10,000 for 2013. The following table
A newborn with serious health issues is often admitted to a neonatal intensive care unit, or NICI, and requires constant care, usually for many weeks. The cost for this treatment is very high and is usually billed to Medicaid. Suppose the personnel who administer Medicaid would like to determine if
Zagat surveys fliers on a 30-point scale to gauge their satisfaction with the comfort, service, and food on domestic and international flights. The following average scores for various airlines were collected between September 21 and October 10, 2013. These data can also be found in the Excel file
Pearson Education, a publisher of college textbooks, would like to know if students prefer traditional textbooks or digital textbooks. A random sample of students was asked their preference and the results are shown in the following table.Preference Number of Students Traditional 63 Digital 36 No
According to student-loan provider Sallie Mae, the median amount of money borrowed by a student for college during the 2011–2012 academic year was $7,874. Suppose Sallie Mae would like to determine if there was an increase in the median amount borrowed for the following academic year.The
A regional manager at Acme Markets would like to develop a model to predict the weekly sales of pet food based on the shelf space allotted to the food. The following table shows the results of data collected from nine randomly selected stores.These data can also be found in the Excel file
Suppose the U.S. Bureau of Economic Analysis would like to determine if the median selling price of new domestic cars is less than the median price of new imported cars. A random sample of both types of cars was collected, and their selling prices, in thousands of dollars, were as follows. These
The following table shows the weight of randomly selected packages shipped by FedEx, UPS, and DHL. These data can also be found in the Excel file package weight.xlsx.FedEx UPS DHL 13.7 9.8 0.7 20.2 13.0 4.0 11.9 5.3 5.7 6.1 7.7 2.0 2.8 14.8 22.8 12.5 8.6 3.7 4.1 1.6 0.4 11.6 7.2 9.8 Using a = 0.05,
Suppose the Graduate Management Admission Council(GMAC) would like to determine if the median starting salary for MBA students graduating from two-year programs is different than the median starting salary for MBA students graduating from one-year programs. A random sample of graduating students
Suppose the U.S. Department of Education would like to determine if the median annual tuition for a four-year public college equaled $8,000 in 2014. A random sample of these colleges was selected and their annual tuitions were as follows.These data can also be found in the Excel file
Suppose I recorded the attendance of my students in a recent statistics class because I wanted to investigate the relationship between the number of classes they missed and their final grades. The following table shows the data for a random sample of nine students. These data can also be found in
As the pace of college football has increased over the years, the number of plays per game appears to have increased. To test this theory, random samples of college football games were selected from the 2006 season as well as the 2012 season. The total number of plays made in each game was counted
The Small Business Administration (SBA) is a governmentrun organization that oversees the microloan program for small businesses. Microloans are small, short-term loans that are less than $25,000 with less than a six-year term.Due to tougher credit guidelines, the SBA is concerned that microloan
The following sample data show, in square feet, the size of newly constructed single homes in 2005 versus 2013.These data can also be found in the Excel file new construction.xlsx.2005 2013 2,620 2,860 2,310 2,130 2,740 2,440 1,860 2,380 2,860 1,590 1,630 2,640 2,180 2,880 2,280 1,790 2,750 3,300
Fair Isaac, the company that developed the credit-score model used by most lenders today, would like to examine the relationship between the age and credit score of an individual.The following table shows the credit scores and ages of 10 randomly selected people. These data can also be found in the
A critical factor in the successful operation in today’s hospital system is the effective staffing of emergency room (ER) personnel. In an effort to examine this issue, Wilmington Hospital would like to determine if the average number of emergency room visits differs across the hospital’s three
The following data represent the times recorded by nine 100-yard backstroke swimmers, in seconds, before and after they participated in a new training program. These data can also be found in the Excel file backstroke.xlsx.Swimmer 1 2 3 4 5 6 7 8 9 Before 75 76 67 72 73 66 63 72 69 After 71 74 65
The University of Delaware would like to describe the relationship between the GPA and the starting monthly salary of a graduate who earned a business degree from the university.The following table shows the monthly starting salaries for eight graduates of the business school along with their
The following data represent the math SAT scores for a random sample of seniors from three different high schools.These data can also be found in the Excel file SAT.xlsx.School A School B School C 488 445 618 592 370 525 537 382 651 470 423 647 539 523 543 Using a = 0.05, perform a hypothesis test
A manufacturing company conducted a safety awareness program at 10 different production facilities. The following data represent the number of man-hours lost over a onemonth period at each facility before and after the program.These data can also be found in the Excel file safety.xlsx.Facility A B
According to Reis Inc., a real estate data firm, the median monthly apartment rent in the United States in October 2012 was $1,044. Suppose the manager of an apartment complex would like to test this report by taking a random sample of apartment rents. The data for this sample are as
A low-profile tire is an automobile tire that has a short sidewall height, which is the distance between the tire rim and the road. These tires provide better performance at the expense of gas mileage. The Ford Taurus was chosen to measure the effect these tires have on a car’s gas mileage.Eleven
The following table shows the selling prices, in thousands of dollars, and the square footages of seven randomly selected houses recently sold by Century 21 Realtors. These data can also be found in the Excel file Century 21.xlsx.Selling Price ($) Square Footage 258 2730 191 1860 253 2140 168 2180
Citibank, which has a major credit card division, has designed a promotion designed to encourage its customers to increase their current credit card usage. To test the effectiveness of this promotion, Citibank monitored the monthly credit card balances of 25 customers before and after the promotion
Consider the following set of dependent and independent variables. These data can also be found in the Excel file Prob 151.xlsx.y 10 11 15 15 20 24 27 32 x1 2 5 5 9 7 11 16 20 x2 16 10 13 10 2 8 7 4a. Using PHStat, construct a multiple regression model with these data.b. Interpret the meaning of
Consider the following set of dependent and independent variables. These data can also be found in the Excel file Prob 152.xlsx.y 47 42 40 40 31 26 23 18 10 x1 74 63 78 52 44 47 35 17 15 x2 22 29 20 17 13 17 8 15 10a. Using PHStat, construct a multiple regression model with these data.b. Interpret
Use the sample data from Problem 15.1 to answer the following questions:a. Construct a 95% confidence interval for the dependent variable when x1 = 7 and x2 = 14.b. Interpret the meaning of the interval constructed in part a.c. Construct a 95% prediction interval for the dependent variable when x1
Use the sample data from Problem 15.2 to answer the following questions:a. Construct a 90% confidence interval for the dependent variable when x1 = 30 and x2 = 20.b. Interpret the meaning of the interval constructed in part a.c. Construct a 90% prediction interval for the dependent variable when x1
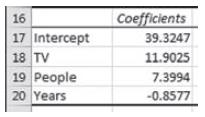
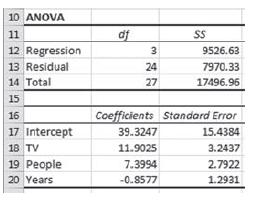
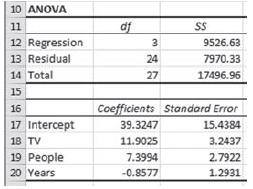
Comcast would like to develop the ability to predict the monthly cable bill for a customer. A multiple regression model was developed using a random sample of customers using the following independent variables:TV: the number of televisions in the household People: the number of people living in
Consider the following set of dependent and independent variables. These data can also be found in the Excel file Prob 151.xlsx.y 10 11 15 15 20 24 27 32 x1 2 5 5 9 7 11 16 20 x2 16 10 13 10 2 8 7 4a. Using PHStat, identify the SST, SSR, and SSE.b. Calculate the multiple coefficient of
Consider the following set of dependent and independent variables. These data can also be found in the Excel file Prob 153.xlsx.y 47 42 40 40 31 26 23 18 10 x1 74 63 78 52 44 47 35 17 15 x2 22 29 20 17 13 17 8 15 10a. Using PHStat, identify the SST, SSR, and SSE.b. Calculate the multiple
Consider the following ANOVA table for a multiple regression model:Source df SS MS F Regression 4 1,600 400 10 Residual 30 1,200 40 Total 34 2,800a. What is the size of this sample?b. How many independent variables are in this model?c. Calculate the multiple coefficient of determination.d. Test the
Consider the following ANOVA table for a multiple regression model:Source df SS MS F Regression 3 Residual 7,000 Total 53 9,100a. Complete the remaining entries in the table.b. What is the size of this sample?c. How many independent variables are in this model?d. Calculate the multiple coefficient
Jersey Shore Realtors would like to develop a regression model to help it set weekly rental rates for beach properties during the summer season in New Jersey. The independent variables for this model are the number of bedrooms a property has, its age in years, and the number of blocks away from the
A business statistics professor at State College would like to develop a regression model to predict the final exam scores for students based on their current GPAs, the number of hours they studied for the exam, and the number of times they were absent during the semester. The data for these
City Hospital would like to develop a regression model to predict the total hospital bill for a patient based on his or her length of stay, number of days in the hospital’s intensive care unit (ICU), and age of the patient. Data for these variables can be found in the Excel file City
Comcast would like to develop the ability to predict the monthly cable bill for a customer. A multiple regression model was developed using a random sample of customers using the following independent variables:TV: the number of televisions in the household People: the number of people living in
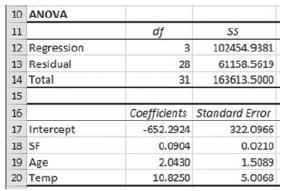
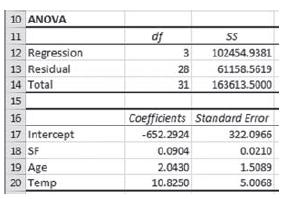
Delmarva Power is a utility company that would like to predict the monthly heating bill for a household in Kent County during the month of January. A random sample of households in the county was selected and their January heating bill recorded along with the following variables:SF: the square
Consider the following set of dependent and independent variables. These data can also be found in the Excel file Prob 151.xlsx.y 10 11 15 15 20 24 27 32 x1 2 5 5 9 7 11 16 20 x2 16 10 13 10 2 8 7 4a. Using PHStat, construct a regression model using both independent variables.b. Test the
Consider the following set of dependent and independent variables. These data can also be found in the Excel file Prob 153.xlsx.y 47 42 40 40 31 26 23 18 10 x1 74 63 78 52 44 47 35 17 15 x2 22 29 20 17 13 17 8 15 10a. Using PHStat, construct a regression model using both independent variables.b.
Use the data from Problem 15.23 to answer the following questions:a. Construct a 95% confidence interval for the regression coefficient for x1 and interpret its meaning.b. Construct a 95% confidence interval for the regression coefficient for x2 and interpret its meaning.AppendixLO1
Use the data from Problem 15.24 to answer the following questions:a. Construct a 90% confidence interval for the regression coefficient for x1 and interpret its meaning.b. Construct a 90% confidence interval for the regression coefficient for x2 and interpret its meaning.Applications AppendixLO1
City Hospital would like to develop a regression model to predict the total hospital bill for a patient based on his or her length of stay, number of days in the hospital’s intensive care unit (ICU), and age of the patient. Data for these variables can be found in the Excel file City
Comcast would like to develop the ability to predict the monthly cable bill for a customer. A multiple regression model was developed using a random sample of customers using the following independent variables:TV: the number of televisions in the household People: the number of people living in
Delmarva Power is a utility company that would like to predict the monthly heating bill for a household in Kent County during the month of January. A random sample of households in the county was selected and their January heating bill recorded along with the following variables:SF: the square
Showing 4800 - 4900
of 8575
First
42
43
44
45
46
47
48
49
50
51
52
53
54
55
56
Last
Step by Step Answers