New Semester
Started
Get
50% OFF
Study Help!
--h --m --s
Claim Now
Question Answers
Textbooks
Find textbooks, questions and answers
Oops, something went wrong!
Change your search query and then try again
S
Books
FREE
Study Help
Expert Questions
Accounting
General Management
Mathematics
Finance
Organizational Behaviour
Law
Physics
Operating System
Management Leadership
Sociology
Programming
Marketing
Database
Computer Network
Economics
Textbooks Solutions
Accounting
Managerial Accounting
Management Leadership
Cost Accounting
Statistics
Business Law
Corporate Finance
Finance
Economics
Auditing
Tutors
Online Tutors
Find a Tutor
Hire a Tutor
Become a Tutor
AI Tutor
AI Study Planner
NEW
Sell Books
Search
Search
Sign In
Register
study help
business
elementary statistics
Elementary Statistics Using Excel Pearson New 5th Edition Mario F Triola - Solutions
The Empirical Rule Based on Data Set 1 in Appendix: Data Sets, blood platelet counts of women have a bell-shaped distribution with a mean of 280 and a standard deviation of 65.(All units are 1000 cells/mL.) Using the empirical rule, what is the approximate percentage of women with platelet countsa.
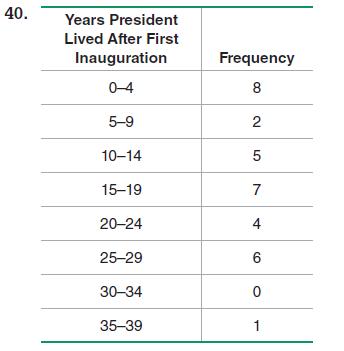
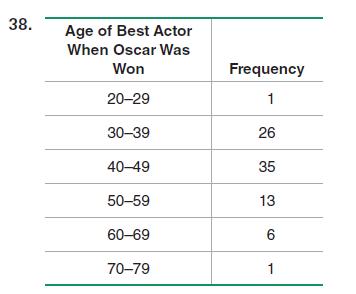
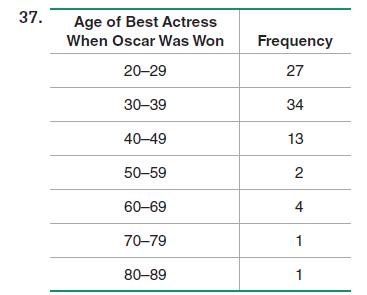
Finding Standard Deviation from a Frequency Distribution. In Exercises 37–40, find the standard deviation of sample data summarized in a frequency distribution table by using the formula below, where x represents the class midpoint, f represents the class frequency, and n represents the total
Finding Standard Deviation from a Frequency Distribution. In Exercises 37–40, find the standard deviation of sample data summarized in a frequency distribution table by using the formula below, where x represents the class midpoint, f represents the class frequency, and n represents the total
Finding Standard Deviation from a Frequency Distribution. In Exercises 37–40, find the standard deviation of sample data summarized in a frequency distribution table by using the formula below, where x represents the class midpoint, f represents the class frequency, and n represents the total
Weights of Pepsi Based on Data Set 19 in Appendix: Data Sets, cans of regular Pepsi have weights with a mean of 0.82410 lb and a standard deviation of 0.00570 lb. Is it unusual for a can to contain 0.8133 lb of Pepsi? Explain.
Volumes of Coke Based on Data Set 19 in Appendix: Data Sets, cans of regular Coke have volumes with a mean of 12.19 oz and a standard deviation of 0.11 oz. Is it unusual for a can to contain 11.9 oz of Coke? Explain.
Pulse Rates of Males Based on Data Set 1 in Appendix: Data Sets, males have pulse rates with a mean of 67.3 beats per minute and a standard deviation of 10.3 beats per minute.Is it unusual for a male to have a pulse rate of 45 beats per minute? (All of these pulse rates are measured at rest.)
Pulse Rates of Females Based on Data Set 1 in Appendix: Data Sets, females have pulse rates with a mean of 77.5 beats per minute and a standard deviation of 11.6 beats per minute. Is it unusual for a female to have a pulse rate of 99 beats per minute? (All of these pulse rates are measured at
Exercise 28Estimating Standard Deviation with the Range Rule of Thumb. In Exercises 29–32, refer to the data in the indicated exercise. After finding the range of the data, use the range rule of thumb to estimate the value of the standard deviation. Compare the result to the standard deviation
Exercise 27Estimating Standard Deviation with the Range Rule of Thumb. In Exercises 29–32, refer to the data in the indicated exercise. After finding the range of the data, use the range rule of thumb to estimate the value of the standard deviation. Compare the result to the standard deviation
Exercise 26Estimating Standard Deviation with the Range Rule of Thumb. In Exercises 29–32, refer to the data in the indicated exercise. After finding the range of the data, use the range rule of thumb to estimate the value of the standard deviation. Compare the result to the standard deviation
Exercise 25Estimating Standard Deviation with the Range Rule of Thumb. In Exercises 29–32, refer to the data in the indicated exercise. After finding the range of the data, use the range rule of thumb to estimate the value of the standard deviation. Compare the result to the standard deviation
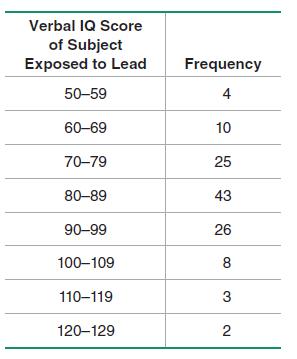
IQ Scores: Refer to Data Set 6 in Appendix: Data Sets and use the listed IQ scores.
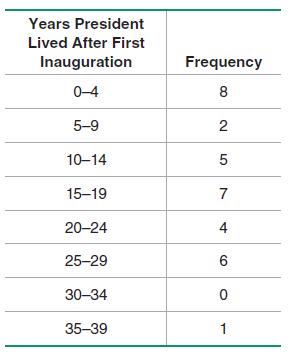
Presidential Longevity: Refer to Data Set 12 in Appendix: Data Sets and use the numbers of years that U.S. presidents have lived after their first inauguration.
Flight Data: Refer to Data Set 15 in Appendix: Data Sets and use the times required to taxi out for takeoff.
Earthquakes: Use the magnitudes (Richter scale) of the earthquakes listed in Data Set 16 in Appendix: Data Sets.
Customer Waiting Times Waiting times (in minutes) of customers at the Jefferson Valley Bank (where all customers enter a single waiting line) and the Bank of Providence (where customers wait in individual lines at three different teller windows) are listed below.Jefferson Valley (single line): 6.5
Political Contributions Listed below are contributions (in dollars) made to the two presidential candidates in the most recent election. All contributions are from the same Zip code as the author, and the data are from the Huffington Post.Obama: +275 +452 +300 +1000 +1000 +500 +100 +1061 +1200 +235
Parking Meter Theft Listed below are amounts (in millions of dollars) collected from parking meters by Brinks and others in New York City during similar time periods. A larger data set was used to convict five Brinks employees of grand larceny. The data were provided by the attorney for New York
Speeding and Race Listed below are speeds (in mi/h) of cars on the New Jersey Turnpike by race of the driver. All cars are going in the same direction, and all of the cars are from New Jersey. The data are from Statlib and the authors are Joseph Kadane and John Lamberth.White drivers: 74 77 69 71
Phenotypes of Peas Biologists conducted experiments to determine whether a deficiency of carbon dioxide in the soil affects the phenotypes of peas. Listed below are the phenotype codes, where 1 = smooth@ yellow, 2 = smooth @green, 3 = wrinkled @yellow, and 4 = wrinkled @green. Can the measures of
Saints in Super Bowl Listed below are the numbers on the jerseys of the starting lineup for the New Orleans Saints when they recently won their first Super Bowl football game.What do the measures of variation tell us about the team? Does it make sense to compute the measures of variation for these
JFK to LAX Flight Delays Listed below are the arrival delay times (in minutes) of randomly selected American Airline flights from New York’s JFK airport to Los Angeles (LAX).Negative values correspond to flights that arrived early before the scheduled arrival time, and positive values represent
Cell Phone Radiation Listed below are the measured radiation emissions (in W/kg)corresponding to these cell phones: Samsung SGH-tss9, Blackberry Storm, Blackberry Curve, Motorola Moto, T-Mobile Sidekick, Sanyo Katana Eclipse, Palm Pre, Sony Ericsson, Nokia 6085, Apple iPhone 3G S, and Kyocero Neo
Years to Earn Bachelor’s Degree Listed below are the lengths of time (in years) it took for a random sample of college students to earn bachelor’s degrees (based on data from the National Center for Education Statistics). Based on these results, is it unusual for someone to earn a bachelor’s
Mercury in Sushi Listed below are the amounts of mercury (in parts per million, or ppm) found in tuna sushi sampled at different stores in New York City. The study was sponsored by the New York Times, and the stores (in order) are D’Agostino, Eli’s Manhattan, Fairway, Food Emporium, Gourmet
What would be the values of the measures of variation if the medicines contained no lead?3.0 6.5 6.0 5.5 20.5 7.5 12.0 20.5 11.5 17.5
Lead in Medicine Listed below are the lead concentrations (in mg/g) measured in different Ayurveda medicines. Ayurveda is a traditional medical system commonly used in India.The lead concentrations listed here are from medicines manufactured in the United States.The data are based on the article
CEO Compensation Listed below are the recent annual compensation amounts for these chief executive officers: Mulally (Ford), Jobs (Apple), Kent (Coca-Cola), Otellini (Intel), and McNerney (Boeing). The data are from the Associated Press. What is particularly notable about these compensation
Ghost Prices Listed below are the prices listed for Norton Ghost 14.0 software from these vendors: Newegg, Dell, Buycheapsoftware.com, PC Connection, Walmart, and Overstock.com.When trying to find the best deal, how helpful are the measures of variation?+55.99 +69.99 +48.95 +48.92 +71.77 +59.68
Florida Manatee Deaths Listed below are the numbers of manatee deaths caused each year by collisions with watercraft. Manatees, also called “sea cows,” are large mammals that live underwater, often in or near waterways. The data are listed in order for each year of the past decade. The data are
Harry Potter Listed below are the gross amounts (in millions of dollars) earned in box office receipts for the movie Harry Potter and the Half-Blood Prince. The movie opened on a Wednesday, and the amounts are listed in order for the first 14 days of the movie’s release. If you invested in this
Tests of Child Booster Seats The National Highway Traffic Safety Administration conducted crash tests of child booster seats for cars. Listed below are results from those tests, with the measurements given in “hic,” which is a measurement of a standard “head injury crite-hic. Do the different
Car Crash Test Measurements Listed below are head injury measurements from small cars that were tested in crashes. The measurements are in “hic,” which is a measurement of a standard “head injury criterion.” The data are from Data Set 13 in Appendix: Data Sets, which is based on data from
Top 10 Most Expensive Colleges Listed on the top of the next page are the annual tuition amounts of the 10 most expensive colleges in the United States for a recent year. The colleges listed in order are Sarah Lawrence, NYU, George Washington, Bates, Skidmore, Johns Hopkins, Georgetown, Connecticut
Top 10 Celebrity Incomes Listed below are the earnings (in millions of dollars) of the celebrities with the 10 highest incomes in a recent year. The celebrities in order are Steven Spielberg, Howard Stern, George Lucas, Oprah Winfrey, Jerry Seinfeld, Tiger Woods, Dan Brown, Jerry Bruckheimer, J. K.
Symbols Identify the symbols used for each of the following: (a) sample standard deviation; (b) population standard deviation; (c) sample variance; (d) population variance.
Variation and Variance In statistics, how do the terms variation and variance differ?
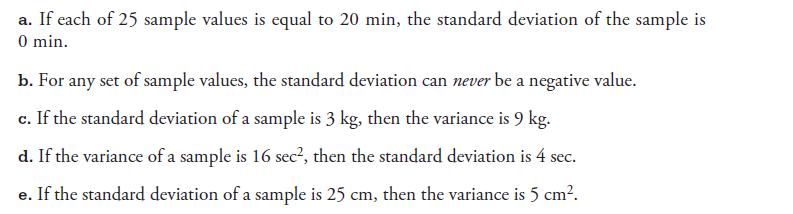
Correct Statements? Which of the following statements are true? a. If each of 25 sample values is equal to 20 min, the standard deviation of the sample is 0 min. b. For any set of sample values, the standard deviation can never be a negative value. c. If the standard deviation of a sample is 3 kg,
Comparing Variation Which do you think has less variation: the IQ scores of students in your statistics class or the IQ scores of a simple random sample taken from the general population? Why?
How does the result compare to the median found from the original list of data, which is 33.0 years? Which value of the median is better: the value computed using the frequency table or the value of 33.0 years?
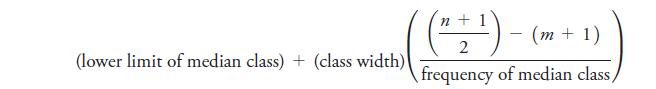
Median When data are summarized in a frequency distribution, the median can be found by first identifying the median class, which is the class that contains the median. We then assume that the values in that class are evenly distributed and we interpolate. Letting nn denote the sum of all class
How does the result compare to the mean?
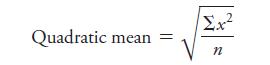
Quadratic Mean The quadratic mean (or root mean square, or R.M.S.) is usually used in physical applications. In power distribution systems, for example, voltage and currents are usually referred to in terms of their R.M.S. values. The quadratic mean of a set of values is obtained by squaring each
Geometric Mean The geometric mean is often used in business and economics for finding average rates of change, average rates of growth, or average ratios. Given n values (all of which are positive), the geometric mean is the nth root of their product. Find the average growth factor for money
Harmonic Mean The harmonic mean is often used as a measure of center for data sets consisting of rates of change, such as speeds. It is found by dividing the number of values n by the sum of the reciprocals of all values, expressed as n Σ1 x (No value can be zero.) The author drove 1163 miles to a
Trimmed Mean Because the mean is very sensitive to extreme values, we say that it is not a resistant measure of center. By deleting some low values and high values, the trimmed mean is more resistant. To find the 10% trimmed mean for a data set, first arrange the data in order, then delete the
Censored Data Data Set 12 in Appendix: Data Sets lists the numbers of years that U.S. presidents lived after their first inauguration. As of writing, five of the presidents are still alive and after their first inauguration they have lived 33 years, 21 years, 17 years, 9 years, and 1 year so far.
Degrees of Freedom Carbon monoxide is measured in San Francisco on five different days, and the mean of those five values is 0.62 parts per million. Four of the values (in parts per million) are 0.3, 0.4, 1.1, and 0.7. (The data are from the California Environmental Protection Agency.)a. Find the
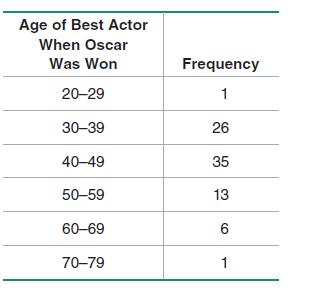
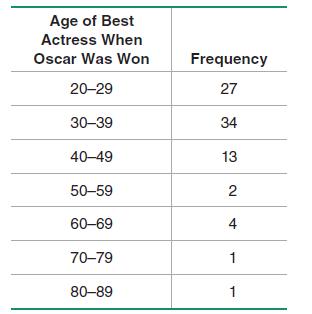
In Exercises 29–32, find the mean of the data summarized in the given frequency distribution.Also, compare the computed means to the actual means obtained by using the original list of data values, which are as follows: (Exercise 29) 35.9 years; (Exercise 30)44.1 years; (Exercise 31) 84.4;
In Exercises 29–32, find the mean of the data summarized in the given frequency distribution.Also, compare the computed means to the actual means obtained by using the original list of data values, which are as follows: (Exercise 29) 35.9 years; (Exercise 30)44.1 years; (Exercise 31) 84.4;
In Exercises 29–32, find the mean of the data summarized in the given frequency distribution.Also, compare the computed means to the actual means obtained by using the original list of data values, which are as follows: (Exercise 29) 35.9 years; (Exercise 30)44.1 years; (Exercise 31) 84.4;
In Exercises 29–32, find the mean of the data summarized in the given frequency distribution.Also, compare the computed means to the actual means obtained by using the original list of data values, which are as follows: (Exercise 29) 35.9 years; (Exercise 30)44.1 years; (Exercise 31) 84.4;
Does the sample mean suggest that the sample is consistent with the population?
IQ Scores: Refer to Data Set 16 in Appendix: Data Sets and use the listed IQ scores. It is often stated that the mean IQ of the population is
Presidential Longevity: Refer to Data Set 12 in Appendix: Data Sets and use the average number of years that U.S. presidents have lived after their first inauguration. What is the value of finding the mean of this data?
Flight Data: Refer to Data Set 15 in Appendix: Data Sets and use the times required to get to the airport. For American Airlines, how is it helpful to find the mean?
Earthquakes: Use the magnitudes (Richter scale) of the earthquakes listed in Data Set 16 in Appendix: Data Sets and explain how the San Francisco Bay Area was struck with an earthquake that measured 7.0 on the Richter scale. That earthquake occurred during the warm-up period for the start of the
Customer Waiting Times Waiting times (in minutes) of customers at the Jefferson Valley Bank (where all customers enter a single waiting line) and the Bank of Providence(where customers wait in individual lines at three different teller windows) are listed below.Determine whether there is a
Political Contributions Listed below are contributions (in dollars) made to the two presidential candidates in a recent election. All contributions are from the same Zip code as the author, and the data are from the Huffington Post. Do the contributions appear to favor either candidate? What do you
Parking Meter Theft Listed below are amounts (in millions of dollars) collected from parking meters by Brinks and others in New York City during similar time periods. A larger data set was used to convict five Brinks employees of grand larceny. The data were provided by the attorney for New York
Speeding and Race Listed below are speeds (in mi/h) of cars on the New Jersey Turnpike.All cars are going in the same direction, and all of the cars are from New Jersey. The speeds were measured with a radar gun and the researchers observed the races of the drivers.The data are from Statlib and the
Phenotypes of Peas Biologists conducted experiments to determine whether a deficiency of carbon dioxide in the soil affects the phenotypes of peas. Listed below are the phenotype codes, where 1 = smooth @ yellow, 2 = smooth@green, 3 = wrinkled@yellow, and 4 = wrinkled@green.Can the measures of
Saints in Super Bowl Listed below are the numbers on the jerseys of the starting lineup for the New Orleans Saints when they recently won their first Super Bowl football game.What do the measures of center tell us about the team? Does it make sense to compute the measures of center for these data?9
JFK to LAX Flight Delays Listed below are the arrival delay times (in minutes) of randomly selected American Airline flights from New York’s JFK airport to Los Angeles (LAX).Negative values correspond to flights that arrived early before the scheduled arrival time, and positive values represent
Cell Phone Radiation Listed below are the measured radiation emissions (in W/kg) corresponding to these cell phones: Samsung SGH-tss9, Blackberry Storm, Blackberry Curve, Motorola Moto, T-Mobile Sidekick, Sanyo Katana Eclipse, Palm Pre, Sony Ericsson, Nokia 6085, Apple iPhone 3G S, and Kyocero Neo
Years to Earn Bachelor’s Degree Listed below are the lengths of time (in years) it took for a random sample of college students to earn bachelor’s degrees (based on data from the National Center for Education Statistics). Based on these results, does it appear that it is common to earn a
Mercury in Sushi Listed below are the amounts of mercury (in parts per million, or ppm)found in tuna sushi sampled at different stores in New York City. The study was sponsored by the New York Times and the stores (in order) are D’Agostino, Eli’s Manhattan, Fairway, Food Emporium, Gourmet
What do the results suggest about the safety of these medicines? What do the decimal values of the listed amounts suggest about the precision of the measurements?3.0 6.5 6.0 5.5 20.5 7.5 12.0 20.5 11.5 17.5
Lead in Medicine Listed below are the lead concentrations (in mg/g) measured in different Ayurveda medicines. Ayurveda is a traditional medical system commonly used in India. The lead concentrations listed here are from medicines manufactured in the United States. The data are based on the article
CEO Compensation Listed below are recent annual compensation amounts for these chief executive officers: Mulally (Ford), Jobs (Apple), Kent (Coca-Cola), Otellini (Intel), and McNerney (Boeing). The data are from the Associated Press. What is particularly notable about these compensation
Ghost Prices Listed below are the prices listed for Norton Ghost 14.0 software from these vendors: Newegg, Dell, Buycheapsoftware.com, PC Connection, Walmart, and Overstock.com. For this collection of data values, are any of the measures of center the most important statistic? Is there a different
Florida Manatee Deaths Listed below are the numbers of manatee deaths caused each year by collisions with watercraft. Manatees, also called “sea cows,” are large mammals that live underwater, often in or near waterways. The data are listed in order for each year of the past decade. The data are
Harry Potter Listed below are the gross amounts (in millions of dollars) earned in box office receipts for the movie Harry Potter and the Half-Blood Prince. The movie opened on a Wednesday, and the amounts are listed in order for the first 14 days of the movie’s release. What important feature of
Tests of Child Booster Seats The National Highway Traffic Safety Administration conducted crash tests of child booster seats for cars. Listed below are results from those tests, with the measurements given in “hic,” which is a measurement of a standard “head injury criterion. According to the
Car Crash Test Measurements Listed below are head injury measurements from small cars that were tested in crashes. The measurements are in “hic,” which is a measurement of a standard “head injury criterion.” The data are from Data Set 13 in Appendix: Data Sets, which is based on data from
Top 10 Most Expensive Colleges Listed below are the annual tuition amounts of the 10 most expensive colleges in the United States for a recent year. The colleges listed in order are Sarah Lawrence, NYU, George Washington, Bates, Skidmore, Johns Hopkins, Georgetown, Connecticut College, Harvey Mudd,
Top 10 Celebrity Incomes Listed below are the earnings (in millions of dollars) of the celebrities with the 10 highest incomes in a recent year. The celebrities in order are Steven Spielberg, Howard Stern, George Lucas, Oprah Winfrey, Jerry Seinfeld, Tiger Woods, Dan Brown, Jerry Bruckheimer, J. K.
Measures of Center In what sense are the mean, median, mode, and midrange measures of “center”?
Median In an editorial, the Poughkeepsie Journal printed this statement: “The median price—the price exactly in between the highest and lowest— . . . .” Does that statement correctly describe the median? Why or why not?
Average The web site IncomeTaxList.com lists the “average” annual income for California as $44,400. What is the role of the term average in statistics? Should another term be used in place of average?
Employment Data Listed below are results from the National Health and Nutrition Examination.1 3 3 2 1 1 1 7 9 1 1 1 4 4 These results indicate the working status of the person being surveyed, and the listed values represent these responses: 1 = Working; 2 = With a job but not at work;3 = Looking
If you know only the class limits given in Exercise 1 and the frequency of 51, can you identify the original 51 data values?
The first class described in Exercise 1 has a frequency of
Using the same first two classes from Exercise 1, identify the class boundaries of the first class.
When one is constructing a table representing the frequency distribution of weights (lb)of discarded textile items from Data Set 23 in Appendix: Data Sets, the first two classes of a frequency distribution are 0.00–0.99 and 1.00–1.99. What is the class width?
Using the body temperatures from 12 am on Day 2 listed in Data Set 3 of Appendix: Data Sets, the first three rows of an expanded stemplot have stems of 96 (for leaves between 5 and 9 inclusive), 97 (for leaves between 0 and 4 inclusive), and 97 (for leaves between 5 and 9 inclusive). Construct the
Expanded and Condensed Stemplotsa. A stemplot can be expanded by subdividing rows into those with leaves having digits of 0 through 4 and those with leaves having digits 5 through
Back-to-Back Stemplots Exercise 19 in Section 3 used back-to-back relative frequency histograms for the ages of actresses and actors that are listed in Data Set 11 of Appendix: Data Sets. Use the same method to construct back-to-back stemplots of the ages of actresses and actors, and then use the
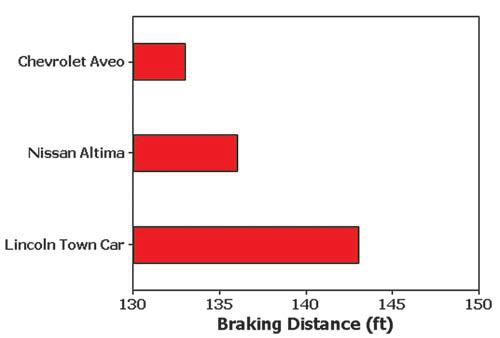
Braking Distance Data Set 14 in Appendix: Data Sets lists braking distances (ft) of different cars, and the braking distances of three of those cars are shown in the accompanying illustration. Chevrolet Aveo - Nissan Altima Lincoln Town Car - 130 135 140 145 150 Braking Distance (ft)
Oil Consumption China currently consumes 7.6 million barrels of oil per day, compared to the United States oil consumption of 20.7 million barrels of oil per day. In the accompanying illustration, the larger barrel is about three times as wide and three times as tall as the smaller barrel.
Subway Fare In 1986, the New York City subway fare cost $1, and as of this writing, it now costs $2, so the price doubled. In the accompanying graph, the $2 bill is twice as long and twice as tall as the $1 bill.
Election Results The accompanying graph depicts the numbers of votes (in millions) in the 2008 U.S. presidential election.
Earthquake Depths Use the frequency distribution from Exercise 24 in Section 2 to construct a frequency polygon. Applying a strict interpretation of the requirements for a normal distribution, do the depths appear to be normally distributed? Why or why not?
Earthquake Magnitudes Use the frequency distribution from Exercise 23 in Section 2 to construct a frequency polygon. Applying a loose interpretation of the requirements for a normal distribution, do the magnitudes appear to be normally distributed? Why or why not?
Does it make sense to use a pie chart for the given data?
School Day Use the data from Exercise
Awful Sounds Use the data from Exercise 15.
School Day Here are weekly instruction times for school children in different countries:23.8 hours (Japan), 26.9 hours (China), 22.2 hours (U.S.), 24.6 hours (U.K.), 24.8 hours(France). What do these results suggest about education in the United States?
Awful Sounds In a survey, 1004 adults were asked to identify the most frustrating sound that they hear in a day. In response 279 chose jackhammers, 388 chose car alarms, 128 chose barking dogs, and 209 chose crying babies (based on data from Kelton Research).
Showing 3300 - 3400
of 7930
First
27
28
29
30
31
32
33
34
35
36
37
38
39
40
41
Last
Step by Step Answers