New Semester
Started
Get
50% OFF
Study Help!
--h --m --s
Claim Now
Question Answers
Textbooks
Find textbooks, questions and answers
Oops, something went wrong!
Change your search query and then try again
S
Books
FREE
Study Help
Expert Questions
Accounting
General Management
Mathematics
Finance
Organizational Behaviour
Law
Physics
Operating System
Management Leadership
Sociology
Programming
Marketing
Database
Computer Network
Economics
Textbooks Solutions
Accounting
Managerial Accounting
Management Leadership
Cost Accounting
Statistics
Business Law
Corporate Finance
Finance
Economics
Auditing
Tutors
Online Tutors
Find a Tutor
Hire a Tutor
Become a Tutor
AI Tutor
AI Study Planner
NEW
Sell Books
Search
Search
Sign In
Register
study help
business
elementary statistics
Elementary Statistics Using Excel Pearson New 5th Edition Mario F Triola - Solutions
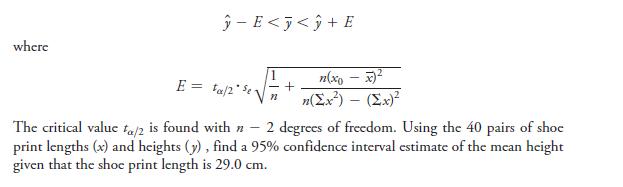
Confidence Interval for Mean Predicted Value Example 1 in this section illustrated the procedure for finding a prediction interval for an individual value of y. When using a specific value x0 for predicting the mean of all values of y, the confidence interval is as follows: where -E
Confidence Intervals for B0 and B1 Confidence intervals for the y-intercept b0 and slope b1 for a regression line ( y = b0 + b1x) can be found by evaluating the limits in the intervals below.The y-intercept b0 and the slope b1 are found from the sample data and ta>2 is found from Table 3 in
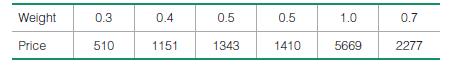
Diamond Prices The table below lists weights (carats) and prices (dollars) of randomly selected diamonds. For the prediction interval, use a 95% confidence level with a diamond that weighs 0.8 carats. Weight 0.3 0.4 0.5 0.5 1.0 0.7 Price 510 1151 1343 1410 5669 2277
Galaxy Distances The table below lists measured amounts of redshift and the distances(billions of light-years) to randomly selected clusters of galaxies (based on data from The Cosmic Perspective by Bennett et al., Benjamin Cummings). For the prediction interval, use a 90% confidence level with a
Town Courts Listed below are amounts of court income and salaries paid to the town justices (based on data from the Poughkeepsie Journal ). All amounts are in thousands of dollars, and all of the towns are in Dutchess County, New York. For the prediction interval, use a 99% confidence level with a
Altitude and Temperature Listed below are altitudes (thousands of feet) and outside air temperatures (°F) recorded by the author during Delta Flight 1053 from New Orleans to Atlanta. For the prediction interval, use a 95% confidence level with the altitude of 6327 ft(or 6.327 thousand feet).
Foot length: 26.0 cm; 95% confidence Finding a Prediction Interval. In Exercises 13–16, use the paired data consisting of foot lengths (cm) and heights (cm) of the 40 people listed in Data Set 2 of Appendix: Data Sets. Let x represent foot length and let y represent the corresponding height. Use
Foot length: 22.0 cm; 90% confidence Finding a Prediction Interval. In Exercises 13–16, use the paired data consisting of foot lengths (cm) and heights (cm) of the 40 people listed in Data Set 2 of Appendix: Data Sets. Let x represent foot length and let y represent the corresponding height. Use
Foot length: 25.0 cm; 99% confidence Finding a Prediction Interval. In Exercises 13–16, use the paired data consisting of foot lengths (cm) and heights (cm) of the 40 people listed in Data Set 2 of Appendix: Data Sets. Let x represent foot length and let y represent the corresponding height. Use
Foot length: 25.0 cm; 95% confidence Finding a Prediction Interval. In Exercises 13–16, use the paired data consisting of foot lengths (cm) and heights (cm) of the 40 people listed in Data Set 2 of Appendix: Data Sets. Let x represent foot length and let y represent the corresponding height. Use
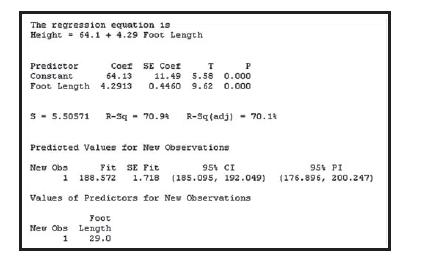
Finding a Prediction Interval For someone with a foot length of 29.0 cm, identify the 95% prediction interval estimate of their height, and write a statement interpreting that interval.Interpreting a Computer Display. In Exercises 9–12, refer to the display obtained by using the paired data
Predicting Height If someone has a foot length of 29.0 cm, what is the single value that is the best predicted height?Interpreting a Computer Display. In Exercises 9–12, refer to the display obtained by using the paired data consisting of foot lengths (cm) and heights (cm) of 40 people .(Unlike
Identifying Total Variation What percentage of the total variation in height can be explained by the linear correlation between foot length and height?Interpreting a Computer Display. In Exercises 9–12, refer to the display obtained by using the paired data consisting of foot lengths (cm) and
Testing for Correlation Use the information provided in the display to determine the value of the linear correlation coefficient. Given that there are 40 pairs of data, is there sufficient evidence to support a claim of a linear correlation between foot lengths of people and their
r = 0.751 (x = weight of discarded plastic, y = household size)Interpreting the Coefficient of Determination. In Exercises 5–8, use the value of the linear correlation coefficient r to find the coefficient of determination and the percentage of the total variation that can be explained by the
r = -0.793 (x = weight of a car, y = highway fuel consumption)Interpreting the Coefficient of Determination. In Exercises 5–8, use the value of the linear correlation coefficient r to find the coefficient of determination and the percentage of the total variation that can be explained by the
r = 0.963 (x = chest size of a bear, y = weight of a bear)Interpreting the Coefficient of Determination. In Exercises 5–8, use the value of the linear correlation coefficient r to find the coefficient of determination and the percentage of the total variation that can be explained by the linear
r = 0.933 (x = weight of male, y = waist size of male)Interpreting the Coefficient of Determination. In Exercises 5–8, use the value of the linear correlation coefficient r to find the coefficient of determination and the percentage of the total variation that can be explained by the linear
Standard Error of Estimate A sample of 12 different statistics textbooks is obtained and their weights are measured in kilograms and in pounds. Using the 12 paired weights (kg, lb), what is the value of se? For a Triola textbook that weighs 4.5 lb, the predicted weight in kilograms is 2.04 kg. What
Coefficient of Determination Using the heights and weights described in Exercise 1, the linear correlation coefficient r is 0.356. Find the value of the coefficient of determination.What practical information does the coefficient of determination provide?
Prediction Interval Using the heights and weights described in Exercise 1, a height of 180 cm is used to find that the predicted weight is 88.0 kg, and the 95% prediction interval is (50.7, 123.0). Write a statement that interprets that prediction interval. What is the major advantage of using a
se Notation If we let the predictor variable x represent heights of males and let the response variable y represent weights of males, a sample of 40 heights and weights results in se = 17.5436 cm. In your own words, describe what that value of se represents.
Find the probability that the first free throw shot Dwight makes is the second or third shot. Is this an unusual event? Explain.
Find the probability that the first free throw shot Dwight makes is the fourth shot. Is this an unusual event? Explain.
Least-Squares Property According to the least-squares property, the regression line minimizes the sum of the squares of the residuals. Refer to the data in Table 1.a. Find the sum of squares of the residuals.b. Show that the regression equation yn = 120 + 2.00x results in a larger sum of squares of
A newspaper finds that the mean number of typographical errors per page is five. Find the probability that (a) exactly five typographical errors will be found on a page, (b) fewer than five typographical errors will be found on a page, and (c) no typographical errors will be found on a page. In
The success rate of corneal transplant surgery is 85%. The surgery is performed on six patients. (Adapted from St. Luke's Cataract & Laser Institute) (a) Construct a binomial distribution. (b) Graph the binomial distribution using a probability histogram. Then describe its shape. (c) Find the mean,
The table lists the number of U.S. mainland hurricane strikes (from 1851 to 2008) for various intensities according to the Saffir-Simpson Hurricane Scale. (Source: National Oceanic and Atmospheric Administration) (a) Construct a probability distribution of the data. (b) Graph the discrete
Decide if the random variable x is discrete or continuous. Explain your reasoning. (a) Let x represent the number of lightning strikes that occur in Wyoming during the month of June. (b) Let x represent the amount of fuel (in gallons) used by the Space Shuttle during takeoff.
Earthquakes Refer to Data Set 16 in Appendix: Data Sets and use the magnitudes and depths from the earthquakes. Find the best predicted depth of an earthquake with a magnitude of 1.50.
According to analysis by USA TODAY, air flight is so safe that a person "would have to fly every day for more than 64,000 years before dying in an accident." How can such a statement be justified?
4. Is a binomial distribution a good model for determining the probabilities of various numbers of fatal accidents during a year? Explain your reasoning and include a discussion of the four criteria for a binomial experiment.
Find the best predicted word count for a woman who is in a couple relationship with a man having a word count of 10,000.
Construct a binomial distribution for 11,000,000 and p = 0.0000008 with x=0 to 12.Compare your results with the distribution in Exercise 2
Word Counts of Men and Women Refer to Data Set 17 in Appendix: Data Sets and use the word counts measured from men and women in couple relationships listed in the first two columns of Data Set
Suppose that the probability of a fatal accident in a given year is 0.0000004. A binomial probability distribution for = n 11,000,000 and p = 0.0000004 with x = 0 to 12 is shown. P(x) 0.20 0.25 0.012 0,054 0.119 0.192 0.174 0.169 0.124 0.078 0.043 0.021 0 1 2 3 4 5 6 7 8 9 10 11 12 Number of
Probability 0.05 0.10 0.15 In 2006, there were about 11 million commercial flights in the United States. If one is selected at random, what is the probability that it involved a fatal accident?
Flight Delays Refer to Data Set 15 in Appendix: Data Sets and use the departure delay times and the arrival delay times. Find the best predicted arrival delay time for a flight with no departure delay.
IQ and Brain Volume Refer to Data Set 6 in Appendix: Data Sets and use the paired data consisting of IQ score and brain volume (cm3). Find the best predicted IQ score for someone with a brain volume of 1000 cm3.
Sports Using the data from the preceding exercise, find the best predicted volume of a marble with a diameter of 1.50 cm. How does the result compare to the actual volume of 1.8 cm3?
Sports Find the best predicted circumference of a marble with a diameter of 1.50 cm.How does the result compare to the actual circumference of 4.7 cm? Baseball Basketball Golf Soccer Tennis Ping-Pong Volleyball Softball Diameter 7.4 23.9 4.3 21.8 7.0 4.0 20.9 9.7 Circumference 23.2 75.1 13.5 68.5
Gas Prices Using the data from the preceding exercise, find the best predicted price for mid-grade gas for a station that posted $2.78 as the price of regular gas. Is the result close to the actual price of $2.84 for mid-grade gas?
Gas Prices One gas station not included in the table below had a listed price of $2.78 for regular gas. Find the best predicted price of premium gas at this station. Is the result close to the actual price of $2.93 for premium gas? Regular 2.77 2.77 2.79 2.81 2.78 2.86 2.75 2.77 Mid-Grade 3.00 2.77
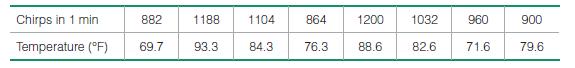
Crickets and Temperature Find the best predicted temperature at a time when a cricket chirps 3000 times in 1 minute. What is wrong with this predicted value? Chirps in 1 min 882 1188 1104 864 1200 1032 960 900 Temperature (F) 69.7 93.3 84.3 76.3 88.6 82.6 71.6 79.6
Blood Pressure Measurements Find the best predicted systolic blood pressure in the left arm given that the systolic blood pressure in the right arm is 100 mm Hg. Right Arm 102 101 94 79 79 Left Arm 175 169 182 146 144
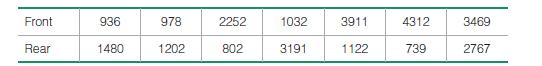
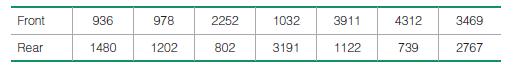
Car Repair Costs Find the best predicted repair costs for a full-rear crash for a Volkswagon Passat, given that its repair cost from a full-front crash is $4594. How does the result compare to the $982 actual repair cost from a full-rear crash? Front 936 978 2252 1032 3911 4312 3469 Rear 1480 1202
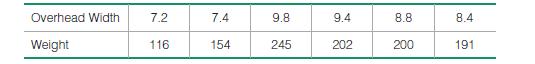
Measuring Seals from Photos Find the best predicted weight of a seal if the overhead width measured from a photograph is 2 cm. Can the prediction be correct? What is wrong with predicting the weight in this case? Overhead Width 7.2 7.4 9.8 9.4 8.8 8.4 Weight 116 154 245 202 200 191
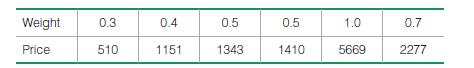
Diamond Prices Not included in the table below is a diamond with a weight of 1.50 carats. Find the best predicted price for this diamond. Is the result close to the actual price of$16,097? What is wrong with predicting the price of a 1.50-carat diamond? Weight 0.3 0.4 0.5 0.5 1.0 0.7 Price 510 1151
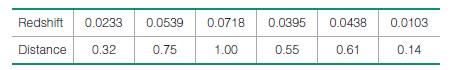
Galaxy Distances The cluster Hydra has a measured redshift of 0.0126. Find the best predicted distance to that cluster. Is the result close to the actual distance of 0.18 billion light-years? Redshift 0.0233 0.0539 0.0718 0.0395 0.0438 0.0103 Distance 0.32 0.75 1.00 0.55 0.61 0.14
Town Courts The court for the town of Beekman had income of $83,941 (or $83.941 thousand). Find the best predicted salary for the justice. Is the result close to the actual salary of $26,088? Court Income 65 404 1567 1131 272 252 111 154 32 32 Justice Salary 30 44 22 92 56 46 61 25 26 18
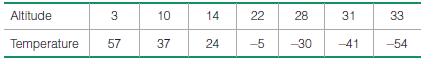
Altitude and Temperature At 6327 ft (or 6.327 thousand feet), the author recorded the temperature. Find the best predicted temperature at that altitude. How does the result compare to the actual recorded value of 48°F? Altitude 3 10 14 22 28 31 33 Temperature 57 37 24 -5 -30 -41 -54
Campus Crime Find the best predicted number of burglaries for Ohio State, which had an enrollment of 51,800 students. Is the predicted value close to 329, which was the actual number of burglaries? Enrollment 32 31 53 28 27 36 42 30 34 Burglaries 103 103 86 57 32 131 157 20 27 46 161
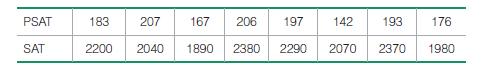
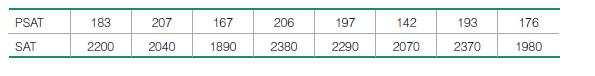
PSAT and SAT Scores One subject not included in the given table had a PSAT score of 229.Find the best predicted SAT score for this student. Is the result close to the reported value of 2400? Given that the data are from volunteered responses, are the results valid? PSAT 183 207 167 206 197 142 193
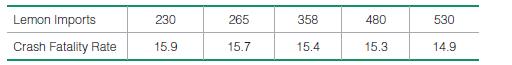
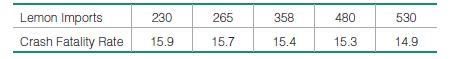
Lemons and Car Crashes Find the best predicted crash fatality rate for a year in which there are 500 metric tons of lemon imports. Lemon Imports 230 265 358 480 530 Crash Fatality Rate 15.9 15.7 15.4 15.3 14.9
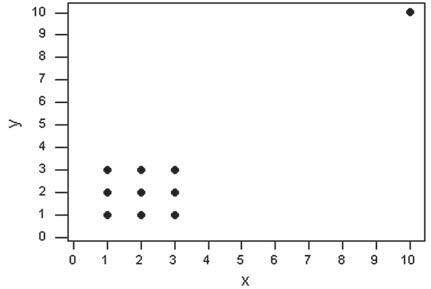
Effects of Clusters Refer to the scatterplot given in Exercise 12 of Section 2.a. Using the pairs of values for all 8 points, find the equation of the regression line.b. Using only the pairs of values for the 4 points in the lower left corner, find the equation of the regression line.c. Using only
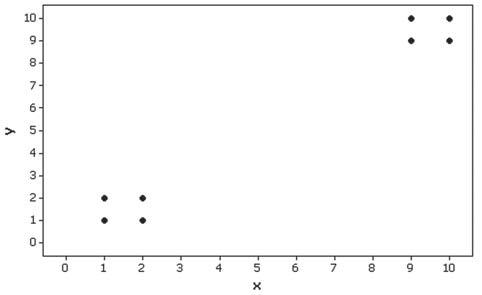
Effects of an Outlier Refer to the scatterplot given in Exercise 11 of Section 2.a. Using the pairs of values for all 10 points, find the equation of the regression line.b. After removing the point with coordinates (10, 10), use the pairs of values for the remaining 9 points and find the equation
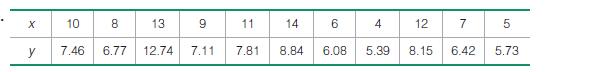
Finding the Equation of the Regression Line. In Exercises 9 and 10, use the given data to find the equation of the regression line. Examine the scatterplot and identify a characteristic of the data that is ignored by the regression line. x 10 8 13 9 11 14 6 4 12 7 5 y 7.46 6.77 12.74 7.11 7.81 8.84
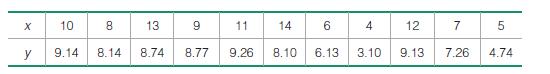
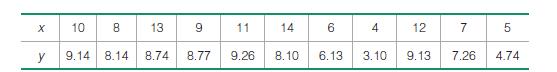
Finding the Equation of the Regression Line. In Exercises 9 and 10, use the given data to find the equation of the regression line. Examine the scatterplot and identify a characteristic of the data that is ignored by the regression line. x 10 8 13 9 11 14 6 4 12 7 5 y 9.14 8.14 8.74 8.77 9.26 8.10
Cereal Killers The amounts of sugar (grams of sugar per gram of cereal) and calories (per gram of cereal) were recorded for a sample of 16 different cereals. The linear correlation coefficient is r = 0.765 and the regression equation is yn = 3.46 + 1.01x, where x represents the amount of sugar. The
Heights of Fathers and Sons The heights (in inches) of a sample of 10 father/son pairs of subjects were measured. The linear correlation coefficient is r = 0.149 and the regression equation is yn = 66.8 + 0.016x, where x represents the father’s height. The mean of the 10 father heights is 69.7
Old Faithful For 40 eruptions of the Old Faithful geyser in Yellowstone National Park, duration times (sec) were recorded along with the heights (ft) of the eruptions. The linear correlation coefficient is r = 0.0915 and the regression equation is yn = 119 + 0.0331x, where x represents duration
Old Faithful For 40 eruptions of the Old Faithful geyser in Yellowstone National Park, duration times (sec) were recorded along with the time intervals (min) after the eruptions. The linear correlation coefficient is r = 0.687 and the regression equation is yn = 47.4 + 0.180x, where x represents
Notation What is the difference between the regression equation yn = b0 + b1x and the regression equation y = b0 + b1x?
Correlation and Slope Formula 3 shows that the slope of a regression line can be found by evaluating r # sy>sx. What do we know about the graph of the regression line if r is a positive value? What do we know about the graph of the regression line if r is a negative value?
Best-Fit Line In what sense is the regression line the straight line that “best” fits the points in a scatterplot?
Notation and Terminology When using paired height/pulse data for females , we get this regression equation: yn = 73.9 + 0.0223x, where x represents height (cm) and the pulse rate is in beats per minute. What does the symbol yn represent? In this case, what does the predictor variable represent?
Finding Critical r Values Table 6 in Appendix: Tables lists critical values of r for selected values of n and a.More generally, critical r values can be found by using the formulawhere the t value is found from the table of critical t values (Table 3 in Appendix: Tables)assuming a two-tailed case
Transformed Data In addition to testing for a linear correlation between x and y, we can often use transformations of data to explore other relationships. For example, we might replace each x value by x2 and use the methods of this section to determine whether there is a linear correlation between
Earthquakes Refer to Data Set 16 in Appendix: Data Sets and use the magnitudes and depths from the earthquakes.
Word Counts of Men and Women Refer to Data Set 17 in Appendix: Data Sets and use the word counts measured from men and women in couple relationships listed in the first two columns of Data Set 17.
Flight Delays Refer to Data Set 15 in Appendix: Data Sets and use the departure delay times and the arrival delay times.
IQ and Brain Volume Refer to Data Set 6 in Appendix: Data Sets and use the paired data consisting of brain volume (cm3) and IQ score.
Sports Repeat the preceding exercise using diameters and volumes.
Sports Diameters (cm), circumferences (cm), and volumes (cm3) from balls used in different sports are listed in the table below. Is there sufficient evidence to conclude that there is a linear correlation between diameters and circumferences? Does the scatterplot confirm a linear association?
Gas Prices Repeat the preceding exercise using the prices of regular gas and the prices of mid-grade gas.
Gas Prices Gas prices have been very volatile in recent years. The table below lists gas prices (dollars per gallon) at randomly selected Connecticut stations at the time of this writing(based on data from AOL Autos). Is there sufficient evidence to conclude that there is a linear correlation
Crickets and Temperature One classic application of correlation involves the association between the temperature and the number of times a cricket chirps in a minute. Listed below are the numbers of chirps in 1 min and the corresponding temperatures in °F (based on data from The Song of Insects by
Blood Pressure Measurements Listed below are systolic blood pressure measurements(in mm Hg) obtained from the same woman (based on data from “Consistency of Blood Pressure Differences Between the Left and Right Arms,” by Eguchi, et al., Archives of Internal Medicine, Vol. 167). Is there
Car Repair Costs Listed below are repair costs (in dollars) for cars crashed at 6 mi/h in full-front crash tests and the same cars crashed at 6 mi/h in full-rear crash tests (based on data from the Insurance Institute for Highway Safety). The cars are the Toyota Camry, Mazda 6, Volvo S40, Saturn
Measuring Seals from Photos Listed below are the overhead widths (in cm) of seals measured from photographs and the weights (in kg) of the seals (based on “Mass Estimation of Weddell Seals Using Techniques of Photogrammetry,” by R. Garrott of Montana State University).The purpose of the study
Diamond Prices The table below lists weights (carats) and prices (dollars) of randomly selected diamonds. All of the diamonds are round with ratings of “very good” cut, they all have a color rating of F (“slight color”), and a clarity rating of VSI (“very slightly included”). The values
Galaxy Distances The table below lists measured amounts of redshift and the distances(billions of light-years) to randomly selected clusters of galaxies (based on data from The Cosmic Perspective by Bennett et al., Benjamin Cummings). Is there sufficient evidence to conclude that there is a linear
Auction Bids The author is a member of the board of directors of a nonprofit organization that held a fund-raising auction. He recorded the opening bids suggested by the auctioneer and the final winning bids for several items. The amounts are listed below. Is there sufficient evidence to conclude
Altitude and Temperature Listed below are altitudes (thousands of feet) and outside air temperatures (degrees Fahrenheit) recorded by the author during Delta Flight 1053 from New Orleans to Atlanta. Is there sufficient evidence to conclude that there is a linear correlation between altitude and
Campus Crime Listed below are numbers of enrolled students (in thousands) and numbers of burglaries for randomly selected large colleges in a recent year (based on data from the New York Times). Is there sufficient evidence to conclude that there is a linear correlation between enrollment and
PSAT and SAT Scores Listed below are PSAT scores and SAT scores from prospective college applicants. The scores were reported by subjects who responded to a request posted by the Web site talk.collegeconfidential.com. Is there sufficient evidence to conclude that there is a linear correlation
Lemons and Car Crashes Listed below are annual data for various years. The data are weights (metric tons) of lemons imported from Mexico and U.S. car crash fatality rates per 100,000 population [based on data from “The Trouble with QSAR (or How I Learned to Stop Worrying and Embrace Fallacy)”
Effects of Clusters Refer to the following scatterplot. The four points in the lower left corner are measurements from women, and the four points in the upper right corner are from men.a. Examine the pattern of the four points in the lower left corner (from women) only, and subjectively determine
Effects of an Outlier Refer to the accompanying scatterplot.a. Examine the pattern of all 10 points and subjectively determine whether there appears to be a correlation between x and y.b. After identifying the 10 pairs of coordinates corresponding to the 10 points, find the value of the correlation
Importance of Graphing. Exercises 9 and 10 provide two data sets from “Graphs in Statistical Analysis,” by F. J. Anscombe, The American Statistician, Vol. 27.For each exercise,a. Construct a scatterplot.b. Find the value of the linear correlation coefficient r, then determine whether there is
Importance of Graphing. Exercises 9 and 10 provide two data sets from “Graphs in Statistical Analysis,” by F. J. Anscombe, The American Statistician, Vol. 27.For each exercise,a. Construct a scatterplot.b. Find the value of the linear correlation coefficient r, then determine whether there is
Cereal Killers The amounts of sugar (grams of sugar per gram of cereal) and calories (per gram of cereal) were recorded for a sample of 16 different cereals. Results are shown here. Is there sufficient evidence to support the claim that there is a linear correlation between sugar and calories in a
Heights of Fathers and Sons The heights (in inches) of a sample of 10 father/son pairs of subjects were measured. Results are shown below (based on data from the National Health Examination Survey). Is there sufficient evidence to support the claim that there is a linear correlation between the
Old Faithful For 40 eruptions of the Old Faithful geyser in Yellowstone National Park, duration times (sec) were recorded along with the heights (ft) of the eruptions. The paired duration and height measurements were used to obtain the results shown in the accompanying XLSTAT display. Is there
Old Faithful For 40 eruptions of the Old Faithful geyser in Yellowstone National Park, duration times (sec) were recorded along with the time intervals (min) to the next eruption. The paired durations and interval times were used to obtain the results shown in the accompanying display. Is there
Weight Loss and Correlation In a test of the Weight Watchers weight loss program, weights of 40 subjects are recorded before and after the program. Assume that the before/after weights result in r = 0.876. Is there sufficient evidence to support a claim of a linear correlation between the
Cause of High Blood Pressure Some studies have shown that there is a correlation between consumption of salt and blood pressure. As more salt is consumed, blood pressure tends to rise. A reporter reads one of these studies and writes the headline “Increased Salt Consumption Causes Blood Pressure
Physics Experiment A physics experiment consists of recording paired data consisting of the time (seconds) elapsed since the beginning of the experiment and the distance (cm) of a robot from its point of origin. Using the paired time/distance data, the value of r is calculated to be 0.Is it correct
Notation For each of several randomly selected years, the sunspsot number and the high value of the Dow Jones Industrial Average are recorded. The sunspot number is a measure of sunspot activity on the sun, and the Dow Jones Industrial Average is one measure of stock market value. For this sample
Aircraft Safety Standards Under older Federal Aviation Administration rules, airlines were required to estimate the weight of a passenger as 185 lb. (That amount is for an adult traveling in winter, and it includes 20 lb of carry-on baggage.) Rules were revised to use an estimate of 195 lb. Men now
Showing 2600 - 2700
of 7930
First
20
21
22
23
24
25
26
27
28
29
30
31
32
33
34
Last
Step by Step Answers