New Semester
Started
Get
50% OFF
Study Help!
--h --m --s
Claim Now
Question Answers
Textbooks
Find textbooks, questions and answers
Oops, something went wrong!
Change your search query and then try again
S
Books
FREE
Study Help
Expert Questions
Accounting
General Management
Mathematics
Finance
Organizational Behaviour
Law
Physics
Operating System
Management Leadership
Sociology
Programming
Marketing
Database
Computer Network
Economics
Textbooks Solutions
Accounting
Managerial Accounting
Management Leadership
Cost Accounting
Statistics
Business Law
Corporate Finance
Finance
Economics
Auditing
Tutors
Online Tutors
Find a Tutor
Hire a Tutor
Become a Tutor
AI Tutor
AI Study Planner
NEW
Sell Books
Search
Search
Sign In
Register
study help
business
elementary statistics
Elementary Statistics 3rd Edition William Navidi, Barry Monk - Solutions
Level 98%: x1 = 49, n1 = 74, x2 = 62, n2 = 153 In Exercises 7–12, construct the confidence interval for the difference p1 − p2 for the given level and values of x1, n1, x2, and n2.
Level 99%: x1 = 24, n1 = 53, x2 = 17, n2 = 41 In Exercises 7–12, construct the confidence interval for the difference p1 − p2 for the given level and values of x1, n1, x2, and n2.
Traffic engineers compared rates of traffic accidents at intersections with raised medians with rates at intersections with two-way left-turn lanes. They found that out of 4644 accidents at intersections with raised medians, 2280 were rear-end accidents, and out of 4584 accidents at two-way
In a new experimental teaching method, when students have questions in class, they send them to the instructor via a laptop computer. From time to time, the instructor pauses to read the questions and to provide the answers, without revealing the identities of the students who are asking the
In a random sample of 50 patients undergoing a standard surgical procedure, 15 required medication for postoperative pain. In a random sample of 90 patients undergoing a new procedure, only 16 required pain medication.a. Construct a 95% confidence interval for the difference in the proportions of
In order to judge the effectiveness of an advertising campaign for a certain brand of pretzel, a company obtained a simple random sample of 90 convenience store receipts the week before the ad campaign began, and found that 21 of them showed a purchase of the pretzels. Another simple random sample
A team of designers was given the task of reducing the defect rate in the manufacture of a certain printed circuit board. The team decided to reconfigure the cooling system. A total of 973 boards were produced the week before the reconfiguration was implemented, and 254 of these were defective. A
A poll taken by the General Social Survey in 2010 asked people in the United States whether they were satisfied with their financial situation. A total of 478 out of 2038 people said they were satisfied. The same question was asked in 2014, and 698 out of 2532 people said they were satisfied.a.
Colonoscopy is a medical procedure that is designed to find and remove precancerous lesions in the colon before they become cancerous. In a sample of 51,460 people without colorectal cancer, 5043 had previously had a colonoscopy, and in a sample of 10,292 people diagnosed with colorectal cancer,
A Pew poll found that in a sample of 1002 adults, 621 had a social media account. The study was repeated a year later, and 631 out of 971 adults has social media accounts.a. Construct a 95% confidence interval for the increase in the proportion of adults with social media accounts during the year
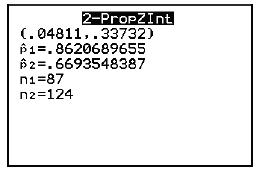
The following TI-84 Plus calculator display presents a 99% confidence interval for the difference between two proportions.a. Compute the point estimate of p1 − p2.b. Fill in the blanks: We are 99% confident that the difference between the proportions is between ____________ and ______________.
The following MINITAB output presents a confidence interval for the difference between two proportions.a. Compute the point estimate of p1 − p2.b. Fill in the blanks: We are _____________ confident that the difference between the proportions is between ____________ and ______________. Sample X N
The following MINITAB output presents a confidence interval for the difference between two proportions.a. Compute the point estimate of p1 − p2.b. Fill in the blanks: We are _____________ confident that the difference between the proportions is between ____________ and ______________. 16 546 2 18
Polls are to be conducted in two cities to determine the difference in the proportions of residents who believe that the economy will improve over the next year. A 95% confidence interval will be constructed for the difference between the proportions. If the sample sizes are to be equal in the two
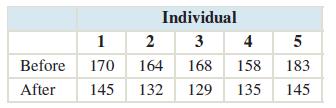
A group of five individuals with high blood pressure were given a new drug that was designed to lower blood pressure. Systolic blood pressure was measured before and after treatment for each individual. The results follow.Construct a 95% confidence interval for the mean reduction in systolic blood
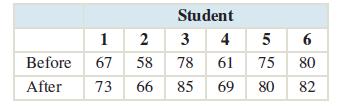
The statistics department at a large university instituted a program in which students could get extra help with statistics in the evening. The following table presents scores for tests taken before and after the program for a random sample of six students.Construct a 99% confidence interval for
With ______________ samples, each value in one sample can be matched with a corresponding value from another sample.In Exercises 3 and 4, fill in each blank with the appropriate word or phrase.
The margin of error for the mean difference between matched pairs is usually ______________ than the margin of error for independent samples.In Exercises 3 and 4, fill in each blank with the appropriate word or phrase.
Paired data reduce a two-sample problem to a one-sample problem.In Exercises 5 and 6, determine whether the statement is true or false. If the statement is false, rewrite it as a true statement.
To construct a confidence interval using matched pairs, we must compute the standard deviation of each sample.In Exercises 5 and 6, determine whether the statement is true or false. If the statement is false, rewrite it as a true statement.
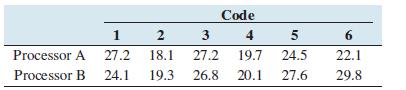
Two microprocessors are compared on a sample of 6 benchmark codes to determine whether there is a difference in speed. The times (in seconds) used by each processor on each code are as follows:a. Find a 95% confidence interval for the difference between the mean speeds.b. A computer scientist
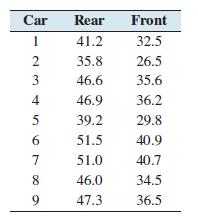
For a sample of 9 automobiles, the mileage (in 1000s of miles) at which the original front brake pads were worn to 10% of their original thickness was measured, as was the mileage at which the original rear brake pads were worn to 10% of their original thickness. The results were as follows:a.
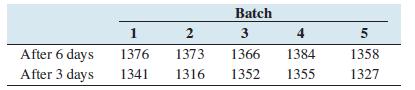
The compressive strength, in kilopascals, was measured for concrete blocks from five different batches of concrete, both three and six days after pouring. The data are as follows:a. Construct a 95% confidence interval for the difference between the mean strengths of blocks cured three days and
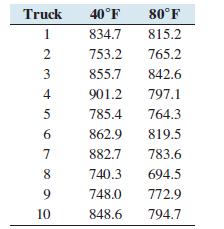
In an experiment to determine the effect of ambient temperature on the emissions of oxides of nitrogen(NOx) of diesel trucks, 10 trucks were run at temperatures of 40°F and 80°F. The emissions, in parts per billion, are presented in the following table.a. Construct a 99% confidence interval for
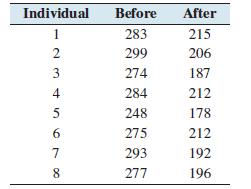
A group of eight individuals with high cholesterol levels were given a new drug that was designed to lower cholesterol levels. Cholesterol levels, in milligrams per deciliter, were measured before and after treatment for each individual, with the following results:a. Construct a 90% confidence
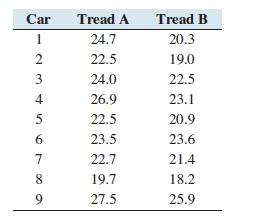
A tire manufacturer is interested in testing the fuel economy for two different tread patterns. Tires of each tread type were driven for 1000 miles on each of 9 different cars. The mileages, in miles per gallon, were as follows:a. Construct a 95% confidence interval for the mean difference in fuel
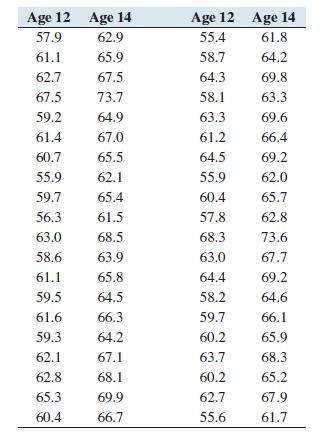
It is generally known that boys grow at an unusually fast rate between the ages of about 12 and 14.Following are heights, in inches of 40 boys, measured at age 12 and again at age 14.a. Construct a 95% confidence interval for the mean increase in height for boys between the ages of 12 and 14.b. A
A sample of 32 students took a class designed to improve their SAT math scores. Following are their scores before and after the class.a. Construct a 95% confidence interval for the mean increase in scores after the class.b. The class instructor claims that the mean increase is greater than 20
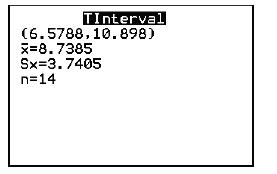
The following TI-84 Plus calculator display presents a 95% confidence interval for the mean difference between matched pairs.a. What is the point estimate of μd?b. How many degrees of freedom are there?c. Fill in the blanks: We are 95% confident that the mean difference is between ________________
The following TI-84 Plus calculator display presents a 99% confidence interval for the mean difference between matched pairs.a. What is the point estimate of μd?b. How many degrees of freedom are there?c. Fill in the blanks: We are 99% confident that the mean difference is between _______________
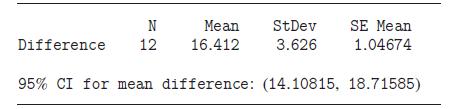
The following output from MINITAB presents a confidence interval for the mean difference between matched pairs.a. What is the point estimate of μd?b. How many degrees of freedom are there?c. Fill in the blanks: We are _____________________ confident that the mean difference is between
The following output from MINITAB presents a confidence interval for the mean difference between matched pairs.a. What is the point estimate of μd?b. How many degrees of freedom are there?c. Fill in the blanks: We are __________________ confident that the mean difference is between
Refer to Exercise 12.a. Assume that the measurements for tread A and for tread B come from independent samples, and construct a 95% confidence interval for the difference in mean tread wear using the methods of Section 10.1.b. Which confidence interval is narrower, the one using matched pairs or
A sample of 15 weight lifters is tested to see how much weight they can bench press. They then follow a special training program for three weeks, after which they are tested again. The samples are the amounts of weights that were lifted before and after the training program.
A sample of 20 weight lifters is tested to see how much weight they can bench press. Ten of them are chosen at random as the treatment group. They participate in a special training program for three weeks. The remaining 10 are the control group. They follow their usual program. At the end of three
In a survey of 300 randomly selected female and 240 male holiday shoppers, 87 of the females and 98 of the males stated that they will wait until the last week before Christmas to finish buying gifts. Let p1 be the population proportion of males who will wait until the last week and let p2 be the
Refer to Exercise 3.Find the critical value for a 95% confidence interval for the difference p1 − p2.Exercise 3In a survey of 300 randomly selected female and 240 male holiday shoppers, 87 of the females and 98 of the males stated that they will wait until the last week before Christmas to finish
Refer to Exercise 3.Compute the margin of error for a 95% confidence interval for the difference p1 − p2.Exercise 3In a survey of 300 randomly selected female and 240 male holiday shoppers, 87 of the females and 98 of the males stated that they will wait until the last week before Christmas to
Refer to Exercise 3.Construct a 95% confidence interval for the difference p1 − p2.Exercise 3In a survey of 300 randomly selected female and 240 male holiday shoppers, 87 of the females and 98 of the males stated that they will wait until the last week before Christmas to finish buying gifts. Let
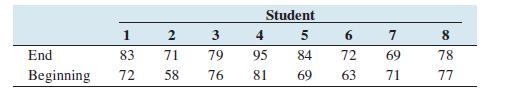
Eight students in a particular college course are given a pre-test at the beginning of the semester and are then given the same exam at the end to test what they have learned. The exam scores at the beginning and at the end are given in the following table.Let μd be the mean difference End −
Refer to Exercise 7.Find the critical value for a 99% confidence interval for μd.Exercise 7Eight students in a particular college course are given a pre-test at the beginning of the semester and are then given the same exam at the end to test what they have learned. The exam scores at the
Refer to Exercise 7.Compute the margin of error for a 99% confidence interval for the difference μd.Exercise 7Eight students in a particular college course are given a pre-test at the beginning of the semester and are then given the same exam at the end to test what they have learned. The exam
Refer to Exercise 7.Construct a 99% confidence interval for the difference μd.Exercise 7Eight students in a particular college course are given a pre-test at the beginning of the semester and are then given the same exam at the end to test what they have learned. The exam scores at the beginning
A random sample of 76 residents in a small town had a mean annual income of \($34,214\), with a sample standard deviation of \($2171\). In a neighboring town, a random sample of 88 residents had a mean annual income of \($31,671\) with a sample standard deviation of \($3279\). Let μ1 be the
Refer to Exercise 11.Find the critical value for a 90% confidence interval for the difference μ1 − μ2.Exercise 11A random sample of 76 residents in a small town had a mean annual income of \($34,214\), with a sample standard deviation of \($2171\). In a neighboring town, a random sample of 88
Refer to Exercise 11.Compute the margin of error for a 90% confidence interval for the differenceμ1 − μ2.Exercise 11A random sample of 76 residents in a small town had a mean annual income of \($34,214\), with a sample standard deviation of \($2171\). In a neighboring town, a random sample of
Refer to Exercise 11.Construct a 90% confidence interval for the difference μ1 − μ2.Exercise 11A random sample of 76 residents in a small town had a mean annual income of \($34,214\), with a sample standard deviation of \($2171\). In a neighboring town, a random sample of 88 residents had a
In a poll of 100 voters, 57 said they were planning to vote for the incumbent governor, and 48 said they were planning to vote for the incumbent mayor. Explain why these data should not be used to construct a confidence interval for the difference between the proportions of voters who plan to vote
An investor is trying to decide in which of two stocks to invest. He examines records for the past 365 days, and finds that the price of stock A increased on 197 of them and the price of stock B increased on 158 of them. Explain why these data should not be used to construct a confidence interval
Why is it necessary for all values in the confidence interval to be positive to conclude that μ1 > μ2? What would have to be true to conclude that μ1 < μ2?
Provide an example of two samples that are independent. Explain why these samples are independent.
Provide an example of two samples that are paired. Explain why these samples are paired.
A test was made of H0 : μ1 = μ2 versus H1: μ1 > μ2. Independent random samples were drawn from approximately normal populations. The sample means were x̄1 = 6.8 and x̄2 = 4.9. The sample standard deviations were s1 = 1.6 and s2 = 1.3.The sample sizes were n1 = 12 and n2 = 10.a. Find the value
A test was made of H0 : μ1 = μ2 versus H1: μ1 ≠ μ2. Independent random samples were drawn from approximately normal populations. The sample means were x̄1 = 73.9 and x̄2 = 71.8. The sample standard deviations were s1 = 4.2 and s2 = 3.8.The sample sizes were n1 = 23 and n2 = 17.a. Find the
To use the methods of this section to test a hypothesis about the difference between two means when the samples are small, the samples must show no evidence of strong ________________ and must contain no _________________ .In Exercises 3 and 4, fill in each blank with the appropriate word or phrase.
If the sample sizes are n1 and n2, the simplest way to compute the degrees of freedom is to use the smaller of___________________ and ________________ .In Exercises 3 and 4, fill in each blank with the appropriate word or phrase.
To use the methods of this section to test a hypothesis about the difference between two means, the population standard deviations must be known.In Exercises 5 and 6, determine whether the statement is true or false. If the statement is false, rewrite it as a true statement.
In general, it is not recommended to use a pooled standard deviation when testing a hypothesis for the difference between means.In Exercises 5 and 6, determine whether the statement is true or false. If the statement is false, rewrite it as a true statement.
A test was made of H0: μ1 = μ2 versus H1: μ1 < μ2. The sample means were x̄1 = 6 and x̄2 = 11, the sample standard deviations were s1 = 3 and s2 = 5, and the sample sizes were n1 = 10 and n2 = 20.a. How many degrees of freedom are there for the test statistic, using the simple method?b.
A test was made of H0: μ1 = μ2 versus H1: μ1 ≠ μ2. The sample means were x̄1 = 10 and x̄2 = 8, the sample standard deviations were s1 = 4 and s2 = 7, and the sample sizes were n1 = 15 and n2 = 27.a. How many degrees of freedom are there for the test statistic, using the simple method?b.
The General Social Survey polled a sample of 1048 adults in the year 2010, asking them how many hours per week they spent on the Internet. The sample mean was 9.79 with a standard deviation of 13.41. A second sample of 1399 adults was taken in the year 2014. For this sample, the mean was 11.62 with
Are low-fat diets or low-carb diets more effective for weight loss? A sample of 77 subjects went on a low-carbohydrate diet for six months. At the end of that time, the sample mean weight loss was 4.7 kilograms with a sample standard deviation of 7.16 kilograms. A second sample of 79 subjects went
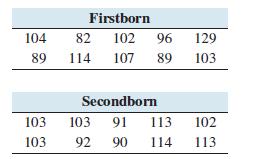
In a study of birth order and intelligence, IQ tests were given to 18- and 19-year-old men to estimate the size of the difference, if any, between the mean IQs of firstborn sons and secondborn sons.The following data for 10 firstborn sons and 10 secondborn sons are consistent with the means and
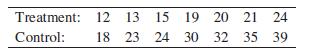
A new postsurgical treatment was compared with a standard treatment. Seven subjects received the new treatment, while seven others (the controls) received the standard treatment. The recovery times, in days, are given below.Can you conclude that the mean recovery time for those receiving the new
The concentration of benzene was measured in units of milligrams per liter for a simple random sample of five specimens of untreated wastewater produced at a gas field. The sample mean was 7.8 with a sample standard deviation of 1.4. Seven specimens of treated wastewater had an average benzene
Medical researchers conducted a study to determine whether treadmill exercise could improve the walking ability of patients suffering from claudication, which is pain caused by insufficient blood flow to the muscles of the legs. A sample of 48 patients walked on a treadmill for six minutes every
King Tut was an ancient Egyptian ruler whose tomb was discovered and opened in 1923. Legend has it that the archaeologists who opened the tomb were subject to a ‘‘mummy’s curse,’’ which would shorten their life spans. A team of scientists conducted an investigation of the mummy’s curse.
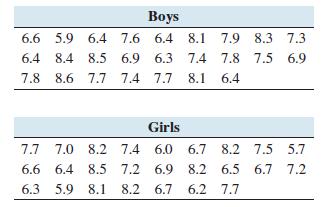
Following are weights in pounds for random samples of 25 newborn baby boys and baby girls born in Denver in 2011. Boxplots indicate that the samples come from populations that are approximately normal.Can you conclude that the mean weights differ between boys and girls? Use the α = 0.05 level of
The Interpersonal Reactivity Index is a survey designed to assess four different types of empathy. One type of empathy, called Empathetic Concern, measures the tendency to feel sympathy and compassion for people who are less fortunate. The index ranges from 0 (less empathetic) to 28(more
The Pew Internet and American Life Project surveyed 2227 adults, asking them about their texting habits. Among men, the mean number of text messages sent per day was 40.9, and among women it was 42.0. Assume that 1085 men and 1142 women were sampled, and that the standard deviations were 56.5 for
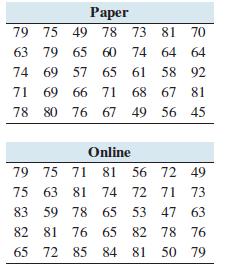
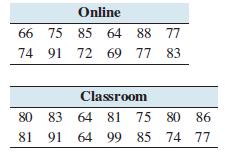
Do you prefer taking tests on paper or online?A college instructor gave identical tests to two randomly sampled groups of 35 students. One group took the test on paper and the other took it online. Following are the test scores.Can you conclude that there is a difference in the mean score between
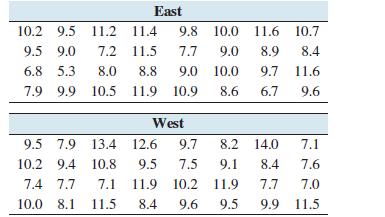
How often does the average driver have an accident? The Allstate Insurance Company determined the average number of years between accidents for drivers in a large number of U.S. cities. Following are the results for 32 cities east of the Mississippi River and 32 cities west of the Mississippi
The following TI-84 Plus calculator display presents the results of a hypothesis test for the difference between two means. The sample sizes are n1 = 12 and n2 = 15.a. Is this a left-tailed test, a right-tailed test, or a two-tailed test?b. How many degrees of freedom did the calculator use?c. What
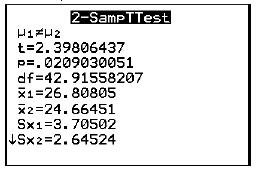
The following TI-84 Plus calculator display presents the results of a hypothesis test for the difference between two means. The sample sizes are n1 = 25 and n2 = 28.a. Is this a left-tailed test, a right-tailed test, or a two-tailed test?b. How many degrees of freedom did the calculator use?c. What
The following computer output(from MINITAB) presents the results of a hypothesis test for the difference μ1 − μ2 between two population means:a. What is the alternate hypothesis?b. Can H0 be rejected at the α = 0.05 level? Explain.c. How many degrees of freedom are there for the test
The following computer output(from MINITAB) presents the results of a hypothesis test for the difference μ1 − μ2 between two population means:a. What is the alternate hypothesis?b. Can H0 be rejected at the α = 0.05 level? Explain.c. How many degrees of freedom are there for the test
A test will be made of H0: μ1 = μ2 versus H1: μ1 > μ2. The sample sizes were n1 = 10 and n2 = 20.The sample standard deviations were s1 = 3 and s2 = 8.a. Compute the critical value for a level α = 0.05 test, using 1 less than the smaller of the two sample sizes for the degrees of freedom.b.
A sample of students is enrolled in a speed-reading class. Each takes a reading test before and again after the class. The two samples of scores are compared to determine how large an improvement in reading speed occurred. Are these samples independent or paired?
A sample of students is enrolled in an online statistics class, and another sample is enrolled in a traditional statistics class. At the end of the semester, the students are given a test. The scores from each sample are compared to determine which class was more effective. Are these samples
A sample of 87 one-year-old spotted flounder had a mean length of 126.31 millimeters with a sample standard deviation of 18.10 millimeters, and a sample of 132 two-year-old spotted flounder had a mean length of 162.41 millimeters with a sample standard deviation of 28.49 millimeters. Construct a
The mean speed for a sample of 39 cars at a certain intersection was 26.50 kilometers per hour with a standard deviation of 2.37 kilometers per hour, and the mean speed for a sample of 142 motorcycles was 37.14 kilometers per hour with a standard deviation of 3.66 kilometers per hour. Construct a
If observations in one sample do not influence the observations in another sample, the samples are said to be _______________ .In Exercises 5 and 6, fill in each blank with the appropriate word or phrase.
When determining the number of degrees of freedom by hand with sample sizes n1 and n2, we choose the smaller of ___________________ and __________________ .In Exercises 5 and 6, fill in each blank with the appropriate word or phrase.
The point estimate for μ1 − μ2 is x̄1 + x̄2.In Exercises 7 and 8, determine whether the statement is true or false. If the statement is false, rewrite it as a true statement.
The number of degrees of freedom calculated with technology is generally different from the number calculated by hand.In Exercises 7 and 8, determine whether the statement is true or false. If the statement is false, rewrite it as a true statement.
Level 90%: x̄1 = 104.6, ̄x2 = 92.9, s1 = 4.8, s2 = 6.9, n1 = 26, n2 = 19 In Exercises 9–14, construct the confidence interval for the difference μ1 − μ2 for the given level and values of x̄1 x̄2, s1, s2, n1, and n2
Level 95%: x̄ 1 = 478.81, ̄x2 = 322.49, s1 = 42.84, s2 = 25.17, n1 = 14, n2 = 16 In Exercises 9–14, construct the confidence interval for the difference μ1 − μ2 for the given level and values of x̄1 x̄2, s1, s2, n1, and n2
Level 99%: x̄1 = 603.55, ̄x2 = 516.63, s1 = 54.7, s2 = 45.2, n1 = 15, n2 = 24 In Exercises 9–14, construct the confidence interval for the difference μ1 − μ2 for the given level and values of x̄1 x̄2, s1, s2, n1, and n2
Level 98%: x̄1 = 77.3, ̄x2 = 72.6, s1 = 9.1, s2 = 8.8, n1 = 12, n2 = 16 In Exercises 9–14, construct the confidence interval for the difference μ1 − μ2 for the given level and values of x̄1 x̄2, s1, s2, n1, and n2
Level 95%: x̄1 = 47.7, ̄x2 = 42.6, s1 = 33.9, s2 = 17.6, n1 = 13, n2 = 19 In Exercises 9–14, construct the confidence interval for the difference μ1 − μ2 for the given level and values of x̄1 x̄2, s1, s2, n1, and n2
Level 99.5%: x̄1 = 82.9, ̄x2 = 64.1, s1 = 9.8, s2 = 6.2, n1 = 19, n2 = 10 In Exercises 9–14, construct the confidence interval for the difference μ1 − μ2 for the given level and values of x̄1 x̄2, s1, s2, n1, and n2
A group of 78 people enrolled in a weight-loss program that involved adhering to a special diet and to a daily exercise program. After six months, their mean weight loss was 25 pounds, with a sample standard deviation of 9 pounds. A second group of 43 people went on the diet but didn’t exercise.
The concentration of benzene was measured in units of milligrams per liter for a simple random sample of five specimens of untreated wastewater produced at a gas field. The sample mean was 7.8 with a sample standard deviation of 1.4. Seven specimens of treated wastewater had an average benzene
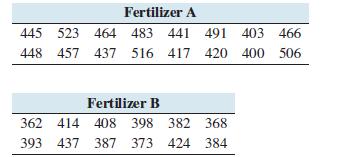
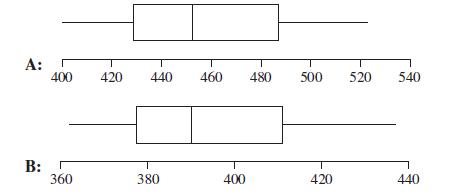
In an agricultural experiment, the effects of two fertilizers on the production of oranges were measured. Sixteen randomly selected plots of land were treated with fertilizer A, and 12 randomly selected plots were treated with fertilizer B.The number of pounds of harvested fruit was measured from
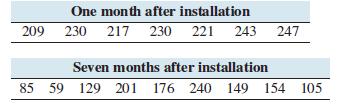
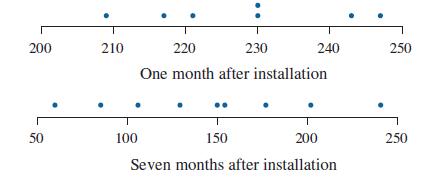
A computer system administrator notices that computers running a particular operating system seem to crash more often as the installation of the operating system ages. She measures the time (in minutes) before crash for seven computers one month after installation, and for nine computers seven
In a study of birth order and intelligence, IQ tests were given to 18- and 19-year-old men to estimate the size of the difference, if any, between the mean IQs of firstborn sons and of secondborn sons.The following data for 10 firstborn sons and 10 secondborn sons are consistent with the means and
study was done to compare the effectiveness of distance learning with traditional classroom instruction. Twelve students took a business administration course online, while 14 students took it in a classroom. The final exam scores were as follows. It is reasonable to assume that the samples come
The National Health Statistics Reports stated that a sample of 318 one-year-old boys had a mean weight of 25.0 pounds with a standard deviation of 3.6 pounds. In addition, a sample of 297 one-year-old girls had a mean weight of 24.1 pounds with a standard deviation of 3.8 pounds.a. Construct a 95%
In a survey of adults with diabetes, the average body mass index (BMI) in a sample of 1924 women was 31.1 with a standard deviation of 0.2. The BMI in a sample of 1559 men was 30.4, with a standard deviation of 0.6.a. Construct a 99% confidence interval for the difference in the mean BMI between
A survey of college students reported that in a sample of 413 male college students, the average number of energy drinks consumed per month was 2.49 with a standard deviation of 4.87, and in a sample of 382 female college students, the average was 1.22 with a standard deviation of 3.24.a. Construct
Showing 5700 - 5800
of 7930
First
51
52
53
54
55
56
57
58
59
60
61
62
63
64
65
Last
Step by Step Answers