New Semester
Started
Get
50% OFF
Study Help!
--h --m --s
Claim Now
Question Answers
Textbooks
Find textbooks, questions and answers
Oops, something went wrong!
Change your search query and then try again
S
Books
FREE
Study Help
Expert Questions
Accounting
General Management
Mathematics
Finance
Organizational Behaviour
Law
Physics
Operating System
Management Leadership
Sociology
Programming
Marketing
Database
Computer Network
Economics
Textbooks Solutions
Accounting
Managerial Accounting
Management Leadership
Cost Accounting
Statistics
Business Law
Corporate Finance
Finance
Economics
Auditing
Tutors
Online Tutors
Find a Tutor
Hire a Tutor
Become a Tutor
AI Tutor
AI Study Planner
NEW
Sell Books
Search
Search
Sign In
Register
study help
business
microeconomics principles
Microeconomics 2nd edition Dean S. Karlan, Jonathan J. Morduch - Solutions
Suppose an environmental impact study shows that the coral reef near Port Douglas, Australia, can sustain 20 scuba diving tours per week. Explain why a quota might have an advantage over a tax in this situation.
Identify whether each of the following goods is rival or nonrival.a. Cable TV.b. A pair of jeans.c. Street signs.d. Attending a baseball game.
Consider the following government-provided goods. Which of these goods necessarily require funding via general taxation (as opposed to direct user fees)?a. Street lights.b. A park.c. A fireworks display.d. Public radio.e. A library.
Suppose that the government decides to start regulating use of its forests, charging anyone who wants to log. Which of the following ways of calculating the price to charge for each acre will lead to an efficient quantity of logging?a. The sum of the marginal social value of each acre to all
Determine whether each of the following policy interventions is designed to increase supply or decrease demand for a public good or common resource.a. A city government increases the frequency of street sweeping.b. London begins charging a toll to all vehicles that drive within the city limits.c. A
Public-opinion polls in a small city have revealed that citizens want more resources spent on public safety, an annual fireworks display, and more community swimming pools. Which of these three citizen requests could be privatized by assigning property rights?
For each of the following examples, state which of these approaches is being taken to manage a common resource or supply a public good: social norms, quota, tradable allowance, government provision, or property rights. a. A nonprofit organization spray-paints signs on storm drains reminding
There is a road between the suburbs and downtown. The road becomes congested at rush hour. As long as fewer than 100 people use the road at rush hour, the trip takes 30 minutes. When the 101st person enters the road, everyone has to slow down and the trip now takes 31 minutes. People value their
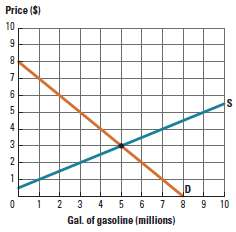
Figure 20P-1 shows a hypothetical market for gasoline.a. Suppose an excise tax of $1.50 per gallon is levied on gasoline suppliers. Draw the after-tax supply curve. What price will consumers pay? What price will sellers receive?b. How much government revenue will result from the tax?c. Suppose the
In each of the following examples, determine whether the price effect or the quantity effect dominates when the tax is applied.a. The government raises taxes on iPods from $10 per iPod to $20 per iPod. Prior to the tax increase, 10 million iPods were sold each year. The new equilibrium quantity is
Explain why it might be difficult for low income individuals to receive a college education and why the government may need to subsidize student loans for a college education.
Some people argue that unpaid internships should be illegal. In what ways is an unpaid internship part of a poverty trap?
Table 21P-3 shows the incomes of 10 households in two different years, 2020 and 2030. Each household makes a choice in 2020 about how many years of education they will acquire. Suppose each year of education costs $2,000 and households can acquire a maximum of six years of education. For the sake
Look at the various measures of poverty in 2013 for several countries in Table 21P-4. (The data are provided by the World Bank.)a. Rank the countries from the country with the highest inequality to the lowest using the Gini coefficient. (Higher Gini coefficients represent higher inequality.)b. Rank
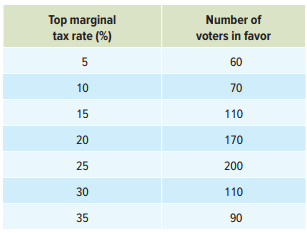
Suppose that political candidates in an election are trying to develop their policy positions regarding how high to set the top marginal tax rate. The numbers break down as shown in Table 22P-3. If the political system is a two-party system, will a candidate who believes the top marginal tax rate
Explain why political candidates in the United States often have unusual and also persistent combinations of policy preferences. (For example, a candidate that is against abortion is usually also against gun control and prefers lower taxes.)
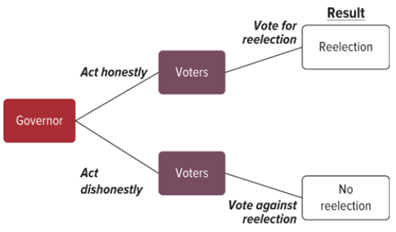
Suppose that a country currently does not allow its political leaders to be in office for more than one term. The country is considering moving from a policy of no reelection to allowing one reelection (i.e., two terms in office). Figure 22P-1 shows a governor's options while serving as governor.
Is instituting a $200 fine for anyone caught littering a nudge? Why or why not?
Suppose two parents present their 16-year-old with a list of the cars that they will allow him to buy. If the parents decide to add another vehicle to the list, is that affecting the choice architecture for their son? Why or why not?
With his first paycheck, Steve decides to buy a car. After spending hours researching the many specifications each car has—from gas mileage to horsepower—he decides to give up trying to find the perfect car based on these metrics and buys the best-looking one on the first lot he visits. Explain
Suppose you need to estimate the cost of your textbooks for the upcoming semester. What would be a good "anchor" to use in your estimate?
Jaelyn sees a sweater that she likes in a store. The price is $22. Jaelyn wouldn't usually purchase the sweater at this price, but then she notices a sign that says the sweater is marked down from $44 and decides to buy the sweater. Is Jaelyn's decision an example of a commitment device, the
Many online subscription services have “automatic renewal” policies, in which they will automatically bill you for another year’s subscription when your current one runs out. Why is this default rule a savvy business strategy on the part of the online company?
Suppose you’re trying to get your friends to go to dinner with you. Which of the following statements is more likely to convince your friends to go out to dinner?Statement 1: “The dinner would only cost $5 more than the food we would make ourselves.” Statement 2: “Dinner at our favorite
If an indifference curve is a vertical line, does the amount of the good on the y-axis influence the consumer's utility?
Use these two supply and demand equations to answer the following questions.a. What is the equilibrium price? What is the equilibrium quantity?b. Draw a graph of supply and demand and illustrate the equilibrium.c. What is the amount of consumer surplus?d. What is the amount of producer surplus?e.
Two friends are discussing their plans for the month. One works at a movie theater and gets 10 free movie tickets; the other works at a concert venue and gets 10 free concert tickets. What can we predict about the first person’s marginal rate of substitution between movies and concerts? What can
Use the demand schedule in Table BP-1 to derive a demand equation.
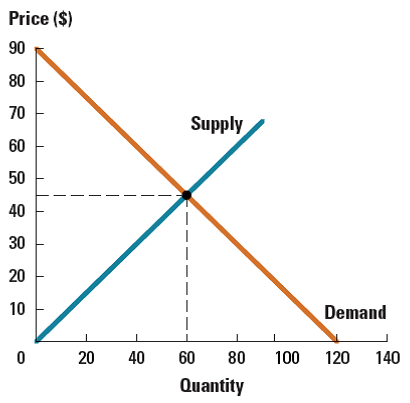
Use the graph in Figure DP-1 to answer the following questions.Figure DP-1:a. What is the amount of consumer surplus?b. What is the amount of producer surplus?c. What is the amount of total surplus? Price ($) 90 80 70 Supply 60 50 40 30 20 10 Demand 40 60 80 100 120 140 Quantity 20
Use the information about price and quantity in Table AP-3 to create a graph, with Price on the y-axis and Quantity on the x-axis. Label the resulting curve “Supply”. What is the slope of that curve?
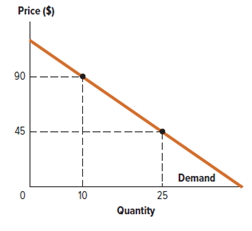
Use the demand curve in Figure BP-1 to derive a demand equation.Figure BP-1: Price ($) 90 45 i Demand 25 10 Quantity
Calculate the percentage change in each of the following examples:a. 8 to 12.b. 18 to 14.c. 130 to 120.d. 95 to 105.
Suppose you invest $500 at an annually compounded interest rate of 3 percent.a. How much will you have in 10 years?b. How much will you have in 20 years?c. How much will you have in 50 years?
If you invest $250 at an annually compounded interest rate of 10 percent, how much will you have in 3 years?
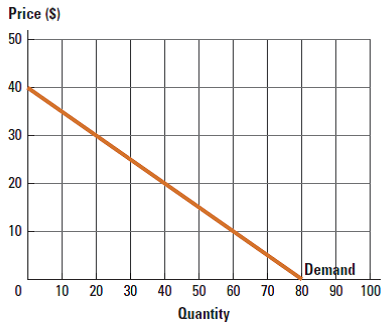
Use the curve labeled €œDemand€ in Figure AP-1 to create a table (schedule) that shows Price in one column and Quantity in another. What is the slope of the curve labeled €œDemand€?Figure AP-1: Price (S) 50 40 30 10 Demand 10 20 30 40 50 60 70 80 90 100
Your good friend tells you that althought she has a large amount of M&Ms and just a few Skittles, she would still be willing to give you the rest of her Skittles, just to get one last M&M. What characteristic of indifference curves is your friend going against?
Suppose you borrow $50 from a payday lender, who charges a monthly interest rate of 5 percent, compounded monthly.a. If you pay back the loan in one month, how much will you owe?b. If you pay back the loan in one year, how much will you owe?c. If the interest rate is raised to 6 percent rather than
Use the demand curve in CP-1 to answer the following questions. Use the mid-point method in your calculations.a. What is the price elasticity of demand for a price change from $0 to $20?b. What is the price elasticity of demand for a price change from $20 to $40?c. What is the price elasticity of
For each pair of goods listed below, state whether the indifference curves would be linear or L-shaped.• Ten dollar bills and pairs of five dollar bills.• Coffee and tea.• Bagels and muffins.• Left shoes and right shoes.
Use the curve labeled “Demand” in Figure AP-2 to create a table (schedule) that shows Price in one column and Quantity in another. What is the slope of the curve labeled “Demand”?
Use the supply schedule in Table BP-2 to derive a supply equation.
Use the demand schedule in Table CP-1 to answer the following questions. Use the mid-point method in your calculations.a. What is the price elasticity of demand for a price change from $4 to $8?b. What is the price elasticity of demand for a price change from $8 to $16?c. What is the price
Suppose that a budget constraint intersects an indifference curve at two separate points. Can either of these consumption bundles be optimal? Explain why or why not.
Use the information about price and quantity in Table AP-1 to create a graph, with Price on the y-axis and Quantity on the x-axis. Label the resulting curve “Demand”. What is the slope of that curve?
Graph the equation P = 2Q + 3. Is this the supply curve or demand curve?
Use the demand schedule in Table CP-2 to answer the following questions. Use the mid-point method when calculating elasticity.a. What is the price elasticity of demand for a price change from $2 to $3? What is the slope of the demand curve for a price change from $2 to $3?b. What is the price
Dan consumes two goods: peanut butter and jelly sandwiches, which are an inferior good, and chicken salad sandwiches, which are a normal good. He gets a raise at work. Will the ratio of peanut butter and jelly sandwiches to chicken salad sandwiches that he consumes increase or decrease?
Use the information about price and quantity in Table AP-2 to create a graph, with Price on the y-axis and Quantity on the x-axis. Label the resulting curve “Demand”. What is the slope of that curve?
Graph the equation P = -8Q + 10. Is this the supply curve or demand curve?
Haley divides her entertainment budget between movie tickets and concert tickets. Two of her indifference curves are shown in Figure EQ-1. When movie tickets are $12 and concert tickets are $20, she purchases 25 movie tickets and 45 concert tickets. This is shown on Indifference Curve 1 (IC1).
Use the curve labeled “Supply” in figure Ap-3 to create a table (schedule) that shows Price in one column and Quantity in another. What is the slope of the curve labeled “Supply”?
Rearrange the equation Q = 5 – 0.25P and sketch the graph. Is this a supply curve or a demand curve?
Your baby cousin Hubert loves lollipops and bouncy balls. Look at the indifference curves in Figure EP-1 that represent his preferences among various bundles of the two goods. Assuming the indifference curves follow the four properties outlined in this appendix, rank bundles A through D from the
Use the curve labeled “Supply” in figure Ap-4 to create a table (schedule) that shows Price in one column and Quantity in another. What is the slope of the curve labeled “Supply”?
Rearrange the equation Q = 0.2P and sketch the graph. Is this a supply curve or a demand curve?
Table EP-1 shows some possible consumption bundles for a person who consumes MP3s and lattes.a. Which bundles fall on the lowest indifference curve?b. Which bundles fall on the highest indifference curve?
The entrance fee at your local amusement park is $20 for the day. The entrance fee includes all rides except roller coasters. Roller coasters cost an extra $2 per ride.a. Write an equation that represents how much money you will spend on rides as a function of the number of rides you on: S = total
Determine whether the preferences described below would be represented by an indifference curve that is L-shaped, bows inwards, or is a straight line.a. Edgar will eat carrots only if he has hummus to go with them.b. Andrew likes to start his day right with oatmeal, but he’s just as happy
Use the information about price and quantity in Table AP-4 to create a graph, with Price on the y-axis and Quantity on the x-axis. Label the resulting curve “Supply”. What is the slope of that curve?
Use the following two equations:(1) P = 12 – 2Q(2) P = 3 +Qa. Find the equilibrium price and quantity.b. Graph the demand and supply equations. Illustrate the equilibrium point.
Jonah is completely indifferent between eating the brand name version of his favorite cereal and eating the generic version. His preferences would best be represented by which indifference curve on Figure EP-2: ICa or ICb? Are brand-name cereal of generic cereal perfect substitutes or perfect
What is the direction of slope indicated by the following examples?a. As price of rice increases, consumers want less of it.b. As the temperature increases, the amount of people who use the town pool also increases.c. As farmers use more fertilizer, their output of tomatoes increases.
With reference to Table BP-3:a. Use the information from the table to create the demand and supply equations.b. Use your demand and supply equations to solve for equilibrium.c. Graph supply and demand curves. Illustrate the equilibrium point.
A consumer is stocking up on sodas and sports drinks at the dollar store. As you might expect as a dollar store, each bottles of each drink costs $1. He has a $10 bill to spend. Based on Table EP-2 of marginal utilities, find the optimal consumption bottle.
Rank the following equations by the steepness of their slope from lowest to highest.a. y = -3x + 9b. y = 4x + 2c. y = -0.5x + 4
A consumer is buying steaks for $4 each potatoes for $1 per pound. She has $40. Plot her budget constraint on Figure EP-3 and find her optimal consumption bundle.
Under utility maximization, is it possible that after an increase in income, a consumer would remain on the same indifference curve? What about after a decrease in the price of one of the goods?
True or false? The income effect is represented by the shift in consumption of a good as a bundle moves along the old indifference curve before moving to another indifference curve tangent to the new budget line.
Tyler likes to divide his entertainment between attending basketball games and attending football games. Two of his indifference curves are shown in Figure EP-4. When football games are $25 and basketball games are $20, he chooses to attend 6 football games and 7 basketball games. This is shown in
Gabriella divides her food budget between fancy dinners and casual dinners. Two of her indifference curves are shown in Figure EP-5. When casual dinners are $12 and fancy dinners are $25, she chooses 5 casual dinners and 4 fancy dinners. This is shown in Indifference Curve 1 (IC1). A new restaurant
Which player is likely to have higher bargaining power: a large, established company shopping around for a new parts supplier, or a start-up company trying to sell its parts? Explain your answer.
In which of the following government policies is moral hazard not a concern?a. Government provides disaster relief for homeowners who lose their homes in a flood.b. Government provides unemployment insurance when workers are laid off.c. Government raises taxes to pay for social services.d.
Consider the effect of reputation and say whether you are likely to be treated better in scenario a or scenario b.a. You tell an auto mechanic that you have just moved to town.b. You tell an auto mechanic that you are moving out of town.
Two firms each have the option of polluting during production or cleaning up their production process such that they don't pollute. Of course, polluting is cheaper than not polluting. The payoffs for each of the choice combinations are shown in the decision matrix in Figure 9Q-2. The government
Which of the following are examples of tit-for-tat strategies?a. A friend forgets to send you a birthday card this year, so you decide not to send one to her on her next birthday.b. Your friend let you borrow her class notes last week, so you decide to skip class again this week.c. You and your
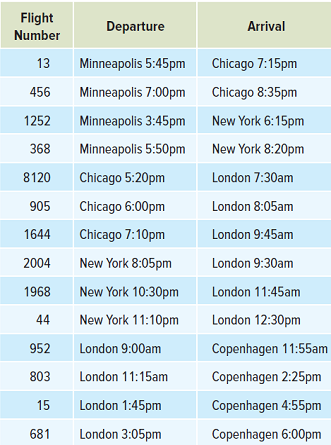
You need to travel from Minneapolis to Copenhagen; it€™s now Tuesday morning. You know you need to arrive in Copenhagen no later than 4 pm on Wednesday. Using backward induction in Table 9P-1, choose your travel itinerary. Enter the flight numbers for each leg of your trip.Table 9P-1:
Two families are trying to decide whether to donate to a fund to build a public park. The payoffs are shown in Figure 9P-1.a. What is the mutually beneficial outcome?b. Acting in their best interests, what strategy will each family choose?c. Explain why this game is or is not an example of a
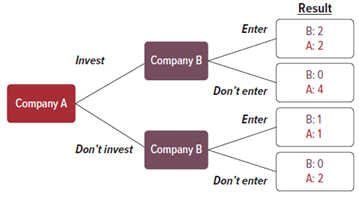
Company A is considering whether to invest in infrastructure that will allow it to expand into a new market. Company B is considering whether to enter the market. Assume the companies know each other€™s payoffs. Using Figure 9P-6, choose the outcome that will occur from the list below.a.
Job offers could be considered a one-round bargaining game with a first-mover advantage: The company offers you a job at a certain salary, and you can take it or leave it. Explain why the company might not capture all the surplus in this game, even if you can’t make a counteroffer.
There is a town with exactly 1,000 residents. 75% of the residents make healthy choices, and 25% of the residents consistently make unhealthy choices, but the health insurance company in town cannot tell who is healthy and who is unhealthy. A healthy person has an average of $600 in medical
The college admissions process involves both screening and signaling. Give an example of each. Who is doing the screening? Who is doing the signaling?
Consider the market for life insurance. Give an example of statistical discrimination an insurer might use to set premiums.
Suppose your aunt invests $2,000 for you. You are not allowed to have the money until the original amount doubles. Your aunt’s investment earns 10 percent, compounded annually. Give a rough estimate of how long it will take before you can access the money your aunt invested for you.
If you deposit $500 in a savings account that offers 3 percent interest, compounded annually, and you don’t withdraw any money, how much money should you expect to have in the account at the end of three years?
Many individuals prefer to have insurance (health insurance, car insurance, etc.) rather than not, even if the expected value of their wealth is higher without insurance. What does this imply about their willingness to take on risk?
Lenders tend to offer lower interest rates to borrowers with high credit scores and higher interest rates to borrowers with low credit scores. What does this imply about lenders' willingness to take on risk?
Consider the following scenarios. For each scenario, determine whether a risk averse person will definitely choose Option A, definitely choose Option B, be indifferent between Options A and B, or might choose either Option A or B.a. Option A: There is a 50% chance of winning $1,000 and a 50% chance
You come home to discover that your roommate has left their dirty dishes in the sink (again!). Why might you be likely to leave your own dirty dishes in the sink (which you know annoys your roommate), even though you usually prefer a clean kitchen to a messy kitchen?
The market shown in Figure 6P-9 is in equilibrium. Suppose there is a $15 per unit subsidy given to buyers.a. Draw the after-subsidy demand curve.b. Plot the after-subsidy price paid by consumers and the after-subsidy price paid by sellers.Figure 6P-9: Price ($) 70 65 60 55 50 45 40 35 30 25 20 15
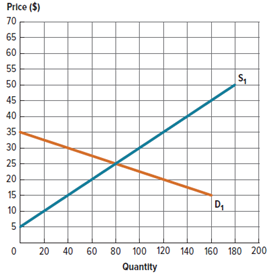
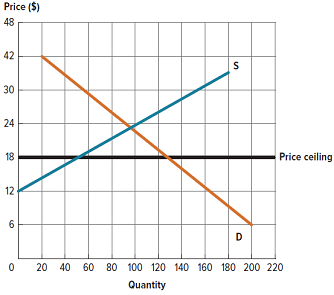
Consider the market shown in Figure 6P-1. The government has imposed a price ceiling at $18.a. At a price ceiling of $18, what is quantity demanded? Quantity supplied?b. At this price ceiling, is there a shortage or a surplus? By how many units?Figure 6P-1: Price ($) 48 42 30 24 Price ceiling 18 12
Based on Figure 5P-8, choose all of the following options that are true.a. The market is efficient.b. Total surplus is higher than it would be at market equilibrium.c. Total surplus is lower than it would be at market equilibrium.d. Producer surplus is lower than it would be at market
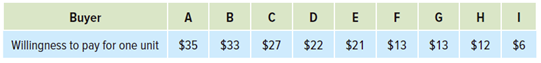
Answer the following questions based on Tables 5P-3 and 5P-4. a. What is the quantity demanded at $10? What is the quantity supplied at $10?b. What is the quantity demanded at $25? What is the quantity supplied at $25?Table 5P-3:Table 5P-4: Buyer A Willingness to pay for one unit $35 $33 $27
Consider a market in equilibrium. Suppose supply in this market increases. How will this affect consumer surplus? Explain.
Consider a market in equilibrium. Suppose demand in this market decreases. How will this affect producer surplus? Explain.
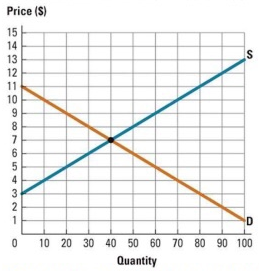
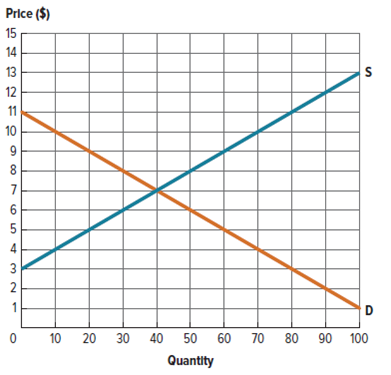
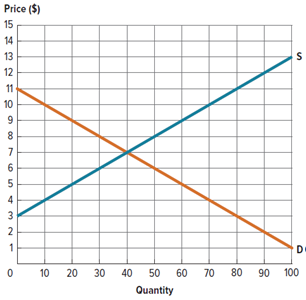
Based on Figure 5P-2, consumer surplus is $0 when price is greater than or equal to what price?Figure 5P-2: Price ($) 16 15 14 - 13 - 12 - 11 10 8 5 4 2 D 10 30 20 40 50 60 70 90 100 Quantity
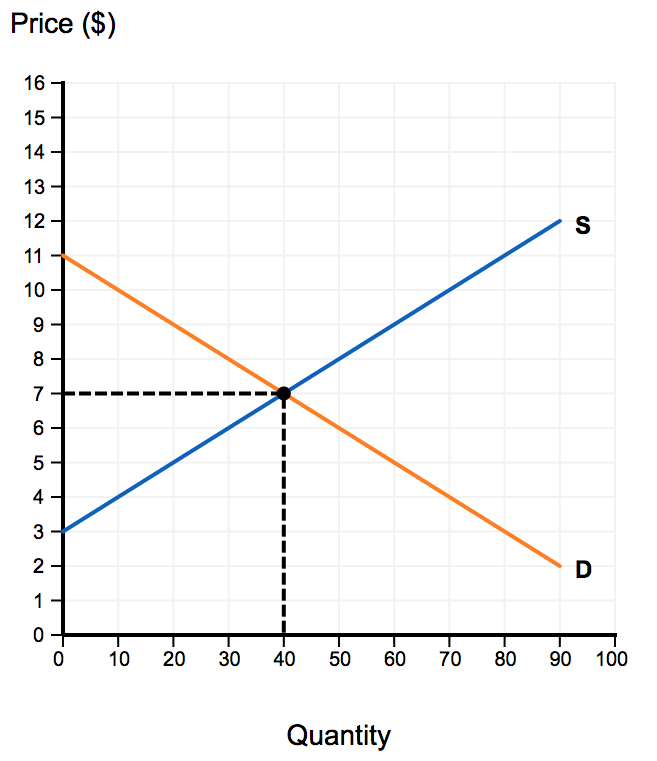
Use the market represented in Figure 5P-2 to plot the equilibrium price and quantity and to draw the consumer surplus when the market is in equilibrium. What is the value of consumer surplus at the equilibrium price?Figure 5P-2: Price (S) 15 14 13 12 11 10 8. 0 10 20 30 40 50 60 70 80 90 100
Use the market represented in Figure 5P-2 to draw the consumer surplus when the price is $5. What is the value of consumer surplus at this price?Figure 5P-2: Price ($) 15 14 13 12 11 10 4 3 30 10 20 40 50 60 70 80 90 100 Quantity
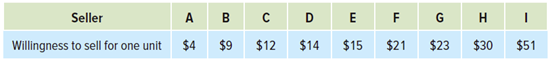
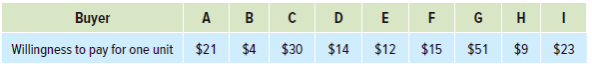
Based on Table 5P-6, calculate producer surplus for each producer when the price is $20. What is total producer surplus at this price?Table 5P-6: Buyer A в DE $14 $30 Willingness to pay for one unit $21 $4 $12 $15 $51 $9 $23
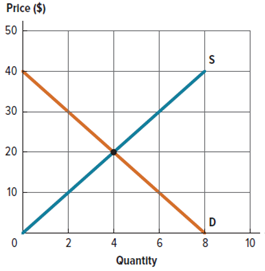
Consider the market represented in Figure 5P-7.a. Draw the consumer surplus and the producer surplus at the equilibrium price and quantity. What is the value of total surplus at equilibrium?b. Draw the consumer surplus and the producer surplus if the price is $30. What are the values of consumer
Based on Figure 5P-2, producer surplus is $0 when price is less than or equal to what price?Figure 5P-2: Price ($) 15 14 13 12 11 10 De 10 20 60 70 80 100 30 40 50 90 Quantity
Showing 5000 - 5100
of 5615
First
43
44
45
46
47
48
49
50
51
52
53
54
55
56
57
Step by Step Answers