New Semester
Started
Get
50% OFF
Study Help!
--h --m --s
Claim Now
Question Answers
Textbooks
Find textbooks, questions and answers
Oops, something went wrong!
Change your search query and then try again
S
Books
FREE
Study Help
Expert Questions
Accounting
General Management
Mathematics
Finance
Organizational Behaviour
Law
Physics
Operating System
Management Leadership
Sociology
Programming
Marketing
Database
Computer Network
Economics
Textbooks Solutions
Accounting
Managerial Accounting
Management Leadership
Cost Accounting
Statistics
Business Law
Corporate Finance
Finance
Economics
Auditing
Tutors
Online Tutors
Find a Tutor
Hire a Tutor
Become a Tutor
AI Tutor
AI Study Planner
NEW
Sell Books
Search
Search
Sign In
Register
study help
business
regression analysis
Introductory Regression Analysis With Computer Application For Business And Economics 1st Edition Allen Webster - Solutions
When would an interaction term be incorporated into a model? Explain its intended purpose. Provide an example of a regression model that would use an interaction term. Give an interpretation of the interaction term in your model.
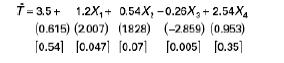
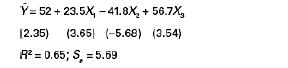
As the product manager for a chemical company you must analyze the time required for a chemical reaction to be completed. A regression model to estimate time T measured in hours is provided here showing t-values in parentheses and p-values in brackets.Comment on the model. Are there any changes you
El Dorado Industries sells perishable farm products to retailers throughout its market area. Recently, losses due to spoilage have reached unacceptable levels and the Quality Control Division has been asked to explain what factors might be associated with these losses.Data for n = 150 observations
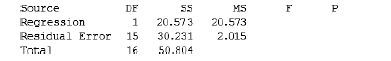
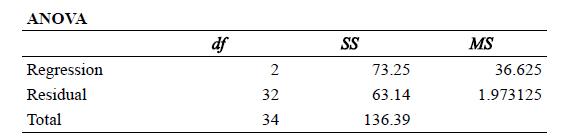
Based on the Minitab printout of an ANOVA table from a regression model with two RHS variables:Analysis of Variancea. Fill in the missing values. Use the FINV and FDIST Excel functions if needed.b. How many observations were in the data set? DF 55 1 20.573 30.231 50.804 Source Regression Residual
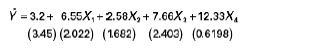
Given these results with t-values in parentheses for a model with 30 observations,find the p-values for all variables. Y =3.2+ 6.55X, +2.58X, +7.66X, +12.33X (3.45) (2022) (1682) (2.403) (0.6198)
Access the data file AIRPORT, which contains data for the number of minutes late that flights arrived at Chicago O'Hare Airport (Y), the number of minutes late that flights departed to Chicago (X1), the number of passengers (X2), whether the flight faced inclement weather(X3), encoded with a
An investment analyst wishes to explain his clients' rates of return on their portfolios using two variables measuring returns from stocks and three from bond mutuals. The results of an unrestricted model are shown here along with a reduced model with just the stock returns.Based on this
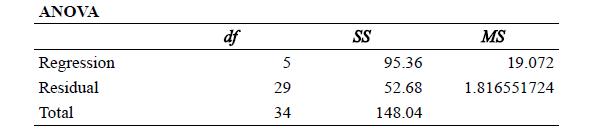
Part of an ANOVA table appears as seen here. The rest was obliterated by the Division Chief when he placed his morning coffee cup on the computer printout. But now he wants to know if the model as a whole is significant at the 5% level based on a global test. Complete the ANOVA table and provide
What is the critical F-value in the preceding problem at the 5% level?At the 1% level?
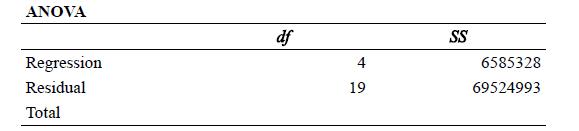
A production function for auto factories estimates output (Q) using as predictor variables labor (L), capital (K), and hours of training for all employees (T).a. Using your preferred software, access the file OUTPUT and estimate the model.b. Discuss the significance of the RHS variables.c. Comment
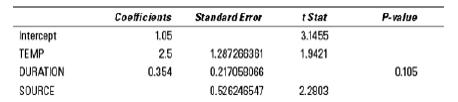
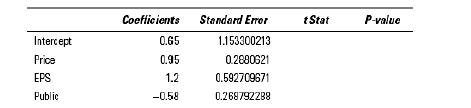
An investment broker is interested in predicting stock dividends based on the three variables shown below in the partial Excel output. Public is whether the company is publically or privately held. It's encoded as“1” if it's held privately. n = 16. Complete the table and comment on the model.
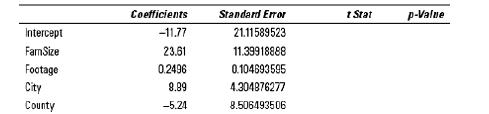
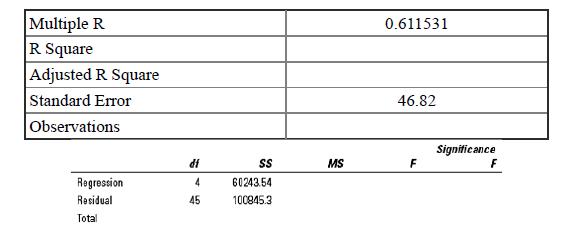
As energy costs skyrocket, customers of Burlington Power expressed concern over their home heating bills. The staff at Burlington selects a sample of n = 50 home owners to form a data set regressing monthly invoices for February on family size, square footage of the home, and if the home was
Draw a graph depicting the three living locations in the previous problem.Previous problem As energy costs skyrocket, customers of Burlington Power expressed concern over their home heating bills. The staff at Burlington selects a sample of n = 50 home owners to form a data set regressing monthly
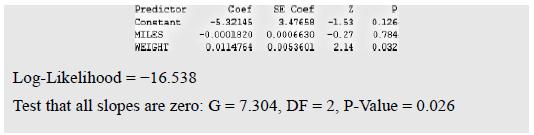
Man's Best Friend Dog Food Company plans to market a new dry dog chow in certain test cities around the nation. Primary interest rests on the weight gain it creates in various dog breeds. Data are provided in the MAN'S BEST FRIEND data set. WEIGHT is the weight of the dog in pounds after eating the
Discuss the characteristics residuals must exhibit to ensure that the regression model obey all the Gauss-Markov assumptions. Use graphical work in each case.
What is meant by the statement that error terms must display a constant variance? Use a graph in your answer.
Distinguish between homoscedasticity and heteroscedasticity. Use a graph.
What conditions are most likely to precipitate heteroscedasticity?
What is meant by a standardized regression coefficient? How is it used in regression analysis?
A model is reported to be Ŷ = 5 + 7.2A + 5.8B − 2.4C. The standard deviation of each is SY = 2.7, SA = 3.8, SB = 0.58, and SC = 6.5. Which variable, A, B, or C, is most influential in determining Y?
Describe how backward elimination, forward selection, and stepwise regression operate to produce a model. What caution should be exercised in their use?
A model with n = 65 observations is reported as seen below with tvalues in parentheses. Y is expressed in thousands, X1 in hundreds, X2 in thousands, and X3 in single units.a. What are the standard errors for each variable?b. What are the p-values for all variables?c. What is the adjusted
Access the file PUBLIC TRADING. It contains data for the rate of return (ROR) measured in percentages, a risk level, the amount of the original investment (OIV), whether the stock is traded publically(entered as a “1” if it is), and the number of years the investor has held the stock. The
King Soda, a nation-wide bottling company, notices that their bestselling product does not conform to the mean weight of 30 ounces in each container. Management suspects that the temperature in their three plants in Kansas City, Chicago, and Denver may explain the malfunction. A study of 40
Discuss the destructive nature of the problems that beset the linear probability model.
Distinguish between a logit model and a limited dependent variable model. Give an example of each.
Write out and explain the equation for the cumulative distribution function.
Your colleague at work argues that the cumulative logistic distribution function is linear in the parameters but not in the variables. Is she correct? Explain your response.
Explain the statement, “the cumulative logistic distribution function is linear in the logs.” Use an equation in your answer.
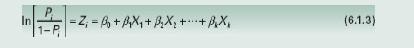
Why is Equation (6.1.3) called the “log of the odds ratio”? In 1 - P = , = B + BX + BX + + BX (6.1.3)
What exactly does the coefficient of Equation (6.1.3) measure? In 1 - P = Z = A + BX + BX + + BX (6.1.3)
Why is R2 not a good measure of fit in a logit model?
Explain the nature of the log-likelihood ratio. What does it measure?
Explain why a low log-likelihood ratio indicates a better fit.
Discuss the limitations imposed by the restrictive assumption placed on the discriminant model.
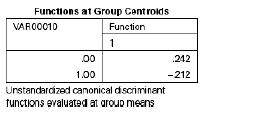
What is the role of the centroid and how is it formed?
How is the cutoff score computed and what role does it play in modeling?
What is meant by cross-validation in a discriminant model? Why is it done and how does it work?
What role does the Maximum Chance Criterion play in discriminant analysis?
How is PRESS'S Q-statistic used in discriminant analysis?
Over the last few years Standard and Poor's, a financial services company and credit-rating agency, has downgraded, or threatened to downgrade, the credit rating for several nations around the globe. “It's always possible the rating will come back for many of these countries, but we don't think
Investment analysts for a large international consulting firm in Paris estimate a logit model to predict the likelihood their major clients will withdraw their account and move to a competing firm. The predictor variables are the monetary value (MV) of the present account and the rate of return
Thirty shipments by TransAtlantic Express designed to predict the likelihood a shipment would reach its port of destination on time yields the following information:a. What is the likelihood a 500-ton shipment destined for a port 2,000 miles away will reach port on time?b. Given the results seen
A logit model with 50 observations and three RHS variables reports a χ2 of 13.7, a −2 log-likelihood for the restricted model of 42.7, and a −2 log-likelihood for the unrestricted model of 29. If =CHIINV(.01,3) = 11.344, is the model significant at the 1% level? That is, does including the
The dean of a business school wants to identify students most likely to successfully complete a master's degree in economics on the basis of a test score and their rank in undergraduate school. The data in the accompanying table produced the discriminant function seen here. Each observation that
Write and explain the formula you would use to correct for heteroscedasticity if the population variances were known. Why and how does this process correct for heteroscedasticity?
Prove that after transforming the data as explained in the question above, homoscedasticity prevails.Question aboveWrite and explain the formula you would use to correct for heteroscedasticity if the population variances were known. Why and how does this process correct for heteroscedasticity?
Why is the solution to heteroscedasticity as proposed in the first two questions unlikely to occur?
Explain the meaning behind Equation (7.3.4). What is it telling you to do? Var(e,)=o=oX (7.3.4)
Explain how the transformation described in this section turns the pretransformed slope into the intercept and vice versa.
Using your preferred computer software and the data from problem 6 in Section 7.2, correct for heteroscedasticity. Assume Var (εi) = σ2 i =σ2X2 i, where Xi is bank balances.Data from problem 6 in Section 7.2The Council of the European Union7 has raised concern regarding the international trading
Define elasticity. How is it measured?
Explain how the use of logs produces a measure of elasticity.
Your research assistant has discovered that the model you have been working with to explain changes in shipping costs suffers from heteroscedasticity. She bemoans the loss of time and the increased expense required to collect a larger data set in order to correct the problem. How do you respond?
As a city planner for the National Health Service in London, England, your duties include reconciling differences with the provisions for healthcare elsewhere in the United Kingdom. Would you expect to encounter any problems with heteroscedasticity among the numerous metropolitan areas? Explain and
Why are cross-sectional studies less likely to be afflicted with autocorrelation but highly subject to heteroscedasticity?
Clearly describe the steps that must be taken to test for heteroscedasticity using the tests described in this chapter. What advantages and disadvantages does each offer?
Explain how the slope coefficient and the intercept become interchanged when correcting for heteroscedasticity.
Define and give examples of elasticity. Clearly explain how the use of logs results in measures of elasticity.
Prove that weighted least squares result in homoscedastic models. Use all necessary equations in your response.
Distinguish between pure and impure heteroscedasticity.
Discuss the relationship between elasticity and the manner in which price changes affect total revenue. If a firm's goal is to raise revenues, should it increase or decrease price if demand is elastic? Inelastic?Explain your answers.
Demonstrate using the proper formulas discussed in this chapter how a double-log model gives the measure of elasticity for a function.
Define autocorrelation. Why is it more likely to occur with the use of time series data than with cross-sectional data?
Distinguish between first-order and higher-order autocorrelation. Give examples of each.
Why does the cyclical nature of economic and business activity tend to result in autocorrelation? What does the issue of “stickiness” have to do with this matter?
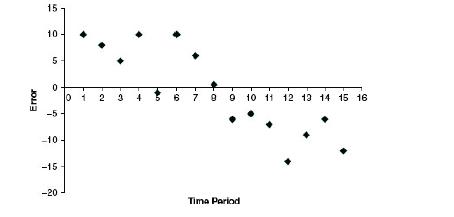
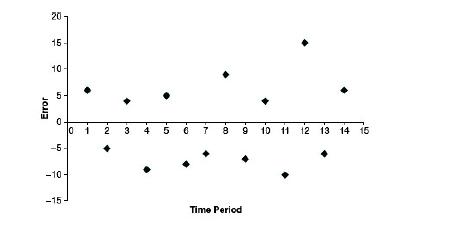
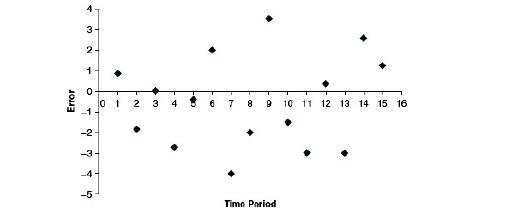
Distinguish between positive and negative autocorrelation. Define and give examples. How might a graph of each appear?
Examine the graphs below and comment on your perception of whether autocorrelation might be an issue and if so, is it positive or negative autocorrelation? Error 15 10 5 0 -5 -10 -15 -20 0 1 2 3 4 Han 5 16 7 9 9 10 11 12 13 14 15 16 Tima Period
What are the primary causes of autocorrelation? Which is more difficult for the researchers to correct for?
How does an omitted variable affect the error term in a model and what implications does that have for autocorrelation?
Why does “stickiness” occur more often in time series data?
Why is autocorrelation more likely to occur with time series data than with cross-sectional data? Distinguish between the two types of data, giving examples of each, in your response.
What two conditions must exist to ensure a model is properly specified? Give examples in both cases.
How might autocorrelation bias the coefficient estimates, bi?
How does autocorrelation impact the standard error of the coefficient estimate?
What is meant by bias in an estimator? What is meant by consistency of an estimator? What is the difference between an estimate and an estimator? Give examples.
Does autocorrelation promote inefficiency in estimators? Explain.
Explain how the Durbin-Watson statistic tests for autocorrelation.
Explain why Durbin-Watson values can distinguish between positive and negative autocorrelation.
Why does the Durbin-Watson fall between 0 and 4?
Why does a Durbin-Watson close to 2 indicate the absence of autocorrelation?
How does the Durbin-Watson h adjust in the test for autocorrelation?Under what condition(s) should it be used?
Under what conditions is the Durbin-Watson test unreliable in its search for autocorrelation?
How can a simple hypothesis test be used to test for autocorrelation?
How can a runs test for randomness be used to test for autocorrelation?
Given the residuals 4, −5, 6, −7, −2, 6, and −7, with k = 1, does autocorrelation exist at the 5% level? At the 1% level?
What is meant by generalized least squares (GLS)? How does it work to correct for autocorrelation?
What is “transformed” in the application of GLS? Describe how that transformation takes place.
How does the Prais-Winsten technique modify the GLS?
How can a lagged variable be used to mitigate the ill-effects of autocorrelation? Devise your own original model to illustrate.
What is first-differencing and how does it reduce the harm imposed on a model by the presence of autocorrelation? Devise your own original model to illustrate.
What happens to the standard errors of the regression coefficients in the presence of autocorrelation? Why is this likely to increase the probability of a Type II error?
Fully discuss the consequences of autocorrelation.
Discuss the advantages and disadvantages of each of the methods discussed in this chapter to transform data to deal with the problems of autocorrelation. Under what conditions would one method prove superior to the others?
What problems are caused by the presence of autocorrelation and how might they affect your model?
Explain clearly why the Durbin-Watson statistic ranges between 0 and 4.
How does autocorrelation increase the probability of a Type I error?Use a graph to fully explain.
Discuss in detail the steps that must be carried out to transform the data for the Cochrane-Orcutt method of correcting for autocorrelation.
Discuss the merits and drawbacks of each of the methods presented in the chapter to correct for autocorrelation.
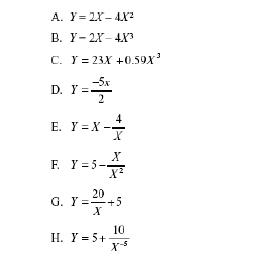
Which of the following are: (1) quadratics, (2) polynomials, (3) both,(4) neither? A. Y=2X-4X B. Y-2X-4X C. Y=23X +0.59X -5x 2 D. Y=. E. Y=X- X X F. Y=5-- H. Y = 5+ X 20 G. Y+5 10 X-5
Showing 1900 - 2000
of 2175
First
8
9
10
11
12
13
14
15
16
17
18
19
20
21
22
Step by Step Answers