New Semester
Started
Get
50% OFF
Study Help!
--h --m --s
Claim Now
Question Answers
Textbooks
Find textbooks, questions and answers
Oops, something went wrong!
Change your search query and then try again
S
Books
FREE
Study Help
Expert Questions
Accounting
General Management
Mathematics
Finance
Organizational Behaviour
Law
Physics
Operating System
Management Leadership
Sociology
Programming
Marketing
Database
Computer Network
Economics
Textbooks Solutions
Accounting
Managerial Accounting
Management Leadership
Cost Accounting
Statistics
Business Law
Corporate Finance
Finance
Economics
Auditing
Tutors
Online Tutors
Find a Tutor
Hire a Tutor
Become a Tutor
AI Tutor
AI Study Planner
NEW
Sell Books
Search
Search
Sign In
Register
study help
business
regression analysis
Introductory Regression Analysis With Computer Application For Business And Economics 1st Edition Allen Webster - Solutions
Can a cubic be a polynomial? Explain and give an example.
Are all quadratics polynomials? Give examples and explain your answer.
Are all polynomials quadratics? Give examples to support your answer.
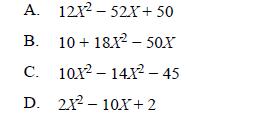
Solve the following quadratic equations using all three methods demonstrated in this section. A. 12X2-52X+50 B. 10 + 18X-50X C. 10x14X-45 D. 2X210X+2
A revenue curve proves to be R = −X2 + 58X + 52, where X is output.Use the vertex to determine how many units of output the producer should sell to maximize revenue. Roughly graph the revenue function.Does it confirm your answer?
An average cost curve reports to be AC = 214 + 5X2 − 10X. At what level of output is average cost minimized?
Access the file PRODUCTION FUNCTION in which output is expressed as a function of the number of labor hours used in the production process. Graph the relationship with output on the vertical axis. What do you presume is the relationship between the two variables? Estimate the model using your
Access the file PRODUCTION FUNCTION 2 in which Input is used as an independent variable to explain changes in Output.a. Graph the relationship with Output on the vertical axis. What do you observe?b. Estimate the proper model using your chosen computer software.Collect the residuals.c. Plot the
Access the file COST FUNCTION. It is a model in which the total cost of production is a function of factor inputs used in the production process.a. Graph the function. Comment on its likely functional form.b. Create the additional variables needed to correspond to the form you have chosen in part
Access the file QUANTITY OF TEA. It contains data for the amount of tea purchased in 50 different cities during a selected month of the year 2009 in Ireland and the prices of both tea and coffee. Estimate and discuss a model to explain the quantity of tea based on the prices of tea and coffee.
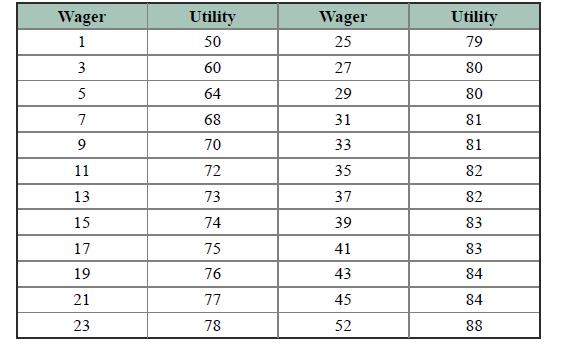
Economic theory is often concerned with utility functions that measure the satisfaction (utility) economic agents derive from participating in the market. A “risk-taker” is one who gains such utility from economic gambles, whether they are found at the gaming tables in casinos or involved with
Economists use utility functions to assess the degree of utility or satisfaction consumers receive from consuming goods and services.The functions are derived using regression techniques and measure satisfaction in hypothetical units called “utils.” A consumer's utility function is estimated to
Express the utility function in the previous problem in double-log terms. Does the expression confirm your answer to part C of the previous problem?Previous problemEconomists use utility functions to assess the degree of utility or satisfaction consumers receive from consuming goods and
Identify and give examples of the following terms:A. Polynomial.B. Quadratic.C. Second-order polynomial.D. Degrees of homogeneity.E. Increasing, decreasing, and constant returns to scale.F. Elasticity of Y with respect to X.G. Utility function.H. Time value of money.I. Future of money.J. Geometric
Describe the functions listed here. Under what conditions would each be appropriate? What are the characteristics of each?A. Double-log.B. Log-linear.C. Linear-log.D. Reciprocal.E. Exponential.F. Mixed models.
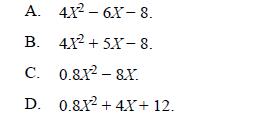
Solve the following quadratic equations using all three methods described in the chapter. A. 4X26X-8. B. 4X2 +5X-8. C. 0.8X-8.X. D. 0.8X+4X+ 12.
A firm's total revenue curve is estimated to be TR = −2.5Q2 + 15Q + 56. At what level of output should the firm operate to maximize revenue? What is TR at that point? What are the measures of TR for levels of Q one unit below and one unit above that point, where TR is maximized? Graph the
An average cost curve is found to be AC = 89.96 + 0.0179Q2 − 2.294Q. At what level of output is average cost minimized?
Given the AC curve in the previous problem, what is the total cost function?Previous problemAn average cost curve is found to be AC = 89.96 + 0.0179Q2 − 2.294Q. At what level of output is average cost minimized?
Corell Transport hauls heavy cargo between several major cities across the country. Rising fuel costs have caused a concern within upper management over future profit levels. Access the file CORELL TRANSPORT containing data for miles driven in thousands and average costs in hundreds of dollars.
Given the data for Corell Transport in the previous problem, estimate the linear model and compare it with the non-linear, quadratic model.Previous problemCorell Transport hauls heavy cargo between several major cities across the country. Rising fuel costs have caused a concern within upper
Residents of Lonesome, Arizona operate a co-operative agricultural center on the outskirts of town. Data for the quantity of kumquats sold in hundreds of pounds along with the total revenues and total costs associated with the operations are found in the data file LONESOME.Using your preferred
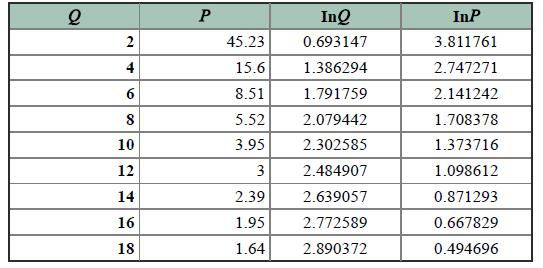
The demand function for lumber products is thought to take the form P = AQ−b. Data were collected and displayed in the table below. One of your co-workers suggests a linear model regressing P on Q. Based on the anticipated function shown below, you suggest a doublelog model.A. Using your
Utility functions measure the satisfaction consumers derive from the consumption of goods and services. They are often expressed as U = AQa 1Qb 2, where Q1 and Q2 are two commodities and A is a parameter.What are the measures of elasticity of U with respect to the two goods?Under what conditions
Based on data compiled from the American Farmers Association, a non-profit organization established in 1983, demand for Idaho potatoes is estimated aswhile demand for imported agricultural crops isWhat are the relevant coefficients in each model?Interpret the coefficients. P=3.558-0.8879Q
A Cobb-Douglas production function is Q = 12L.6K.5. What happens to Q if L increases by 1%? If K increases by 1%? What can you say about returns to scale?
With the Cobb-Douglas production function in problem 11, if L = 10 and K = 15, what is Q? If L increases by 1% what is the level of output, Q? What percentage increase is that? How does that compare with the exponent of the function?Problem 11A Cobb-Douglas production function is Q = 12L.6K.5. What
A semi-log (log-lin) consumption function states InC = 2 + 0.058I in which lnC is the log of consumption for a small national economy measured in billions of monetary units and / is the income (measured as GDP) in trillions of units. If / increases by one unit::A. What happens to C?B. Calculate C.
Based on the information in problem 13, if / is currently 10 what is C?If / increases by one unit to 11, what is C? What percentage increase is that?Problem 13A semi-log (log-lin) consumption function states InC = 2 + 0.058I in which lnC is the log of consumption for a small national economy
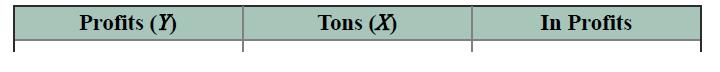
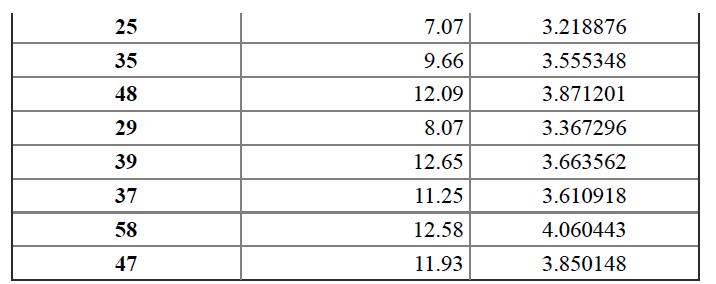
Given the data shown here for profits in 1,000s and tons sold:A. Compute the linear model and the log-linear model. What happens to Y as X changes by one ton according to both models?B. According to the linear model, what is Y if X = 7.07? What does the semi-log model predict if X = 7.07? How do
Access the file UTILITY, which contains data for the utility or satisfaction (Y) a consumer derives from the consumption of a certain good as a function of the number of units consumed (X). Graph the function. Based on the graph, what form of the function do you feel would best estimate the
A catastrophic plague has infected the citizens of Ephinacious, a small country somewhere in an obscure part of the world. Currently, 4,000 poor souls are infected and the disease is growing at the rate of 23.5% per day. The locals want to know how many will be contaminated in 10 days. What is your
Employees at Harvard Trust and Insurance number 1,258. Hard economic times have caused HTI to dismiss some workers at the rate of 3.5%. If less than 1,000 employees remain after three years, a bond rating agency will downgrade HTI's debt issue. Will this happen?
You currently have $43,000 at your ready disposal. An investment you plan to pursue in six years requires $60,000. If you place the $43,000 in an account paying 5.5% annually, will you have the required amount to make the investment?
If the interest in problem 19 is paid continuously, will you have the $60,000?Problem 19You currently have $43,000 at your ready disposal. An investment you plan to pursue in six years requires $60,000. If you place the $43,000 in an account paying 5.5% annually, will you have the required amount
Monthly sales at Freeman International have been, in thousands, 45.2, 56.3, 54.8, 62.5, 74.5, 69.3, and 71.2. If the growth rate in sales exceeds 8%, the Chief Financial Officer will give himself a 30% raise.Does he get it?
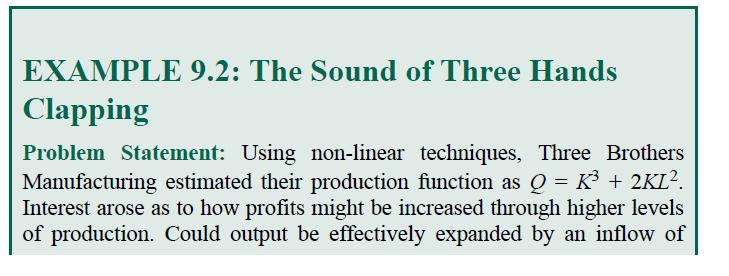
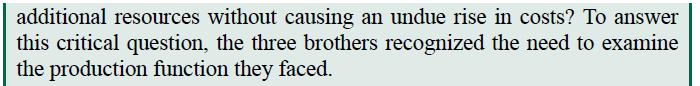
The Three Brothers from Example 9.2 face per unit costs of $100 for capital and $50 for labor. They sell the product for $3.75 per unit. If they double all inputs it is felt that they will have no effect on the market price of the inputs, but to sell the additional output they will have to lower
A societal utility function for an entire nation is found to be In U = 3.2− 0.52lnG + 0.47 InB, where G and B are guns and butter. Interpret thecoefficients. What happens to utility for the nation if 1% more guns areproduced? 1% more butter?
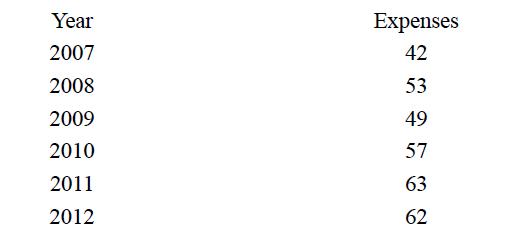
Travel expenses for Remi Electronics have been increasing at an alarming rate. In an effort to control this unfortunate trend, management has declared that if costs reach or exceed $70 thousand by 2014 drastic measures must be taken. Given the costs in thousands shown here, calculate the geometric
Inventory levels for Remi are currently held at $400,000 and have been increasing at a rate of 6% over the past 10 years. In order to hold down inventory costs, Remi has decided that if they exceed $530,000 in five years alternative methods must be used to satisfy customer demand in a timely
If the growth rate was continuous for Remi in the previous problem, what is your conclusion?Previous problemInventory levels for Remi are currently held at $400,000 and have been increasing at a rate of 6% over the past 10 years. In order to hold down inventory costs, Remi has decided that if they
Define and give examples of each of the following:A. Endogenous variables.B. Exogenous variables.C. Pre-determined variables.D. Structural equations.E. Reduced-form equations.F. Order and rank conditions.G. Shift parameter.
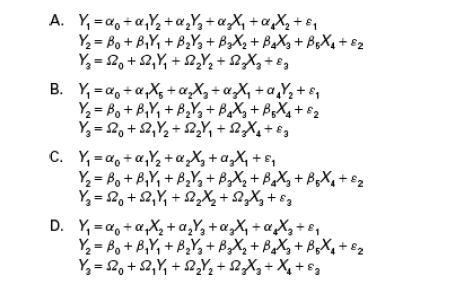
Given these structural systems in which the Y-variables are endogenous and the X-variables are exogenous, place them in reduced form: A. Y =a+aY+Y/+X +X + E Y= Bo + BY+ BY3 + BX + BX + B5X + 2 Y= 20 +2Y +22 Y + X +8 B. Y =a+aX+X +X + aY/ +8 Y= Bo + BY+BY+ BX + BX + Y = 120 + 52 Y +52Y+ 2X+ C. Y =
Which equations are identified in each of the systems in question 2 and which are not? Explain.Question 2Given these structural systems in which the Y-variables are endogenous and the X-variables are exogenous, place them in reduced form: A. Y = a+aY+Y/+X +X + E Y= Bo + BY+ BY3 + BX + BX + B5X + 2
Clearly explain under what conditions a 2SLS model is required.Construct a system of your own making that illustrates.
Clearly explain why bias occurs in a simultaneous system. What does your response have to do with the error terms?
How do the coefficients of OLS models and those obtained from 2SLS models differ? What does this say about the bias that exists in the estimations?
In your own words thoroughly explain the identification problem and give an example.
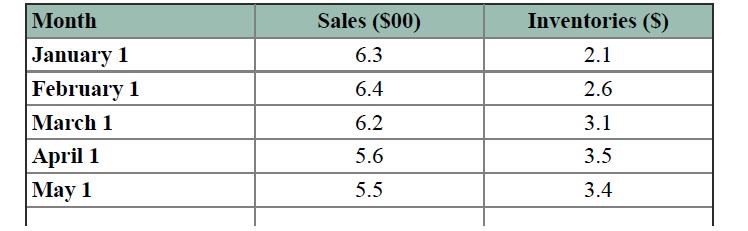
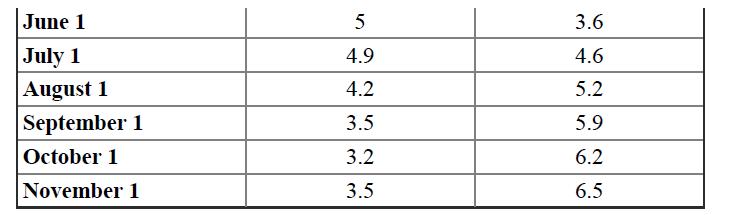
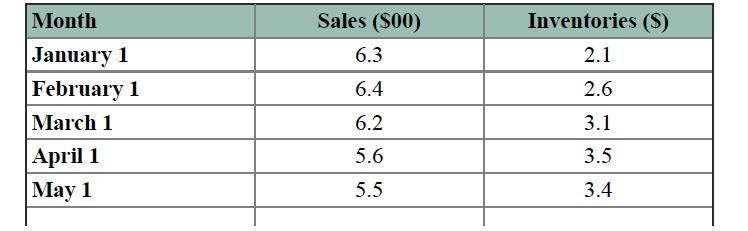
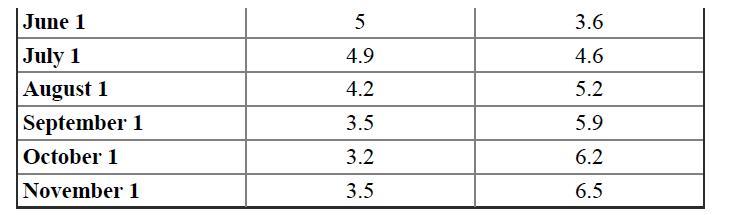
As sales decline at Duddly Dufus Enterprises, inventories tend to reach an abnormally high level. The accompanying monthly data in hundreds of dollars record these trends. Develop and interpret the simple time series model for each variable shown here. What is your forecast for April of the next
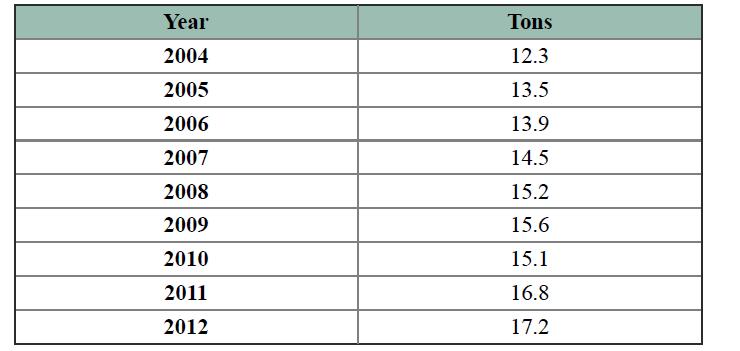
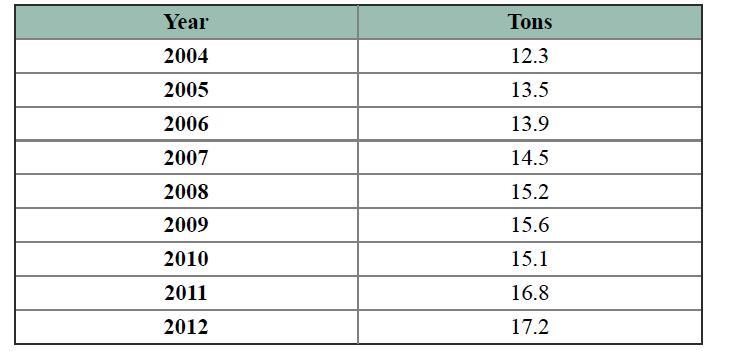
Annual measures of output measured in thousands of tons produced for LLW Industries are shown in the accompanying table. If productivity exceeds 19 tons by 2016 the CEO of the firm will give all employees an additional increase in pay of $10,000. Will they receive the bonus? Year 2004 2005 2006
Quarterly data for the number of employees and their weekly earnings are contained in the data set EARNINGS. Develop simple time series models for both employees and earnings. Discuss your findings and evaluate the models. What are your predictions for the third quarter of 2012? Discuss these
The Dow Jones Industrial Average is a stock market index created by Wall Street Journal and Dow Jones & Company, co-founded by Charles Dow on May 26, 1896, and now owned by Dow Jones Indexes. The average is named after Dow and one of his business associates, statistician Edward Jones. The index
Using the data from the first problem in Section 11.1 for Duddly Dufus Enterprises, estimate an autoregressive model. Experiment with different values for p-order models until you have what you think is the most justifiable model. Explain your final model. Compare it with the time series model you
Using the data from the second problem in Section 11.1 for LLW Industries, estimate an autoregressive model. Experiment with different values for p-order models until you have what you think is the most justifiable model. Explain your final model. Compare it with the time series model you estimated
Using the data from the third problem in Section 11.1 for the data set EARNINGS, estimate an autoregressive model. Experiment with different values for p-order models until you have what you think is the most justifiable model. Explain your final model. Compare it with the time series model you
Using the data from the fourth problem in Section 11.1 for DOWJONES INDUSTRIALS, estimate an autoregressive model.Experiment with different values for p-order models until you have what you think is the most justifiable model. Explain your final model.Compare it with the time series model you
In what way does the Koyck transformation resolve problems often associated with distributed lag models?
Given Yt = β0Xt + λYt−1, what is the short-run effect of a one-unit change in X? What is the long-run impact (multiplier) for the model?
Presume Yt = 4 + 0.73Xt + 0.291Yt−1 in a model with two lagged values. Find the coefficients for the lagged X-values.
Access the file KOYCK. Test for autocorrelation based on a Koyck model.
Discuss the differences between the Koyck and Almon lag procedures.Which do you feel is more applicable to real-world data? Why? What are the advantages and disadvantages of each?
Access the file GRANGER. The data set contains more extensive data for GNP and the money supply. Perform Granger causality tests with m = 3. Test for causality at 10% in both directions.
Under what conditions can the Granger causality be applied? What is its purpose?
In what way is the Granger test a distributed lag model?
Define and give examples of:A. Secular trend.B. Seasonal component.C. Cyclical variation.D. Irregular fluctuations.
What is the purpose of moving average and exponential smoothing?
Describe, define, and give examples of the following—detail the advantages and disadvantages of each:A. Mean Absolute Percentage Error.B. Mean Absolute Deviation.C. Mean Square Deviation.
When does a moving average fail to best perform its purpose as well as it should?
Why and when might first-differencing be necessary? What function does it perform?
Define and describe the autoregressive model. Give an example.
How many observations will you lose in the example you gave above?
An autoregressive model has 55 observations and four lagged variables. How many degrees of freedom will it have?
Define a distributed lagged model. Why is it called a distributed lagged model? Give an example.
Discuss and describe a Koyck transformation. Why is it also called a geometric lagged model? Give an example.
A variable is said to be stationary over time if it exhibits what characteristic? What restrictions does this impose on the variable's long-run mean and variance?
Define cointegration.
Discuss and describe the Almon polynomial lag. Discuss in detail how it differs from the Koyck lag.
Under what conditions can Granger causality be applied? What is its purpose? Create a complete example of your own devising, choosing carefully what variables you include in your model. Explain just how you would apply Granger causality to this model.
Explain how moving averages work. If the data are not stationed, what adjustments should be made?
How does single exponential smoothing work? What are its advantages compared with the moving average?
When should a double exponential smoothing technique be used?
Describe a correlogram. What is its purpose?
Briefly describe the four steps to the Box-Jenkins methodology.
An autoregressive model is reported to be as seen below with t-values in parentheses. How many lagged terms should be included in the model's final form? Y=47.3+0.47Y-4.2Y+1.72Y3 (2.5) (-3.7) (1.02)
A model is formed as Yt = f(Xt, Xt−1, Xt−2, Xt−3, Xt−4) such that Yt =73.2 + 1.4Xt + 0.471 Yt−1. Create the Koyck transformation.
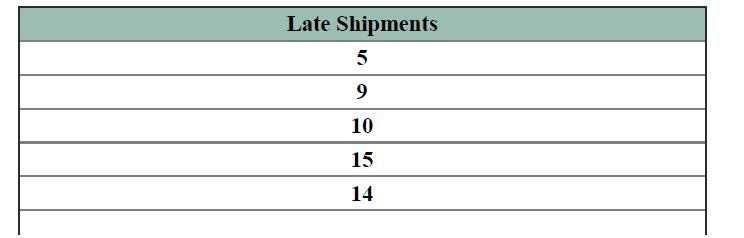
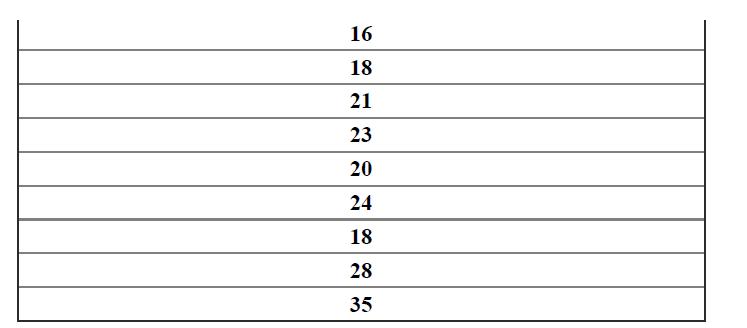
Riley Supplies, Ltd. ships computer software throughout the Midwest.The daily number of late shipments in the past two weeks are shown in the table to the right. Use a 3-period moving average to forecast the number of late shipments for the next day.
Given the data in problem 3, is a moving average a suitable method of forecasting? Compute the Mean Absolute Percentage Error, the Mean Absolute Deviation, and the Mean Square Deviation.Problem 3 Riley Supplies, Ltd. ships computer software throughout the Midwest.The daily number of late shipments
Use a smoothing factor of 0.7 on the data for problem 3 and provide the forecast.Problem 3 Riley Supplies, Ltd. ships computer software throughout the Midwest.The daily number of late shipments in the past two weeks are shown in the table to the right. Use a 3-period moving average to forecast the
Identify a common business problem from the popular business press or from your own personal experience. How do you think statistical analysis might help you approach that problem in your search for a solution? In what way would a more analytical solution prove more advantageous than merely
Given the problem you defined in the first question, how would you complete the five basic stages of a statistical process? How would you go about collecting the data? Would it be necessary to take a sample?Why? What organizational feature would you use to characterize the data set? How would you
How would you use the results of the first two questions above to make better business decisions?
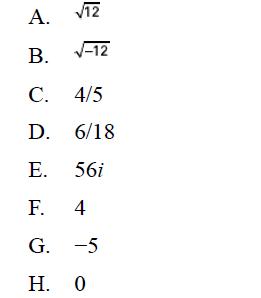
Identify each of the numbers below as to the type of number it is, based on the Arabic system in use in the Western world. A. 12 B. C. D. E. 56i F. 4 G. -5 H. 0 -12 4/5 6/18
Distinguish between a population and a sample; between a parameter and a statistic.
What is the difference between an estimator and an estimate?
Define a continuous variable and a discrete variable. How do they differ? Cite several examples of each.
What is sampling bias? Give an example. What generally causes it?What problem is it likely to cause?
What is sampling error and how does it arise in a statistical study?What causes sampling error?
Define and give examples of the four levels of data measurement. Why can you not mathematically manipulate the first two types?
Distinguish between descriptive statistics and inferential statistics as to their general purpose. Explain how each type might be performed.Give your own original examples.
What is the difference between cross-sectional data and time series data? Give your own original examples.
Showing 2000 - 2100
of 2175
First
8
9
10
11
12
13
14
15
16
17
18
19
20
21
22
Step by Step Answers