New Semester
Started
Get
50% OFF
Study Help!
--h --m --s
Claim Now
Question Answers
Textbooks
Find textbooks, questions and answers
Oops, something went wrong!
Change your search query and then try again
S
Books
FREE
Study Help
Expert Questions
Accounting
General Management
Mathematics
Finance
Organizational Behaviour
Law
Physics
Operating System
Management Leadership
Sociology
Programming
Marketing
Database
Computer Network
Economics
Textbooks Solutions
Accounting
Managerial Accounting
Management Leadership
Cost Accounting
Statistics
Business Law
Corporate Finance
Finance
Economics
Auditing
Tutors
Online Tutors
Find a Tutor
Hire a Tutor
Become a Tutor
AI Tutor
AI Study Planner
NEW
Sell Books
Search
Search
Sign In
Register
study help
business
statistics alive
Introduction To Probability And Statistics 15th Edition William Mendenhall Iii , Robert Beaver , Barbara Beaver - Solutions
For the situations described .decide whether the alternative hypothesis for the Wilcoxon signed-rank test is one- or two-tailed.Then give the null and alternative hypotheses for the test 2. You want to detect a difference in the locations of two population distributions-1 and 2.
1. What three statistical tests are available for testing for a difference in location for two populations when the data are paired? What assumptions are required for each of these tests?
An experiment was conducted to compare the densities of cakes prepared from two different cake mixes, A and B. Six cake pans received batter A, and six received batter B. Expecting a variation in oven temperature, the experimenter placed an A and a B cake side by side in the oven at six different
12. Lead Levels in Blood A study reported in the American Journal of Public Health (Science News) followed blood lead levels in handgun hobbyists using indoor firing ranges.6 Lead exposure measurements were made on 17 members of a law enforcement trainee class before, during, and after a 3-month
9. AIDS Research Scientists have shown that a newly developed vaccine can shield rhesus monkeys from infection by the SIV virus, a virus closely related to the HIV virus which affects humans. In their work, researchers gave each of n56 rhesus monkeys five inoculations with the SIV vaccine and one
8. Lighting in the Classroom The productivity of 35 students was measured both before and after the installation of new lighting in their classroom. The productivity of 21 of the 35 students was improved, whereas the others showed no perceptible gain from the new lighting. Use the normal
6. Taste Testing In a head-to-head taste test of storebrand foods versus national brands, Consumer Reports found that it was hard to tell the difference.4 If the national brand is indeed better than the store brand, it should be judged as better more than 50% of the time.a. State the null and
Apply the large-sample approximation to the Wilcoxon rank sum test using the information. Calculate the p-value for the test. What is your conclusion with a 5.05?6. You wish to detect a shift in distribution 1 to the right of distribution 2 based on independent random samples of size n 512 1 and n
Apply the large-sample approximation to the Wilcoxon rank sum test using the information. Calculate the p-value for the test. What is your conclusion with a 5.05?5. Independent random samples of size n 520 1 and n 525 2 are drawn from nonnormal populations 1 and 2.The value of T 5252 1 . You wish
In using the Wilcoxon rank sum test should you use T1 or T1* as the test statistic?What is the rejection region for the test if a 5.05? What is the rejection region for the test if a 5.01? 2. The alternative hypothesis is that distribution 1 lies either to the left or to the right of distribution 2
In using the Wilcoxon rank sum test should you use T1 or T1* as the test statistic?What is the rejection region for the test if a 5.05? What is the rejection region for the test if a 5.01? 1. You wish to detect a shift in distribution 1 to the right of distribution 2 based on samples of size n 56 1
7. Taste Testing, continued In Exercise 6, we tried to prove that the national brand tasted better than the store brand. Perhaps, however, the store brand has the better taste!a. State the null and alternative hypotheses necessary to test this theory.b. Suppose that, of the 25 food categories in
11. Machine Breakdowns The number of machine breakdowns per month was recorded for 9 months on two identical machines, A and B, used to make wire rope:a. Do the data provide sufficient evidence to indicate a difference in the monthly breakdown rates for the two machines? Test by using a value of a
14. The chi-square test when r5c52 (Section 14.5)is equivalent to the two-tailed z-test of Section 9.5 provided a is the same for the two tests. Show algebraically that the chi-square test statistic X2 is the square of the test statistic z for the equivalent test.
A simple test of a single multinomial experiment can be set up by considering whether the proportions of male and female statistics students are the same—that is, 5.5 1 p and 5.5 2 p .
Suppose you have recorded the gender (M or F) and the college status (Fr, So, Jr, Sr, G) for 100 statistics students. The MINITAB worksheet would contain two columns of 100 observations each. Each row would contain an individual’s gender in column 1 and college status in column 2.
Suppose that a consumer survey summarized the responses of n = 307 people in a contingency table. Use the information to find the appropriate degrees of freedom for the chisquare test of independence. 4. five rows and four columns
Suppose that a consumer survey summarized the responses of n = 307 people in a contingency table. Use the information to find the appropriate degrees of freedom for the chisquare test of independence. 3. three rows and three columns
Suppose that a consumer survey summarized the responses of n = 307 people in a contingency table. Use the information to find the appropriate degrees of freedom for the chisquare test of independence. 2. four rows and two columns
Suppose that a consumer survey summarized the responses of n = 307 people in a contingency table. Use the information to find the appropriate degrees of freedom for the chisquare test of independence.1. three rows and five columns
Refer to Example 14.3. Do the data present sufficient evidence to indicate that the type of furniture defect varies with the shift during which the piece of furniture is produced?
A total of n5309 furniture defects were recorded and the defects were classified into four types: A, B, C, or D. At the same time, each piece of furniture was identified by the production shift in which it was manufactured. These counts are presented in a contingency table in Table 14.3.
28. Admission Standards A large university reports that of the total number of persons who apply for admission, 60% are admitted unconditionally, 5% are admitted on a trial basis, and the remainder are refused admission. Of 500 applications to date for the coming year, 329 applicants have been
25. Snap Peas Suppose you are interested in following two independent traits in snap peas—seed texture(S5smooth, s5wrinkled) and seed color (Y5yellow, y5green)—in a second-generation cross of heterozygous parents. Mendelian theory states that the number of peas classified as smooth and yellow,
20. Peonies A peony plant with red petals was crossed with another plant having streaky petals. A geneticist states that 75% of the offspring from this cross will have red flowers. To test this claim, 100 seeds from this cross were collected and germinated, and 58 plants had red petals. Use the
1. List the characteristics of a multinomial experiment.
Suppose you want to relate a random variable y to two independent variables 1 x and 2 x . The multiple regression model is with the mean value of y given as This equation is a three-dimensional extension of the line of means from Chapter 12 and traces a plane in three-dimensional space (see
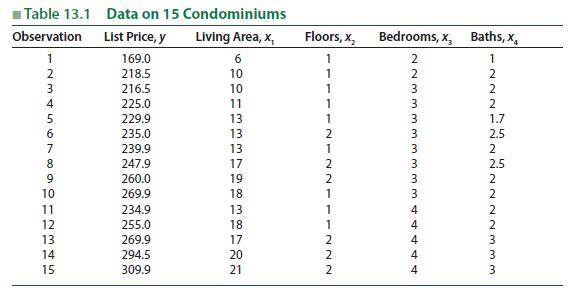
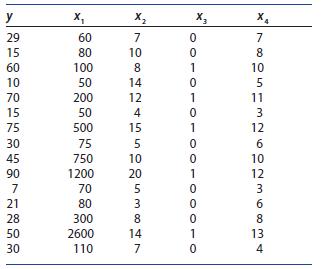
How do real estate agents decide on the asking price for a newly listed condominium?A computer database in a small community contains the listed selling price y (in thousands of dollars), the amount of living area 1 x (in hundreds of square feet), and the numbers of floors 2 x , bedrooms 3 x , and
Planes in Three-Dimensional Space Suppose that E(y)is related to two predictor variables, 1 x and 2 x , by the equations given. Graph E(y) versus 1 x for values of x 50 2 , 1, and 2 on the same sheet of paper. Now graph E(y) versus 2 x for values of x 50 1 , 1, and 2 on another sheet of paper. What
Planes in Three-Dimensional Space Suppose that E(y)is related to two predictor variables, 1 x and 2 x , by the equations given. Graph E(y) versus 1 x for values of x 50 2 , 1, and 2 on the same sheet of paper. Now graph E(y) versus 2 x for values of x 50 1 , 1, and 2 on another sheet of paper. What
Planes in Three-Dimensional Space Suppose that E(y)is related to two predictor variables, 1 x and 2 x , by the equations given. Graph E(y) versus 1 x for values of x 50 2 , 1, and 2 on the same sheet of paper. Now graph E(y) versus 2 x for values of x 50 1 , 1, and 2 on another sheet of paper. What
4. Refer to the models in Exercises 1–3. Suppose in a practical situation you want to model the relationship between E(y) and two predictor variables, 1 x and 2 x . What is the implication of using the model E(y) B+B+Bx?
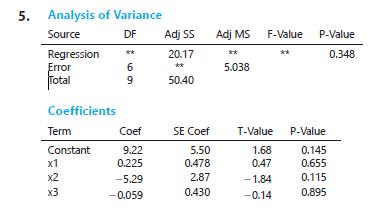
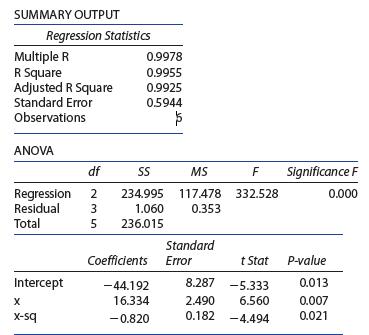
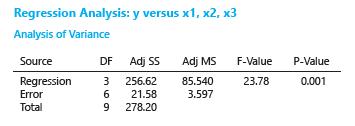
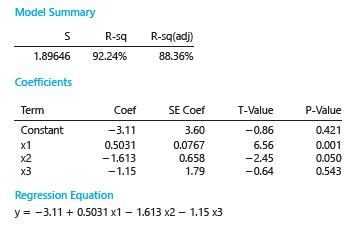
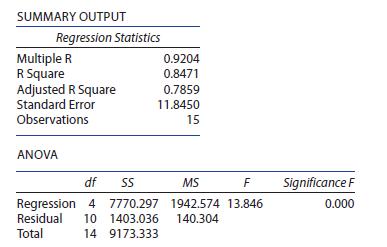
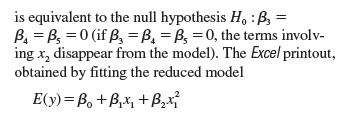
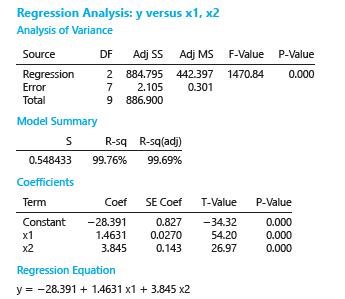
The MINITAB and MS Excel outputs were generated for a multiple linear regression analysis. What model has been fitted to the data, and what is the least-squares prediction equation?Fill in the blanks in the ANOVA table and use it to test for a significant regression using a =.05. 5. Analysis of
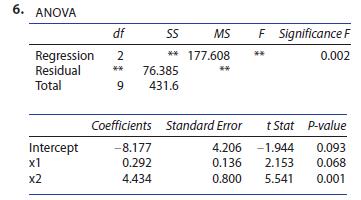
The MINITAB and MS Excel outputs were generated for a multiple linear regression analysis. What model has been fitted to the data, and what is the least-squares prediction equation?Fill in the blanks in the ANOVA table and use it to test for a significant regression using a =.05. 6. ANOVA df SS MS
Suppose that you fitted the modelto 15 data points and found F equal to 57.44. Use this information to answer 9. Do the data provide sufficient evidence to indicate that the model contributes information for the prediction of y? Test using a 5% level of significance E(y) B+Bx + Bx + Bxz
Suppose that you fitted the modelto 15 data points and found F equal to 57.44. Use this information to answer 10. Use the value of F to calculate R2. Interpret its value. E(y) B+Bx + Bx + Bxz
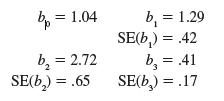
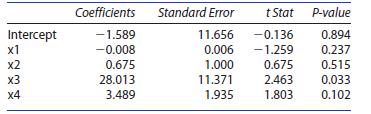
Use the computer output below for the model given in Example I to answer11. Which, if any, of the independent variables 1 x , 2 x , and 3 x contribute information for the prediction of y? b = 1.04 b = 1.29 SE(b) = .42 b = 2.72 b = .41 SE(b) = .65 SE(b) = .17
Use the computer output below for the model given in Example I to answer12. Give the least-squares prediction equation. b = 1.04 b = 1.29 SE(b) = .42 b = 2.72 b = .41 SE(b) = .65 SE(b) = .17
Use the computer output below for the model given in Example I to answer13. On the same sheet of graph paper, graph y versus 1 x when 51 2 x and 50 3 x and when 51 2 x and 5.5 3 x .What relationship do the two lines have to each other? b = 1.04 b = 1.29 SE(b) = .42 b = 2.72 b = .41 SE(b) = .65
Use the computer output below for the model given in Example I to answer14. What is the practical interpretation of the parameter b1? b = 1.04 b = 1.29 SE(b) = .42 b = 2.72 b = .41 SE(b) = .65 SE(b) = .17
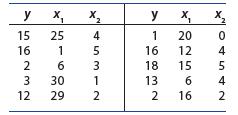
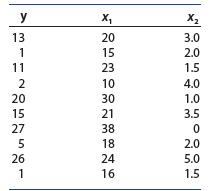
15. Corporate Profits To study the relationship of advertising and capital investment to corporate profits, the following data, recorded in units of$100,000, were collected for 10 medium-sized firms in the same year. The variable y represents profit for the year, 1 x represents capital investment,
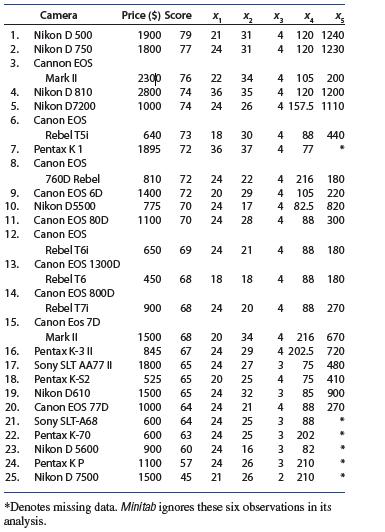
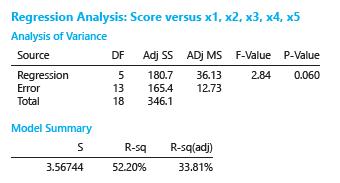
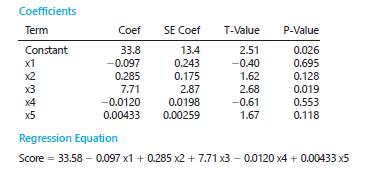
16. Choosing a Good Camera Cameras come with many options, and it appears that the more that you want, the higher the cost of the camera Consumer Reports1 has rated n525 cameras on qualities that we consumers are looking for.Variables that may relate to the cost of a camera are given in the
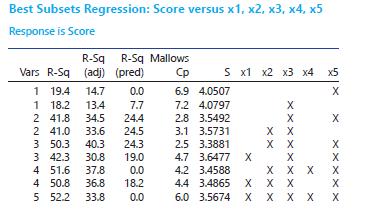
17. Choosing a Good Camera II Refer to Exercise 16.The Best Subsets command in MINITAB provides output in which R2 and R2(adj) are calculated for subsets of the five independent variables. The printout is provided here.a. If you had to compare these models and choose the best one, which model would
In a study of variables that affect productivity in the retail grocery trade, W. S. Good uses value added per work-hour to measure the productivity of retail grocery outlets.2 He defines “value added” as “the surplus [money generated by the business] available to pay for labor, furniture and
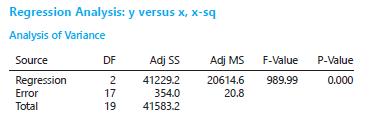
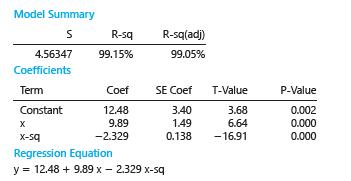
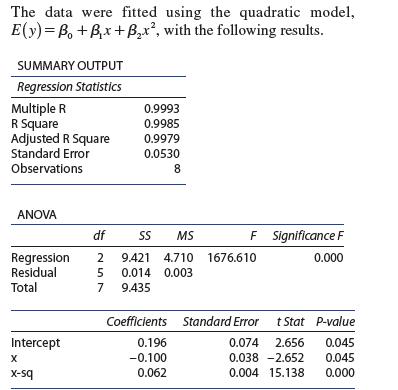
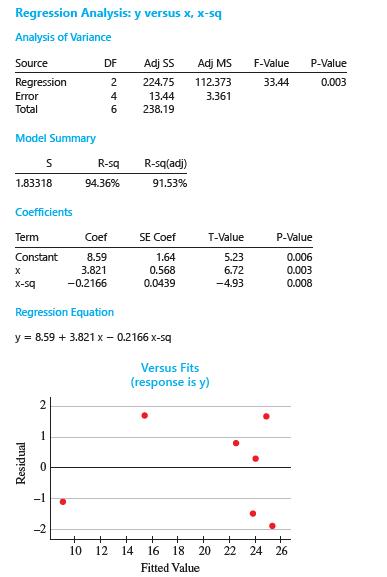
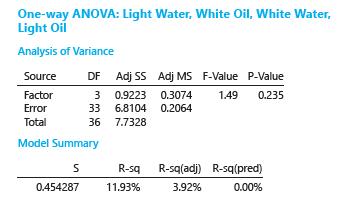
1. What type of model have you chosen to fit the data?A Quadratic Model Suppose that you fitted the model E(y) x x 0 1 2 2 5b 1b 1b to n520 data points and obtained the following MINITAB printout Regression Analysis: y versus x, x-sq Analysis of Variance Source DF Adj SS Adj MS F-Value P-Value
2. How well does the model fit the data? Explain.A Quadratic Model Suppose that you fitted the model E(y) x x 0 1 2 2 5b 1b 1b to n520 data points and obtained the following MINITAB printout Regression Analysis: y versus x, x-sq Analysis of Variance Source DF Adj SS Adj MS F-Value P-Value
3. Do the data provide sufficient evidence to indicate that the model contributes information for the prediction of y? Use the p-value approach.A Quadratic Model Suppose that you fitted the model E(y) x x 0 1 2 2 5b 1b 1b to n520 data points and obtained the following MINITAB printout Regression
4. What is the prediction equation?A Quadratic Model Suppose that you fitted the model E(y) x x 0 1 2 2 5b 1b 1b to n520 data points and obtained the following MINITAB printout Regression Analysis: y versus x, x-sq Analysis of Variance Source DF Adj SS Adj MS F-Value P-Value Regression 2 41229.2
5. Graph the prediction equation over the interval 0# x #10.A Quadratic Model Suppose that you fitted the model E(y) x x 0 1 2 2 5b 1b 1b to n520 data points and obtained the following MINITAB printout Regression Analysis: y versus x, x-sq Analysis of Variance Source DF Adj SS Adj MS F-Value
6. What is your estimate of the average value of y when x50?A Quadratic Model Suppose that you fitted the model E(y) x x 0 1 2 2 5b 1b 1b to n520 data points and obtained the following MINITAB printout Regression Analysis: y versus x, x-sq Analysis of Variance Source DF Adj SS Adj MS F-Value
7. Do the data provide sufficient evidence to indicate that the average value of y differs from 0 when x50?A Quadratic Model Suppose that you fitted the model E(y) x x 0 1 2 2 5b 1b 1b to n520 data points and obtained the following MINITAB printout Regression Analysis: y versus x, x-sq Analysis of
8. Suppose that the relationship between E(y) and x is a straight line. What would you know about the value of b2?A Quadratic Model Suppose that you fitted the model E(y) x x 0 1 2 2 5b 1b 1b to n520 data points and obtained the following MINITAB printout Regression Analysis: y versus x, x-sq
9. Do the data provide sufficient evidence to indicate curvature in the relationship between y and x?A Quadratic Model Suppose that you fitted the model E(y) x x 0 1 2 2 5b 1b 1b to n520 data points and obtained the following MINITAB printout Regression Analysis: y versus x, x-sq Analysis of
12. College Textbooks A publisher of college textbooks conducted a study relating profit per text y to cost of sales x over a 6-year period when its sales force (and sales costs) were growing rapidly. These inflation-adjusted data (in thousands of dollars) were collected:Expecting profit per book
14. Lexus, Inc. The Lexus GX is a midsize sport utility vehicle (SUV) sold in North American and Eurasian markets by Lexus. The sales of the Lexus GX 470 from 2003 to 2017 are given in the tablea. Plot the data. What model would you expect to provide the best fit to the data? Write the equation of
15. Metal Corrosion and Soil Acids In an investigation to determine the relationship between the degree of metal corrosion and the length of time the metal is exposed to the action of soil acids, the percentage of corrosion and exposure time were measured weekly.a. What percentage of the total
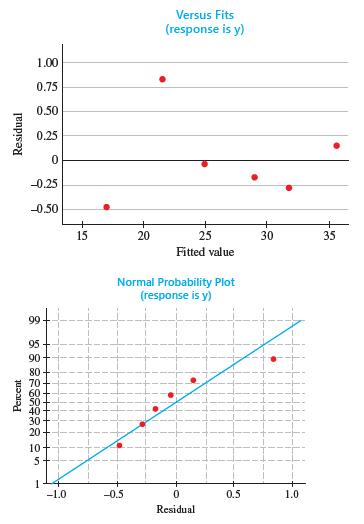
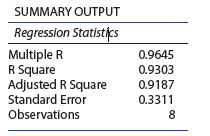
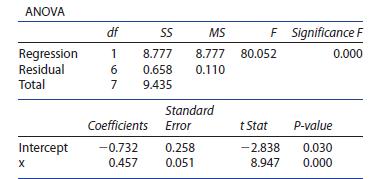
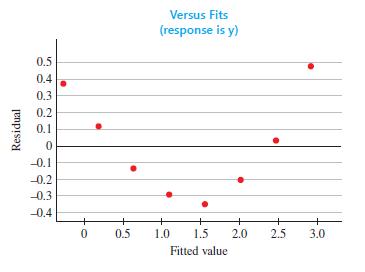
16. The data in Exercise 15 were fitted to a linear model without the quadratic term with the results that follow.a. What can you say about the contribution of the quadratic term when it is included in the model?b. The plot of the residuals from the linear regression model shows a specific pattern.
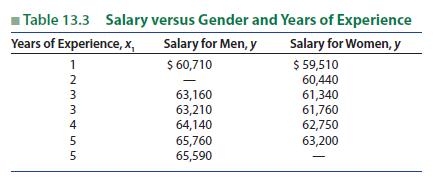
Random samples of six female and six male assistant professors were selected from among the assistant professors in a college of arts and sciences. The data on salary and years of experience are shown in Table 13.3. Note that each of the two samples (male and female)contained two professors with 3
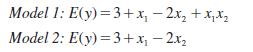
Suppose that E(y) is related to two predictor variables 1 x and 2 x using one of two modelsUse these two models to answer 6. Use model 1 and graph the relationship between E(y)and 1 x when 0 2 x 5 . Repeat for 2 2 x 5 and for 2 2 x 52 . Model 1: E(y)=3+x - 2x+xx Model 2: E(y)=3+x-2x2
Suppose that E(y) is related to two predictor variables 1 x and 2 x using one of two modelsUse these two models to answer 7. Repeat the instructions in Exercise 6 using model 2. Model 1: E(y)=3+x - 2x+xx Model 2: E(y)=3+x-2x2
Suppose that E(y) is related to two predictor variables 1 x and 2 x using one of two modelsUse these two models to answer 8. Note that the equations for the two models are almost the same except that we have added the term 1 2 x x . How does the addition of the 1 2 x x term affect the graphs of the
Suppose that E(y) is related to two predictor variables 1 x and 2 x using one of two modelsUse these two models to answer 9. What flexibility is added to the first-order model Model 1: E(y)=3+x - 2x+xx Model 2: E(y)=3+x-2x2
multiple linear regression model involving one qualitative and one quantitative independent variable produced this prediction equation:Use this information to answer 10. Which of the two variables is the quantitative variable?Explain. y=12.6+.54x, -1.2x,x+3.9x2
multiple linear regression model involving one qualitative and one quantitative independent variable produced this prediction equation:Use this information to answer 11. If 1 x can take only the values 0 or 1, find the two possible prediction equations for this experiment y=12.6+.54x, -1.2x,x+3.9x2
multiple linear regression model involving one qualitative and one quantitative independent variable produced this prediction equation:Use this information to answer 12. Graph the two equations found in Exercise 11.Compare the shapes of the two curves y=12.6+.54x, -1.2x,x+3.9x2
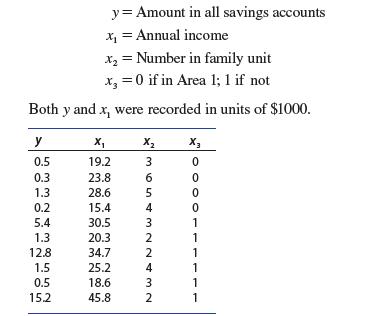
14. Managing Your Money A savings and loan corporation wants to find out if the amount of money in family savings accounts can be predicted using three independent variables—annual income, number in the family unit, and area in which the family lives.There are two specific areas of interest to
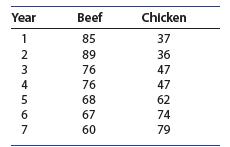
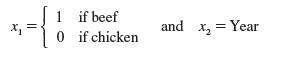
15. Less Red Meat! If you want to “eat right,”you could reduce your intake of red meat and substitute poultry or fish. Researchers tracked beef and chicken consumption, y (in annual pounds per person), and found the consumption of beef declining and the consumption of chicken increasing over a
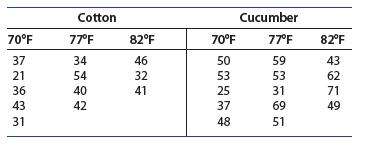
16. Cotton versus Cucumber In Chapter 11, you used the analysis of variance procedure to analyze a 233 factorial experiment in which each factor–level combination was replicated five times. The experiment involved the number of eggs laid by caged female whiteflies on two different plants at three
17. Achievement Scores III The Academic Performance Index (API) has been used to measure school achievement. Scores for 12 elementary schools are shown below, along with several other independent variablesThe variables are defined asThe MINITAB printout for a first-order regression model is given
18. Construction Projects An analyst wanted to predict the time required to complete a construction project (y) using four variables—size of the contract 1 x (in $1000 units), number of workdays adversely affected by the weather 2 x , number of subcontractors involved in the project 4 x , and a
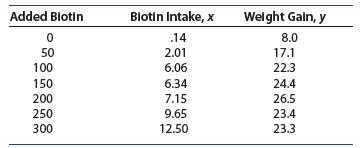
1. Biotin Intake in Chicks Groups of 10-dayold chicks were randomly assigned to seven treatment groups in which a basal diet was supplemented with 0, 50, 100, 150, 200, 250, or 300 micrograms/kilogram (mg/kg) of biotin. The table gives the average biotin intake (x) in micrograms per day and the
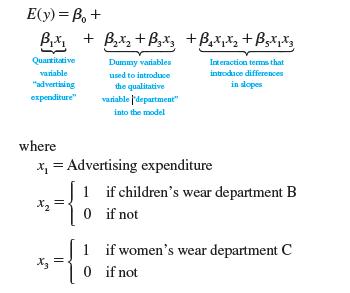
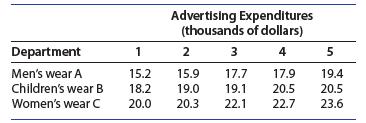
2. Advertising and Sales A department store investigated the effects of advertising expenditures on the weekly sales for its men’s wear, children’s wear, and women’s wear departments. Five weeks were randomly selected for each department, and an advertising budget 1 x (in thousands of
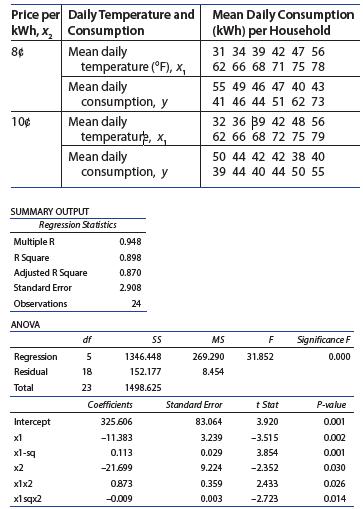
4. Demand for Utilities The effect of mean monthly daily temperature 1 x and cost per kilowatthour 2 x on the mean daily household consumption of electricity (in kilowatt-hours, kWh) was the subject of a short-term study. The investigators expected the demand for electricity to rise in cold weather
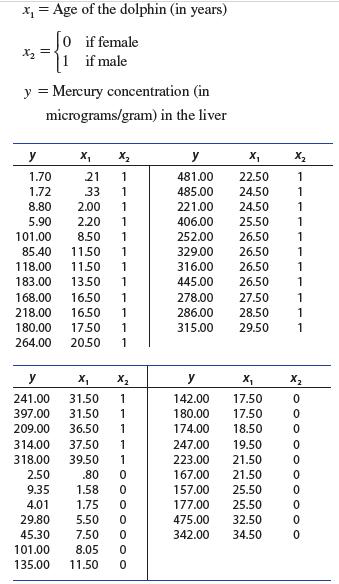
5. Mercury Concentration in Dolphins The mercury concentrations in striped dolphins were measured as part of a marine pollution study. This concentration is expected to differ in males and females because the mercury in a female is apparently transferred to her offspring during gestation and
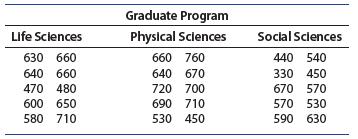
6. GRE Scores The quantitative reasoning scores on the Graduate Record Examination (GRE)7 were recorded for students admitted to three different graduate programs at a local university. These data were analyzed in Chapter 11 using the analysis of variance for a completely randomized design.a. Write
7. On the Road Again Performance tires used to be fitted mostly on sporty or luxury vehicles.Now they come standard on many standard vehicles.The data that follow are abstracted from a report on all-season tires by Consumer Reports8 in which several aspects of performance were evaluated for n516
8. Tuna Fish The tuna fish data from Exercise 14(Section 11.2) were analyzed as a completely randomized design with four treatments. However we could also view the experimental design as a 232 factorial experiment with unequal replications. The data are shown belowThe data can be analyzed using the
9. Tuna, continued Refer to Exercise 8. The hypothesis tested in Chapter 11—that the average prices for the four types of tuna are the same—is equivalent to saying that E(y) will not change as 1 x and 2 x change. This can only happen when 0 1 2 3 b 5b 5b 5 . Use the MINITAB printout for the
10. Quality Control A manufacturer recorded the number of defective items (y) produced on a given day by each of 10 machine operators and also recorded the average output per hour ( ) 1 x for each operator and the time in weeks from the last machine service (X2 ) .The printout that follows resulted
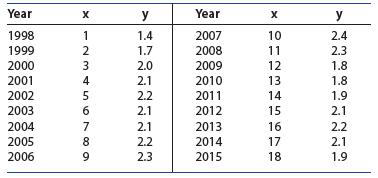
1. Plot the data and sketch what you consider to be the best-fitting linear, quadratic, cubic, or quartic models. (hint: a quadratic curve changes curvature once while a cubic curve changes curvature twice and so on.)In Chapter 12 we examined the effect of foreign competition in the automotive
2. Fit what you think is an appropriate model. Produce a plot of the residuals from your model versus x. If there is a pattern to the residuals, what term or terms would you consider including in your model?In Chapter 12 we examined the effect of foreign competition in the automotive industry as
3. Run a best-subsets regression with x, x2, x3, and x4 as possible predictors. What is the best-fitting model based on values of R2 (adj).In Chapter 12 we examined the effect of foreign competition in the automotive industry as the number of imported cars steadily increased during the 1970s and
4. Fit a cubic model if you have not yet done so. Is the fit significantly better than your model in part 2? Are there any patterns in the residuals plotted against x? Does it appear that there are missing terms in the model? Summarize your findings.In Chapter 12 we examined the effect of foreign
3. Advertising and Sales, continued Refer to Exercise 2. Use a computer software package to perform the multiple regression analysis and obtain diagnostic plots if possible.a. Comment on the fit of the model, using the analysis of variance F-test, R2, and the diagnostic plots to check the
Suppose that a response variable y is related to four predictor variables, 1 x , 2 x , 3 x , and 4 x , so that k54.1. Enter the observed values of y and each of the k54 predictor variables into the first(k11) columns of a MINITAB worksheet. Once this is done, the main inferential tools for multiple
Suppose that a response variable y is related to four predictor variables, 1 x , 2 x , 3 x , and 4 x , so that k54.1. Enter the observed values of y and each of the k54 predictor variables into the first(k11) columns of an Excel spreadsheet. (note: In order for the multiple regression analysis to
Refer to the real estate data of Example 13.2 that relate the listed selling price y to the square feet of living area 1 x , the number of floors 2 x , the number of bedrooms 3 x , and the number of bathrooms 4 x . The realtor suspects that the square footage of living area is the most important
13. Particle Board A quality control engineer wants to predict the strength of particle board y as a function of the size of the particles 1 x and two types of bonding compounds. If the basic response is expected to be a quadratic function of particle size, write a linear model that adds the
Suppose you wish to predict production yield y as a function of several independent predictor variables. For the situations given indicate whether each of the following independent variables is qualitative or quantitative. If qualitative, define the appropriate dummy variable(s).5. The shift (night
Suppose you wish to predict production yield y as a function of several independent predictor variables. For the situations given indicate whether each of the following independent variables is qualitative or quantitative. If qualitative, define the appropriate dummy variable(s).4. The length of
Suppose you wish to predict production yield y as a function of several independent predictor variables. For the situations given indicate whether each of the following independent variables is qualitative or quantitative. If qualitative, define the appropriate dummy variable(s).3. The plant (A, B,
Suppose you wish to predict production yield y as a function of several independent predictor variables. For the situations given indicate whether each of the following independent variables is qualitative or quantitative. If qualitative, define the appropriate dummy variable(s).2. The price per
Suppose you wish to predict production yield y as a function of several independent predictor variables. For the situations given indicate whether each of the following independent variables is qualitative or quantitative. If qualitative, define the appropriate dummy variable(s).1. The prevailing
Refer to Example 13.6. Do the data provide sufficient evidence to indicate that the annual rate of increase in male assistant professor salaries exceeds the annual rate of increase in female assistant professor salaries? That is, do the data provide sufficient evidence to indicate that the slope of
A study examined the relationship between university salary y, the number of years of experience of the faculty member, and the gender of the faculty member. If you expect a straight-line relationship between mean salary and years of experience for both men and women, write the model that relates
13. College Textbooks II Refer to Exercise 12.a. Use the values of SSR and Total SS to calculate R2.Compare this value with the value given in the printout.b. Calculate R2 (adj). When would it be appropriate to use this value rather than R2 to assess the fit of the model?c. The value of R2 (adj)
Refer to the quadratic model used for Exercises 1–9. Suppose that y is the profit for some business and x is the amount of capital invested, and you know that the rate of increase in profit for a unit increase in capital invested can only decrease as x increases. You want to know whether the data
Refer to the quadratic model used for Exercises 1–9. Suppose that y is the profit for some business and x is the amount of capital invested, and you know that the rate of increase in profit for a unit increase in capital invested can only decrease as x increases. You want to know whether the data
Refer to the data on grocery retail outlet productivity and outlet size in Example 13.3. MINITAB was used to fit a quadratic model to the data and to graph the quadratic prediction curve, along with the plotted data points. Discuss the adequacy of the fitted model
Refer to the MINITAB and MS Excel outputs in Exercises 5–6. Which if any of the partial regression coefficients are significant in the presence of other predictors already in the model?What percentage of the total variation in the experiment is explained by using the multiple linear regression
Showing 2100 - 2200
of 6613
First
15
16
17
18
19
20
21
22
23
24
25
26
27
28
29
Last
Step by Step Answers