New Semester
Started
Get
50% OFF
Study Help!
--h --m --s
Claim Now
Question Answers
Textbooks
Find textbooks, questions and answers
Oops, something went wrong!
Change your search query and then try again
S
Books
FREE
Study Help
Expert Questions
Accounting
General Management
Mathematics
Finance
Organizational Behaviour
Law
Physics
Operating System
Management Leadership
Sociology
Programming
Marketing
Database
Computer Network
Economics
Textbooks Solutions
Accounting
Managerial Accounting
Management Leadership
Cost Accounting
Statistics
Business Law
Corporate Finance
Finance
Economics
Auditing
Tutors
Online Tutors
Find a Tutor
Hire a Tutor
Become a Tutor
AI Tutor
AI Study Planner
NEW
Sell Books
Search
Search
Sign In
Register
study help
business
statistics alive
Introduction To Probability And Statistics 15th Edition William Mendenhall Iii , Robert Beaver , Barbara Beaver - Solutions
Find the tabled value of t ( ta ) corresponding to a right-tail area a and degrees of freedom given 6. a=.10, df = 7
Find the tabled value of t ( ta ) corresponding to a left-tail area a and degrees of freedom given 7. a=.01, df = 9
Find the tabled value of t ( ta ) corresponding to a left-tail area a and degrees of freedom given 8. a = .05, df = 8
Find the tabled value of t ( ta ) corresponding to a left-tail area a and degrees of freedom given 9. a=.025, df =15
Find the critical value(s) of t that specify the rejection region for the situations given 5. A left-tailed test with a = .01 and 7 df
Find the critical value(s) of t that specify the rejection region for the situations given 6. An upper one-tailed test with a = .05 and 11 df
19. The following n510 observations are a sample from a normal population:a. Find the mean and standard deviation of these data.b. Find a 99% upper one-sided confidence bound for the population mean m.c. Test H :m 57.5 0 versus H :m,7.5 a . Use a 5.01.d. Do the results of part b support your
20. Cerebral Blood Flow Cerebral blood flow (CBF) in the brains of healthy people is normally distributed with a mean of 74. A random sample of 25 stroke patients resulted in an average CBF of x 569.7 with a standard deviation of s516. Test the hypothesis that the average CBF for stroke patients is
21. Red Pine The main stem growth measured for a sample of seventeen 4-year-old red pine trees produced a mean and standard deviation equal to 28.7 and 8.6 centimeters, respectively. Find a 90% confidence interval for the mean growth of a population of 4-yearold red pine trees subjected to similar
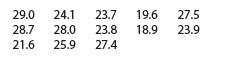
22. Cheese, Please Here are the prices per serving of n513 different brands of individually wrapped cheese slices:Construct a 95% confidence interval estimate of the underlying average price per serving of individually wrapped cheese slices. 29.0 24.1 23.7 28.7 28.0 23.8 21.6 25.9 27.4 19.6 27.5
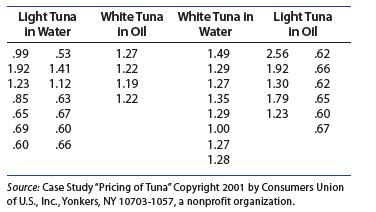
23. Tuna Fish Is there a difference in the prices of tuna, depending on the method of packaging?Consumer Reports gives the estimated average price for a variety of different brands of tuna, based on prices paid nationally in supermarketsAssume that the tuna brands included in this survey represent
24. Dissolved O2 Content A state agency requires a minimum of 5 parts per million (ppm) of dissolved oxygen in order for the oxygen content to be sufficient to support aquatic life. Six water specimens taken from a river at a specific location during the low-water season(July) gave readings of 4.9,
25. Lobsters In a study of the infestation of a particular species of lobster by two types of barnacles, the body lengths (in millimeters) of 10 randomly selected lobsters are measured:Find a 95% confidence interval for the mean body length of this species of lobster. 78 66 65 63 60 60 58 58 56 56
26. Smoking and Lung Capacity In a study of the effect of cigarette smoking on the carbon monoxide diffusing capacity (DL) of the lung, researchers found that current smokers had DL readings significantly lower than those of either exsmokers or nonsmokers.The carbon monoxide diffusing capacities
27. Ben Roethlisberger The number of passes completed by Ben Roethlisberger, quarterback for the Pittsburgh Steelers, was recorded for each of the 15 regular season games in which he played during the fall of 2017 (www.ESPN.com):a. A stem and leaf plot of the n515 observations is shown here:Based
28. Purifying Organic Compound A chemist prepared ten 4.85 g quantities of aniline and purified it to acetanilide using fractional crystallization. The following dry yields were recorded:Estimate the mean grams of acetanilide that can be recovered from an initial amount of 4.85 g of aniline.Use a
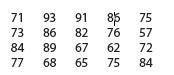
18. Test Scores The test scores on a 100-point test were recorded for 20 students:a. Can you reasonably assume that these test scores have been selected from a normal population? Use a stem and leaf plot to justify your answer.b. Calculate the mean and standard deviation of the scores.c. If these
17. A random sample of n512 observations from a normal population produced x 547.1 and s2 54.7. Test the hypothesis H : m 548 0 against H :m±48 a at the 5% level of significance.
Find the critical value(s) of t that specify the rejection region for the situations given 7. A two-tailed test with a = .05 and 7 df
Find the critical value(s) of t that specify the rejection region for the situations given 8. A lower one-tailed test with a =.01 and 15 df
Use Table 4 in Appendix I to approximate the p-value for the t statistic in the situations given 9. A two-tailed test with t = 2.43 and 12 df
Use Table 4 in Appendix I to approximate the p-value for the t statistic in the situations given 10. A right-tailed test with t = 3.21 and 16 df
Use Table 4 in Appendix I to approximate the p-value for the t statistic in the situations given 11. A two-tailed test with t = -1.19 and 25 df
Use Table 4 in Appendix I to approximate the p-value for the t statistic in the situations given 12. A left-tailed test with t = -8.77 and 7 df
Use Table 4 in Appendix I to bound the p-values given 13. P(t>1.2) with 5 df
Use Table 4 in Appendix I to bound the p-values given 14. P(t>2)+P(t
Use Table 4 in Appendix I to bound the p-values given 15. P(t
Use Table 4 in Appendix I to bound the p-values given 16. P(t>0.6) with 12 df
29. Organic Compounds, continued Refer to Exercise 28. Approximately how many 4.85 g specimens of aniline are required if you wish to estimate the mean number of grams of acetanilide correct to within.06 g with probability equal to .95?
Use the data given to test the given alternative hypothesis.Find the p-value for the test. Construct a 95% confidence interval for σ12 / σ22 13. Sample Size Sample Variance 13 13 18.3 7.9 H > a 2
(Paired t-Test) Refer to the tire wear data from Table 10.3.1. To perform a paired-difference test for these dependent samples, enter the data into the first two columns of an Excel spreadsheet and select Data ➤ Data Analysis ➤ t-Test:Paired Two Sample for Means.2. Follow the directions for the
(One-Sample t-Test) Refer to Example 10.3, in which the average weight of diamonds using a new process was compared to an average weight of .5 karat.1. Enter the six recorded weights—.46, .61, .52, .48, .57, .54—in column C1 and name them“Weights.” Use Stat ➤ Basic Statistics ➤ 1-Sample
(Two-Sample t-Test Assuming Equal Variances) The test scores on the same algebra test were recorded for eight students randomly selected from students taught by teacher A and nine students randomly selected from students taught by Teacher B. Is there a difference in the average scores for students
(Two-Sample t-Test Assuming Unequal Variances)1. Refer to Example 10.21. If the ratio of the two sample variances had been so large that you could not assume equal variances (we use “greater than 3” as a rule of thumb), you should select Stat ➤ Basic Statistics ➤ 2-Sample t, but Do NOT
(One-Sample t-Test) Refer to Example 10.3, in which the average weight of diamonds using a new process was compared to an average weight of .5 karat.1. Select stat ➤ EDIT and enter the six recoded weights—.46, .61, .52, .48, .57, .54—in list L1. Use stat ➤ TESTS ➤ 2:TTest, select Data in
(Two-Sample t-Test Assuming Equal Variances) The test scores on the same algebra test were recorded for eight students randomly selected from students taught by Teacher A and nine students randomly selected from students taught by Teacher B. Is there a difference in the average scores for students
(Two-Sample t-Test Assuming Unequal Variances)1. Refer to Example 10.25. If the ratio of the two sample variances had been so large that you could not assume equal variances (we use “greater than 3” as a rule of thumb), you should use stat ➤ TESTS ➤ 4:2-SampTTest but select “No” on the
1. Impurities A manufacturer can tolerate a small amount (.05 milligrams per liter (mg/L)) of impurities in a raw material needed for manufacturing its product.To test for impurities in a particular batch of raw material, the manufacturer tests the batch 10 times, records the 10 readings, and finds
2. Sodium Hydroxide The object of a general chemistry experiment is to determine the amount (in milliliters) of sodium hydroxide (NaOH) solution needed to neutralize 1 gram of a specified acid. This will be an exact amount, but when the experiment is run in the laboratory, variation will occur as
3. Sea Urchins An experimenter was interested in determining the mean thickness of the cortex of the sea urchin egg. The thickness was measured for n510 sea urchin eggs. The following measurements were obtained:Estimate the mean thickness of the cortex using a 95%confidence interval. 4.5 6.1 3.2
(Two-Sample t-Test Assuming Unequal Variances)1. Refer to Example 10.17. If the ratio of the two sample variances had been so large that you could not assume equal variances (we use “greater than 3” as a rule of thumb), you should select Data ➤ Data Analysis ➤ t-Test: Two-Sample Assuming
(Two-Sample t-Test Assuming Equal Variances) The test scores on the same algebra test were recorded for eight students randomly selected from students taught by teacher A and nine students randomly selected from students taught by Teacher B. Is there a difference in the average scores for students
14. Fabricating Systems A production plant has two fabricating systems, both of which are maintained at 2-week intervals. However, one system is twice as old as the other. The number of finished products fabricated daily by each of the systems is recorded for 30 working days, with the results given
15. Orange Juice A comparison of the precisions of two machines developed for extracting juice from oranges is to be made using the following data:a. Is there sufficient evidence to indicate that there is a difference in the precision of the two machines at the 5% level of significance?b. Find a
16. SAT Scores The SAT subject tests in chemistry and physics for two groups of 15 students each electing to take these tests are given here.To use the two-sample t-test with a pooled estimate of 2 , you must assume that the two population variances are equal. Test this assumption using the
17. Lithium Batteries The stability of measurements on a manufactured product is important in maintaining product quality. A manufacturer of lithium batteries suspected that one of the production lines was producing batteries with a wide variation in length of life. To test this theory, he randomly
18. Brees and Wilson Quarterbacks not only need to have a good passing percentage, but they need to be consistent. That is, the variability in the number of passes completed per game should be small. The following table gives the number of completed passes completed for Drew Brees and Russell
19. Tuna III In Exercise 15 (Section 10.3), you conducted a test to detect a difference in the average prices of light tuna in water versus light tuna in oil.Summarized data on the average price of two different types of tuna are shown here.a. What assumption had to be made concerning the
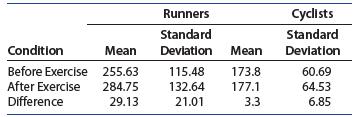
20. Runners and Cyclists III An experiment was conducted involving 10 healthy runners and 10 healthy cyclists to determine if there are significant differences in pressure measurements within the anterior muscle compartment.8 The data—compartment pressure, in millimeters of mercury (Hg)—are
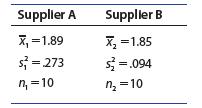
21. Impurities A pharmaceutical manufacturer is concerned about the variability of the impurities from shipment to shipment from two different suppliers.To compare the variation in percentage impurities, the manufacturer selects 10 shipments from each of the two suppliers and measures the
22. Stock Risks The closing prices of two common stocks were recorded for a period of 15 days. The means and variances area. Do these data present sufficient evidence to indicate a difference between the variabilities of the closing prices of the two stocks for the populations associated with the
23. Bees Insects hovering in flight expend enormous amounts of energy for their size and weight. The data shown here were taken from a much larger body of data collected by T.M. Casey and colleagues.15 They show the wing stroke frequencies (in hertz) for two different species of bees.a. Based on
4. Fossils The data in the table are the diameters and heights of 10 fossil specimens of a species of small shellfish that were unearthed in a mapping expedition near the Antarctic Peninsula.16 The table gives an identification symbol for the fossil specimen, the fossil’s diameter and height in
5. Fossils, continued Refer to Exercise 4. Suppose you want to estimate the mean diameter of the fossil specimens correct to within 5 millimeters with probability equal to .95. How many fossils do you have to include in your sample?
18. Connector Rods A producer of machine parts claimed that the diameters of the connector rods produced by his plant had a variance of at most 18.75 millimeters2.A random sample of 15 connector rods from his plant produced a sample mean and variance of 13.75 millimeters and 33.125 millimeters2,
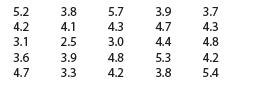
19. Arranging Objects The following data are the response times in seconds for n=25 first graders to arrange three objects by size.Find a 95% confidence interval for the average response time for first graders to arrange three objects by size.Interpret this interval. 5.2 3.8 5.7 3.9 3.7 4.2 4.1 4.3
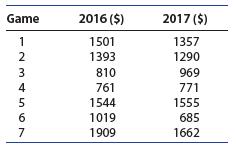
20. The NBA Finals Want to attend a pro-basketball game? The average resale prices for the NBA rematch of the Cleveland Cavaliers and the Golden State Warriors in 2017 compared to the average ticket prices in 2016 are given in the table that followsa. If we were to assume that the prices given in
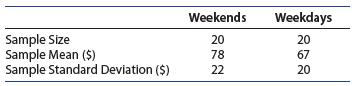
21. Mall Rats An article in American Demographics investigated consumer habits at the mall. We tend to spend the most money shopping on the weekends, and, in particular, on Sundays from 4 to 6 p.m. Wednesday morning shoppers spend the least!20 Suppose that a random sample of 20 weekend shoppers and
22. Got Milk? A dairy in the market for a new container-filling machine is considering two models, manufactured by companies A and B. Other factors being the same for the two models, the deciding factor is the variability of fills. The model that produces fills with the smaller variance is
23. Got Milk II Refer to Exercise 22. Wishing to demonstrate that the variability of fills is less for her model than for her competitor’s, a sales representative for company A acquired a sample of 30 fills from her company’s model and 10 fills from her competitor’s model. The sample
24. Runners and Cyclists II In the study reported earlier involving runners and cyclists, the level of creatine phosphokinase (CPK) in blood samples, a measure of muscle damage, was determined for each of 10 runners and 10 cyclists before and after exercise.8 The data summary—CPK values in
25. Auto Design An experiment is conducted to compare two new automobile designs. Twenty people are randomly selected, and each person is asked to rate each design on a scale of 1 (poor) to 10 (excellent). The resulting ratings will be used to test the null hypothesis that the mean level of
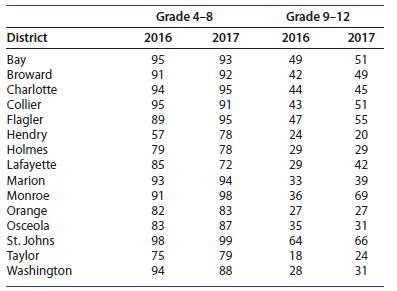
1. Suppose that you wish to test for significant improvement in scores from 2016 to 2017 for each of the groups Grade 4–8 and Grade 9–12. Conduct the appropriate tests using a =.05.The school accountability movement has relied in large part on standardized test scores to evaluate students,
2. Find 95% lower bounds for the mean increases in scores from 2016 to 2017.The school accountability movement has relied in large part on standardized test scores to evaluate students, schools, teachers, principals, and districts. It started under the No Child Left Behind Act, which went into
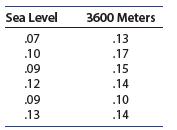
17. Alcohol and Altitude The effect of alcohol consumption on the body appears to be much greater at high altitudes than at sea level. To test this theory, one group of 6 randomly selected individuals is put into a chamber that simulates conditions at an altitude of 3600 meters, and each subject
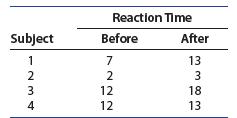
16. Reaction Times III A psychologist wishes to verify that a certain drug increases the reaction time to a given stimulus. The following reaction times (in tenths of a second) were recorded before and after injection of the drug for each of the four subjects:Test at the 5% level of significance to
6. Ring-Necked Pheasants The weights in grams of 10 males and 10 female juvenile ring-necked pheasants are given here.a. Use a statistical test to determine if the population variance of the weights of the male birds differs from that of the females.b. Based on the results of part a test whether
7. Calcium The calcium (Ca) content of a powdered mineral substance was analyzed 10 times with the following percent compositions recorded:a. Find a 99% confidence interval for the true calcium content of this substance.b. What does the phrase “99% confident” mean?c. What assumptions must you
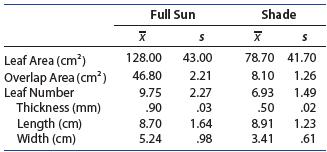
8. Sun or Shade? Researchers examined the differences in a particular plant when grown in full sunlight versus shade conditions.17 In this study, shaded plants received direct sunlight for less than 2 hours each day, whereas full-sun plants were never shaded. A partial summary of the data based on
9. Price Wars Many seniors are ordering their drugs online to take advantage of lower costs for these pharmacies. A random sample of nine online pharmacies was selected and the cost of a 10-mg Buspirone tablet recorded, as given in the following tablea. Test the hypothesis of no difference in costs
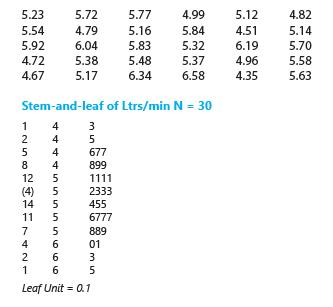
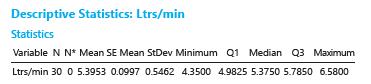
10. Breathing Patterns Research psychologists measured the baseline breathing patterns—the total ventilation (in liters of air per minute)adjusted for body size—for each of n530 patients, so that they could estimate the average total ventilation for patients before any experimentation was done.
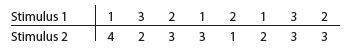
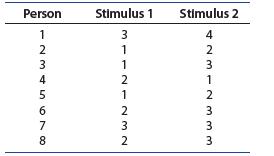
11. Reaction Times A comparison of reaction times (in seconds) for two different stimuli in an experiment produced the following results when applied to a random sample of 16 people:Do the data present sufficient evidence to indicate a difference in mean reaction times for the two stimuli? Test
12. Reaction Times II Refer to Exercise 11.Suppose that the experiment is conducted using eight people as blocks and making a comparison of reaction times within each person; that is, each person is subjected to both stimuli in a random order. The reaction times (in seconds) for the experiment are
13. Refer to Exercises 11 and 12. Calculate a 95% confidence interval for the difference in the two population means for each of these experimental designs. Does it appear that blocking increased the amount of information available in the experiment?
14. Chemical Purity A chemical manufacturer claims that the purity of his product never varies by more than 2%. Five batches were tested and given purity readings of 98.2, 97.1, 98.9, 97.7, and 97.9%.a. Do the data provide sufficient evidence to contradict the manufacturer’s claim? (hint: To be
15. 16-Ounce Cans? A cannery prints “weight 16 ounces” on its label. The quality control supervisor selects nine cans at random and weighs them. She finds x515.7 and s5.5. Do the data present sufficient evidence to indicate that the mean weight is less than that claimed on the label?
3. Summarize your results on the progress of students from 2016 to 2017 in the form of a report.The school accountability movement has relied in large part on standardized test scores to evaluate students, schools, teachers, principals, and districts. It started under the No Child Left Behind Act,
Use the data given to test the given alternative hypothesis.Find the p-value for the test. Construct a 95% confidence interval for σ12 / σ22 12. Sample Size Sample Variance 180 20 55.7 31.4 H 00 2
13. Auto Insurance The cost of auto insurance in California is dependent on many variables, such as the city you live in, the number of cars you insure, and your insurance company. The website www.insurance.ca.gov reports the annual 2017 standard premium for a male, licensed for 6–8 years, who
A cement manufacturer claims that concrete prepared from his product has a relatively stable compressive strength and that the strength measured in kilograms per square centimeter(kg/cm2 ) lies within a range of 40 kg/cm2. A sample of n510 measurements produced a mean and variance equal to,
An experimenter is convinced that her measuring instrument had a variability measured by standard deviation 52. During an experiment, she recorded the measurements 4.1, 5.2, and 10.2. Do these data confirm or disprove her assertion? Test the appropriate hypothesis, and construct a 90%
Find the tabled value for a x2 variable based on n-1 degrees of freedom with an area of a to its right. 1. n 10, a .05
Find the tabled value for a x2 variable based on n-1 degrees of freedom with an area of a to its right. 2. n 25, a .95
Find the tabled value for a x2 variable based on n-1 degrees of freedom with an area of a to its right. 3. n 41, a .025
Find the tabled value for a x2 variable based on n-1 degrees of freedom with an area of a to its right. 4. n 8, a .99
Find the tabled value for a x2 variable based on n-1 degrees of freedom with an area of a to its right. 5. n 18, a .90
Find the tabled value for a x2 variable based on n-1 degrees of freedom with an area of a to its right. 6. n 30, a .005
Use the information to test Ho: σ2 = σo2 versus the given alternate hypothesis. Construct a (1-a)100% confidence interval for σ2 using the x2 statistic. 7. n=25, x=126.3, s = 21.4, H: 2>15, a=.05.
Use the information to test Ho: σ2 = σo2 versus the given alternate hypothesis. Construct a (1-a)100% confidence interval for σ2 using the x2 statistic. 8. n=15, x=3.91, s=.3214, H: o.5, a = .10.
Check your ability to use Table 5 in Appendix I by verifying the following statements:1. The probability that 2 x , based on n516 measurements (df 515), exceeds 24.9958 is .05.2. For a sample of n56 measurements, 95% of the area under the 2 x distribution lies to the right of 1.145476.These values
24. Two Different Entrees To compare the demand for two different entrees, A and B, a cafeteria manager recorded the number of purchases of each entree on seven consecutive days. Do the data provide sufficient evidence to indicate a greater mean demand for one of the entrees? Use the Excel
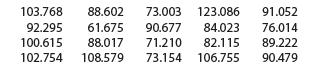
14. America’s Market Basket A survey was conducted by an independent price-checking company to check an advertiser’s claim that it had lower prices than its competitors. The average weekly total, based on the prices of approximately 95 items, is given for this chain and for its competitor
15. No Left Turn An experiment was conducted to compare the mean reaction times to two types of traffic signs: prohibitive (No Left Turn) and permissive(Left Turn Only). Each of 10 drivers was presented with 40 traffic signs, 20 prohibitive and 20 permissive, in random order. The mean time to
16. Healthy Teeth II In an experiment to study an oral rinse designed to prevent plaque buildup, subjects were divided into two groups: One group used a rinse with an antiplaque ingredient, and the control group used a rinse containing inactive ingredients. Suppose that the plaque growth on each
17. Ground or Air? The earth’s temperature can be measured using ground-based sensoring which is accurate but tedious, or infrared-sensoring which appears to introduce a bias into the temperature readings—that is, the average temperature reading may not be equal to the average obtained by
18. Red Dye To test the comparative brightness of two red dyes, nine samples of cloth were divided into two pieces. One of the two pieces in each sample was randomly chosen and red dye 1 applied; red dye 2 was applied to the remaining piece. The following data represent a “brightness score” for
19. Tax Assessors In response to a complaint that a particular tax assessor (1) was biased, an experiment was conducted to compare the assessor named in the complaint with another tax assessor(2) from the same office. Eight properties were selected, and each was assessed by both assessors. The
20. Memory Experiments Twenty students participated in an experiment in which they were first asked to recall a list of 25 words. They were then given a second list, and asked to form images of the words as they were read. The number of words recalled for each student is given in the table.Does it
21. Music in the Workplace Before contracting to have music piped into each of his suites of offices, an executive randomly selected seven offices and had the system installed. The average time(in minutes) spent outside these offices per excursion among the employees involved was recorded before
23. Safety Programs Data were collected on lost-time accidents (mean work-hours lost per month over a period of 1 year) before and after an industrial safety program was put into effect at six industrial plants. Do the data provide sufficient evidence to indicate whether the safety program was
Showing 2400 - 2500
of 6613
First
18
19
20
21
22
23
24
25
26
27
28
29
30
31
32
Last
Step by Step Answers