New Semester
Started
Get
50% OFF
Study Help!
--h --m --s
Claim Now
Question Answers
Textbooks
Find textbooks, questions and answers
Oops, something went wrong!
Change your search query and then try again
S
Books
FREE
Study Help
Expert Questions
Accounting
General Management
Mathematics
Finance
Organizational Behaviour
Law
Physics
Operating System
Management Leadership
Sociology
Programming
Marketing
Database
Computer Network
Economics
Textbooks Solutions
Accounting
Managerial Accounting
Management Leadership
Cost Accounting
Statistics
Business Law
Corporate Finance
Finance
Economics
Auditing
Tutors
Online Tutors
Find a Tutor
Hire a Tutor
Become a Tutor
AI Tutor
AI Study Planner
NEW
Sell Books
Search
Search
Sign In
Register
study help
business
statistics alive
Introduction To Probability And Statistics 15th Edition William Mendenhall Iii , Robert Beaver , Barbara Beaver - Solutions
5. Estimating p to within .04 with probability .95. You suspect that p is equal to some value between .1 and .3.(hint: When calculating the standard error, use the value of p in the interval .1, p , .3 that will give the largest sample size.) Suppose you want to estimate one of four parameters—m,
4. Estimating the difference between two means with a margin of error equal to 65. Assume that the sample sizes will be equal and that s
3. Estimating m 2m 1 2 to within .17 with probability .90.Assume that the sample sizes will be equal and that s
2. Estimating m correct to within 2 with probability .99.Prior experience suggests that the measurements will range from 12 to 36. Suppose you want to estimate one of four parameters—m, m 2m , , 2 1 2 1 2 p or p p —to within a given bound with a certain amount of confidence.Use the information
1. Estimating m to within 1.6 with probability .95. Prior experience suggests that s 512.7.Suppose you want to estimate one of four parameters—m, m 2m , , 2 1 2 1 2 p or p p —to within a given bound with a certain amount of confidence.Use the information to find the appropriate sample size(s).
A personnel director wishes to compare the effectiveness of two methods for training employees to perform a certain assembly operation. Employees are to be divided into two equal groups: the first receiving training method 1 and the second training method 2. Each will perform the assembly
Because producers of PVC pipe want to have a supply of pipes sufficient to meet marketing needs, they want to estimate the proportion of wholesalers who plan to increase their purchases next year. What sample size is required if they want their estimate to be within .04 of the actual proportion
A manufacturer wants to estimate the average daily yield m of a chemical process and he wants the margin of error to be less than 4 tons. It is known from prior studies that the standard deviation of the average daily yields is s
21. Less Red Meat! As Americans become more conscious of the importance of good nutrition, some researchers believe that we may be eating less red meat than we used to eat. To test this theory, a researcher selects two groups of 400 subjects each and collects the following sample information on the
20. Operating Expenses A random sampling of a company’s monthly operating expenses for n536 months produced a sample mean of $5474 and a standard deviation of $764. Find a 90% upper confidence bound for the company’s mean monthly expenses.
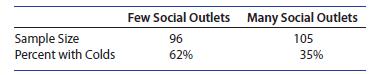
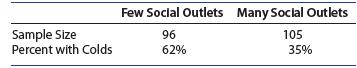
19. Catching a Cold, again Refer to Exercise 18(Section 8.5). The percentage of people catching a cold when exposed to a cold virus is shown in the table, for a group of people with only a few social contacts and a group with six or more activities.Construct a 95% lower confidence bound for the
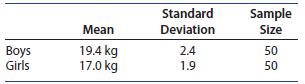
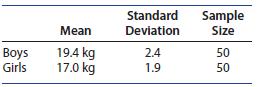
18. Big Kids, continued To determine whether there is a significant difference in the average weights of boys and girls beginning kindergarten, random samples of 50 5-year-old boys and 50 5-year-old girls produced the following information.Find a 99% lower confidence bound for the difference in the
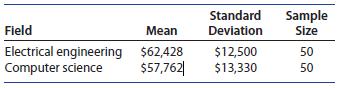
17. Starting Salaries, again College graduates with STEM majors have starting salaries that appear to be much better than those in non-STEM majors.14 Starting salaries for 50 randomly selected graduates in electrical engineering and 50 randomly selected graduates in computer science were compiled
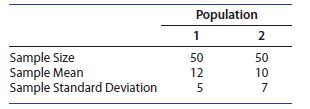
16. Independent random samples are drawn from two quantitative populations, producing the sample information shown in the table. Find a 95% upper confidence bound for the difference in the two population means Sample Size Sample Mean Sample Standard Deviation 1 Population 50 12 525 2 10 507
15. Find a 99% lower confidence bound for the binomial proportion p when a random sample of n5400 trials produced x5196 successes.
One-Sided Confidence Bounds for 1-2 Independent random samples were selected from two quantitative populations, with sample sizes, means, and variances given. Construct a 95% upper confidence bound for m 2m 1 2. Can you conclude that one mean is larger than the other? If so, which mean is
One-Sided Confidence Bounds for 1-2 Independent random samples were selected from two quantitative populations, with sample sizes, means, and variances given. Construct a 95% upper confidence bound for m 2m 1 2. Can you conclude that one mean is larger than the other? If so, which mean is
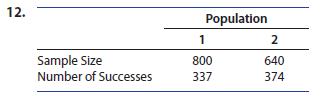
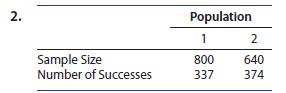
One-Sided Confidence Bounds for p1 - p2 Independent random samples were selected from two binomial populations, with sample sizes and the number of successes given. Construct a 98% lower confidence bound for the difference in the population proportions. 12. Population 1 2 Sample Size 800 640 Number
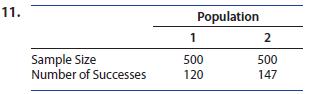
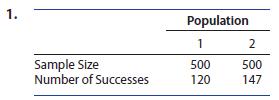
One-Sided Confidence Bounds for p1 - p2 Independent random samples were selected from two binomial populations, with sample sizes and the number of successes given. Construct a 98% lower confidence bound for the difference in the population proportions. 11. Population 1 2 Sample Size 500 500 Number
Use the information given to find the necessary confidence bound for the binomial proportion p. Interpret the interval that you have constructed 10. 99% upper bound, n=55, x=24
Use the information given to find the necessary confidence bound for the binomial proportion p. Interpret the interval that you have constructed 9. 95% lower bound, n=60, x = 54
Use the information given to find the necessary confidence bound for the binomial proportion p. Interpret the interval that you have constructed 8. 90% lower bound, n=40, x=25
Use the information given to find the necessary confidence bound for the population mean m. Interpret the interval that you have constructed. 7. 99% lower bound, n = 55, s = 25.8, x = 101.4
Use the information given to find the necessary confidence bound for the population mean m. Interpret the interval that you have constructed. 6. 95% upper bound, n = 60, s = 12.5, 18.6
Use the information given to find the necessary confidence bound for the population mean m. Interpret the interval that you have constructed. 5. 90% upper bound, n = 40, s = 65, x=75
Find the z-values needed to calculate one-sided confidence bounds for the confidence levels given 4. A 99% confidence bound
Find the z-values needed to calculate one-sided confidence bounds for the confidence levels given 3. A 98% confidence bound
Find the z-values needed to calculate one-sided confidence bounds for the confidence levels given 2. A 95% confidence bound
Find the z-values needed to calculate one-sided confidence bounds for the confidence levels given 1. A 90% confidence bound
A corporation plans to issue some short-term notes, a loan requiring the borrower to pay a specified amount plus interest within one year, and is hoping that the interest it will have to pay will not exceed 11.5%. To obtain some information about this problem, the corporation marketed 40 notes, one
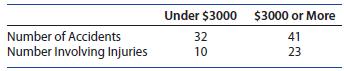
23. Auto Accidents A recent year’s records of auto accidents occurring on a given section of highway were classified according to whether the resulting damage was $3000 or more and to whether a physical injury resulted from the accident. The data follows: a. Estimate the true proportion of
22. Excedrin or Tylenol? In a study to compare the effects of two pain relievers it was found that of n 5200 1 randomly selected individuals who used the first pain reliever, 93% indicated that it relieved their pain. Of n 5450 2 randomly selected individuals who used the second pain reliever, 96%
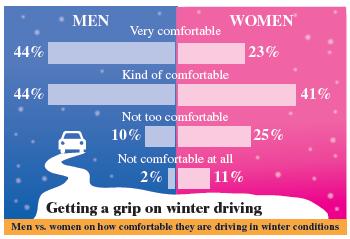
21. Winter Driving A USA Today snapshot shows that men and women feel differently about driving in winter conditions, as shown in the following graphic.22 Suppose that the survey involved random samples of 491 men and 398 women who drive in snow.a. Construct a 90% confidence interval for the
20. Birth Order and College Success In a study of the relationship between birth order and college success, an investigator found that 126 in a sample of 180 college graduates were firstborn or only children. In a sample of 100 nongraduates of comparable age and socioeconomic background, the number
19. Union, Yes! A sampling of political candidates—200 randomly chosen from the West and 200 from the East—was classified according to whether the candidate received backing by a national labor union and whether the candidate won. In the West, 120 winners had union backing, and in the East, 142
18. Catching a Cold Do well-rounded people get fewer colds? A study in the Chronicle of Higher Education found that people who have only a few social outlets get more colds than those who are involved in a variety of social activities.21 Suppose that of the 276 healthy men and women tested, n 596 1
17. Does It Pay to Haggle? In Exercise 16, a survey done by Consumer Reports indicates that you should always try to negotiate for a better deal when shopping or paying for services.20 In fact, based on the survey, 37% of the people under age 34 were more likely to“haggle,” while only 13% of
16. When Bargaining Pays Off According to a survey done by Consumer Reports, you should always try to negotiate for a better deal when shopping or paying for services.20 Tips include researching prices at other stores and on the Internet, timing your visit late in the month when salespeople are
15. Baseball Fans The first day of baseball comes in late March, ending in October with the World Series.Does fan support grow as the season goes on? Two CNN/USA Today/Gallup polls, one conducted in March and one in November, both involved random samples of 1001 adults aged 18 and older. In the
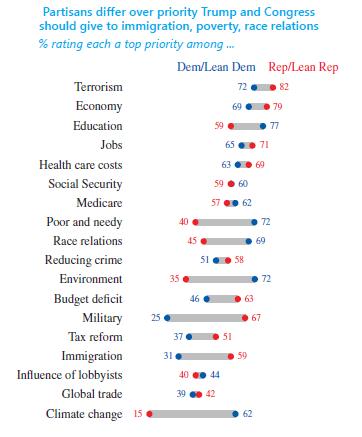
14. Different Priorities As we approached the end of 2017, Democrats and Republicans were split about our nation’s top priorities.18 Pew Research Center surveyed 651 adults described as “Republican or leaning Republican”and 726 adults described as “Democrat or leaning Democrat” and
12. Chicken Feed An experimenter fed different rations, A and B, to two groups of 100 chicks each.Assume that all factors other than rations are the same for both groups. Of the chicks fed ration A, 13 died, and of the chicks fed ration B, 6 died.a. Construct a 98% confidence interval for the true
11. Independent random samples of n 51265 1 and n 51688 2 observations were selected from binomial populations 1and 2, and 5849 and 5910 1 2 x x successes were observed.a. Find a 99% confidence interval for the difference(p 2 p ) 1 2 in the two population proportions. What does “ 99%
For the confidence intervals given , can you conclude that there is a difference between p1 and p2? Explain 10.-.67P-P2
For the confidence intervals given , can you conclude that there is a difference between p1 and p2? Explain 9.-.002P P
For the confidence intervals given , can you conclude that there is a difference between p1 and p2? Explain 8.51
For the confidence intervals given , can you conclude that there is a difference between p1 and p2? Explain 7. .51 P P
Independent random samples were selected from two binomial populations, with sample sizes and the number of successes given Find the best point estimate for the difference in the population proportion of successes and calculate the margin of error. 6. n =60, n=60, x =43, x2 = 36
Independent random samples were selected from two binomial populations, with sample sizes and the number of successes given Find the best point estimate for the difference in the population proportion of successes and calculate the margin of error. 5. n =1250, n=1100, x = 565, x, = 621
4. Can you conclude with 95% confidence that there is a difference in the proportion of successes for the two populations in Exercise 2? With 99% confidence?
3. Can you conclude with 95% confidence that there is a difference in the proportion of successes for the two populations in Exercise 1? With 99% confidence?
Independent random samples were selected from two binomial populations, with sample sizes and the number of successes given. Construct a 95% and a 99% confidence interval for the difference in the population proportions. What does the phrase “95% confident” or “99% confident” mean? 2.
Independent random samples were selected from two binomial populations, with sample sizes and the number of successes given. Construct a 95% and a 99% confidence interval for the difference in the population proportions. What does the phrase “95% confident” or “99% confident” mean? 1.
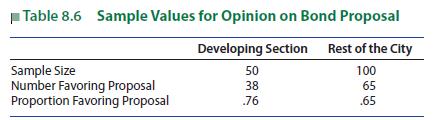
A bond proposal for school construction is on the ballot at the next city election. Money from this bond issue will be used to build schools in a rapidly developing section of the city, and the remainder will be used to renovate and update school buildings in the rest of the city. To assess the
21. Big Kids To determine whether there is a significant difference in the weights of boys and girls beginning kindergarten, random samples of 50 boys and 50 girls aged 5 years produced the following information.a. What is the point estimate of the difference in the average weights for 5-year old
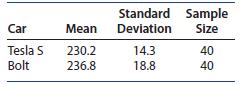
20. Electric Cars Although there is a big difference in costs between a Tesla S and a Chevrolet Bolt, is there a difference in the range of miles for these vehicles between charges? Suppose that the results of driving tests are as followsa. Calculate a point estimate for the difference in the
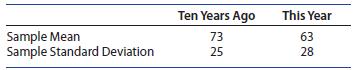
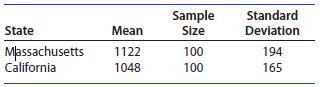
19. SATs, again How do states stack up against each other in SAT scores? To compare California and Massachusetts scores, random samples of 100 students from each state were selected and their SAT scores recorded with the following resultsa. Find a point estimate for the difference in mean SAT
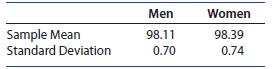
18. What’s Normal, continued Of the 130 people in Exercise 36 (Section 8.3), 65 were female and 65 were male.11 The means and standard deviations of their temperatures(in degrees Fahrenheit) are shown here.Find a 95% confidence interval for the difference in the average body temperatures for
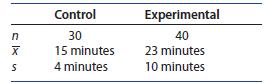
17. Noise and Stress To compare the effect of stress caused by noise on the ability to perform a simple task, 70 subjects were divided into two groups—30 subjects as a control group, and 40 subjects as the experimental group. Although each subject performed the task, the experimental group had to
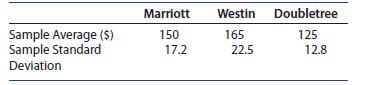
16. Hotel Costs, again Suppose that we randomly select 50 billing statements from each of the computer databases of the Marriott, Westin, and Doubletree hotel chains. The means and standard deviations for the data are given in the table:a. Find a 95% confidence interval for the difference in the
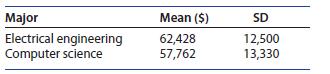
15. Starting Salaries As a group, students majoring in the engineering disciplines have the highest salary expectations, followed by those studying the computer science fields, according to a Michigan State University study.14 To compare the starting salaries of college graduates majoring in
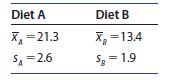
14. Are You Dieting? To compare two weight reduction diets A and B, 60 dieters were randomly selected. One group of 30 dieters was placed on diet A and the other 30 on diet B, and their weight losses were recorded over a 30-day period. The means and standard deviations of the weight-loss
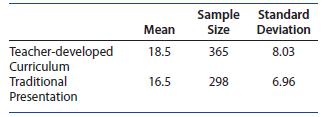
13. Teaching Biology An experiment was conducted to compare a teacher-developed curriculum, that was standards-based, activity-oriented, and inquiry-centered to the traditional presentation using lecture, vocabulary, and memorized facts. The test results when students were tested on biology
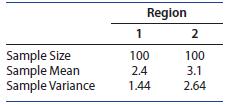
12. 9-1-1 Samples of 100 8-hour shifts were randomly selected from the police records for each of two districts in a large city. The number of police emergency calls was recorded for each shift. The sample statistics are listed here:Find a 90% confidence interval for the difference in the mean
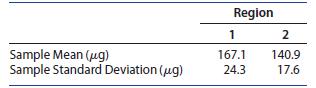
11. Selenium A small amount of the trace element selenium, 502200 micrograms (mg) per day, is considered essential to good health. Suppose that a random sample of 30 adults was selected from each of two regions of the United States and that each person’s daily selenium intake was recorded. The
For the confidence intervals given, can you conclude that there is a difference between m1 and m2? Explain 10. 154.2
For the confidence intervals given, can you conclude that there is a difference between m1 and m2? Explain 9.-15.43
For the confidence intervals given, can you conclude that there is a difference between m1 and m2? Explain 8. 136.2
For the confidence intervals given, can you conclude that there is a difference between m1 and m2? Explain. 7.5.2
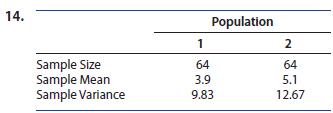
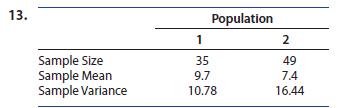
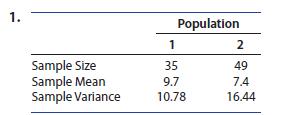
Independent random samples were selected from two quantitative populations, with sample sizes, means, and variances given. Construct a 95% confidence interval for the difference in the population means.Then find a point estimate for the difference in the population means and calculate the margin of
Independent random samples were selected from two quantitative populations, with sample sizes, means, and variances given. Construct a 95% confidence interval for the difference in the population means.Then find a point estimate for the difference in the population means and calculate the margin of
4. Can you conclude with 90% confidence that there is a difference in the means for the two populations in Exercise 2? With 99% confidence?
3. Can you conclude with 90% confidence that there is a difference in the means for the two populations in Exercise 1? With 99% confidence?
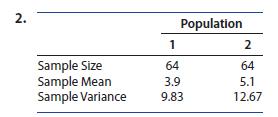
Independent random samples were selected from two quantitative populations, with sample sizes, means, and variances given Construct a 90% and a 99% confidence interval for the difference in the population means. What does the phrase “90% confident” or “99% confident”mean? 2. 1 Population 2
Independent random samples were selected from two quantitative populations, with sample sizes, means, and variances given Construct a 90% and a 99% confidence interval for the difference in the population means. What does the phrase “90% confident” or “99% confident”mean? 1. Population 1 2
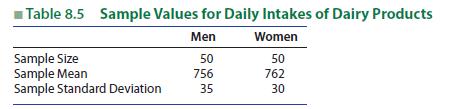
The experimenter in Example 8.6 wondered whether there was a difference in the average daily intakes of dairy products between men and women. He took a sample of n 550 1 adult men and n 550 2 adult women and recorded their daily intakes of dairy products in grams per day. A summary of his sample
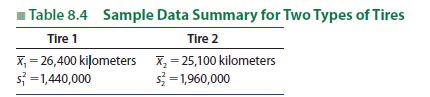
The wearing qualities of two types of automobile tires were compared by road-testing samples of n 5n 5100 1 2 tires for each type and recording the number of kilometers until wearout, defined as a specific amount of tire wear. The test results are given in Table 8.4.Estimate (m 2m ) 1 2, the
37. Hired by a Robot? Will there be a time when hiring decisions will be done using a computer algorithm, and without any human involvement? A Pew Research survey found that 67% of the adults surveyed were worried about the development of algorithms that can evaluate and hire job candidates.12 To
36. What’s Normal? What is normal, when it comes to people’s body temperatures? A random sample of 130 human body temperatures, provided by Allen Shoemaker11 in the Journal of Statistical Education, had a mean of 98.258 Fahrenheit and a standard deviation of 0.738 Fahrenheit.a. Construct a 99%
35. Hybrid or EV? In an attempt to reduce their carbon footprint, many consumers are purchasing hybrid, plug-in hybrid, or electric cars. Consumer Reports ranks the Chevrolet Bolt first among electric cars, with an EPA rating of 238 miles between battery charges, although others report a range
34. SUVs A survey is designed to estimate the proportion of sports utility vehicles (SUVs) being driven in the state of California. A random sample of 500 registrations are selected from a Department of Motor Vehicles database, and 68 are classified as SUVs.a. Use a 95% confidence interval to
33. Same-Sex Marriage The results of a 2017 Gallup poll concerning views on same-sex marriage showed that of n51011 adults, 64% thought that same-sex marriage should be valid, 34% thought it should not be valid, and 2% had no opinion.9 The poll reported a margin of error of plus or minus 4%.a.
32. Hamburger Meat A supermarket chain packages ground beef using meat trays of two sizes: one that holds approximately 1 pound of meat, and one that holds approximately 3 pounds. A random sample of 35 packages in the smaller meat trays produced weight measurements with an average of 1.01 pounds
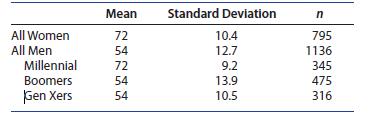
31. Working Women According to a survey in Advertising Age, working men reported doing 54 minutes of household chores a day, while working women reported tackling 72 minutes daily. But when examined more closely, Millennial men reported doing just as many household chores as the average working
30. Acid Rain Acid rain—rain with a pH value less than 5.7, caused by the reaction of certain air pollutants with rainwater—is a growing problem in the United States. Suppose water samples from 40 rainfalls are analyzed for pH, and x and s are equal to 3.7 and .5, respectively. Find a 99%
29. A Chemistry Experiment Each of n530 students in a chemistry class measured the amount of copper precipitated from a saturated solution of copper sulfate over a 30-minute period. The sample mean and standard deviation of the 30 measurements were equal to .145 and .0051 mole, respectively. Find a
28. Basketball Tickets Can you afford the price of an NBA ticket during the regular season? The website www.answers.com indicates that the low prices are around $10 for the high up seats while the court-side seats are around $2000 to $5000 per game and the average price of a ticket is $75.50 a
27. School Workers In addition to teachers and administrative staff, schools also have many other employees, including bus drivers, custodians, and cafeteria workers In Auburn, WA, the average hourly wage is $24.98 for grounds persons, $21.80 for custodians, and $17.66 for assistant cooks.6 Suppose
26. Right- or Left-Handed A researcher classified his subjects as right-handed or left-handed by comparing thumbnail widths. He took a sample of 400 men and found that 80 men could be classified as left-handed according to his criterion. Estimate the proportion of all males in the population who
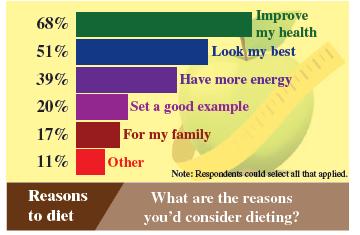
25. Why Diet? A USA Today snapshot reported the results of a random sample of 500 women who were asked what reasons they might have to consider dieting, 5 with the following results.a. Find a 95% confidence interval for the proportion of all women who would consider dieting to improve their
24. Six-Month Growth Spurt A pediatrician randomly selected 50 six-month-old boys from her practice’s database and recorded an average weight of 8.0 kilograms with a standard deviation of 0.30 kilogram. She also recorded an average length of 67.3 centimeters with a standard deviation of 0.64
A random sample of n=100 measurements has been selected from a population with unknown mean m and known standard deviation s =10. Calculate the width of the confidence interval for m for the confidence levels given. What effect do the changing confidence levels have on the width of the interval?
A random sample of n=100 measurements has been selected from a population with unknown mean m and known standard deviation s =10. Calculate the width of the confidence interval for m for the confidence levels given. What effect do the changing confidence levels have on the width of the interval?
A random sample of n=100 measurements has been selected from a population with unknown mean m and known standard deviation s =10. Calculate the width of the confidence interval for m for the confidence levels given. What effect do the changing confidence levels have on the width of the interval?
A random sample of n measurements has been selected from a population with unknown mean m and known standard deviation s 510.Calculate the width of a 95% confidence interval for m for the sample sizes given. What effect do the changing sample sizes have on the width of the interval? 20. n=400
A random sample of n measurements has been selected from a population with unknown mean m and known standard deviation s 510.Calculate the width of a 95% confidence interval for m for the sample sizes given. What effect do the changing sample sizes have on the width of the interval? 19. n = 200
A random sample of n measurements has been selected from a population with unknown mean m and known standard deviation s 510.Calculate the width of a 95% confidence interval for m for the sample sizes given. What effect do the changing sample sizes have on the width of the interval? 18. n = 100
17. A 95% confidence interval for p, based on a random sample of 500 trials of a binomial experiment which produced 27 successes find the necessary confidence interval for the binomial proportion p. Interpret the interval that you have constructed.
16. A 90% confidence interval for p, based on a random sample of n5300 observations from a binomial population with x5263 successes. find the necessary confidence interval for the binomial proportion p. Interpret the interval that you have constructed.
Find the necessary confidence interval for the population mean m. Interpret the interval that you have constructed. 15. a .05, n=89, x = 66.3, s = 2.48
Find the necessary confidence interval for the population mean m. Interpret the interval that you have constructed. 14. a .10, n = 65, 1049, s2=51
Showing 2700 - 2800
of 6613
First
21
22
23
24
25
26
27
28
29
30
31
32
33
34
35
Last
Step by Step Answers