New Semester
Started
Get
50% OFF
Study Help!
--h --m --s
Claim Now
Question Answers
Textbooks
Find textbooks, questions and answers
Oops, something went wrong!
Change your search query and then try again
S
Books
FREE
Study Help
Expert Questions
Accounting
General Management
Mathematics
Finance
Organizational Behaviour
Law
Physics
Operating System
Management Leadership
Sociology
Programming
Marketing
Database
Computer Network
Economics
Textbooks Solutions
Accounting
Managerial Accounting
Management Leadership
Cost Accounting
Statistics
Business Law
Corporate Finance
Finance
Economics
Auditing
Tutors
Online Tutors
Find a Tutor
Hire a Tutor
Become a Tutor
AI Tutor
AI Study Planner
NEW
Sell Books
Search
Search
Sign In
Register
study help
business
statistics alive
Introduction To Probability And Statistics 15th Edition William Mendenhall Iii , Robert Beaver , Barbara Beaver - Solutions
Test for a significant difference in the treatment and block means using 5 .01. Bound the p-value for the test of equality of treatment means. If a difference exists among the treatment means, use Tukey’s test with 5 .01 to identify where the differences lie. Summarize your results. 7.
Construct an ANOVA table showing the sources of variation and their respective degrees of freedom. 4. A randomized block design used to compare the means of three treatments within five blocks.
Construct an ANOVA table showing the sources of variation and their respective degrees of freedom. 3. A randomized block design used to compare the means of four treatments within three blocks
Construct an ANOVA table showing the sources of variation and their respective degrees of freedom. 2. A randomized block design used to compare the means of three treatments within six blocks.
1. What is assumed about block and treatment effects in a randomized block design?
Identify the nature of any differences you found in the average monthly cell phone costs from Example 11.8.
Do the data in Example 11.8 provide sufficient evidence to indicate a difference in the average monthly cell phone cost depending on the company the customer uses?
1. What are the assumptions needed for the results of Tukey’s test to be valid?
Refer to Example 11.4, in which you compared the average attention spans for students given three different “meal” treatments: no breakfast, a light breakfast, or a full breakfast. The ANOVA F-test in Example 11.5 indicated a significant difference in the population means. Use Tukey’s method
9. Hostility, continued Refer to Exercise 8. Let A m and B m , respectively, denote the mean scores for the populations of extremely hostile students who could be treated by methods A and B.a. Find a 95% confidence interval for A m .b. Find a 95% confidence interval for B m .c. Find a 95%
Find a confidence interval estimate for 1 m and for the difference 1 2 m 2m using the information given 6. Refer to Exercise 2. MSE56.67 with 20 degrees of freedom, x 88.0 1 5 and x 83.9 2 5 , 90% confidence.
Find a confidence interval estimate for 1 m and for the difference 1 2 m 2m using the information given 5. Refer to Exercise 1. MSE5.675 with 24 degrees of freedom, x 3.07 1 5 and x 2.52 2 5 , 95% confidence.
Construct an ANOVA table for these one-way classifications.Provide a formal test of : ... 0 1 2 H k m 5m 5 5m including the rejection region with a 5.05. Bound the p-value for the test and state your conclusions.2. Independent samples of 6 measurements from each of 4 populations; Total SS=473.2,
Construct an ANOVA table for these one-way classifications.Provide a formal test of : ... 0 1 2 H k m 5m 5 5m including the rejection region with a 5.05. Bound the p-value for the test and state your conclusions.1. Independent samples of 5 measurements from each of 6 populations; Total SS=21.4,
The researcher in Example 11.4 believes that students who have no breakfast will have significantly shorter attention spans but that there may be no difference between those who eat a light or a full breakfast. Find a 95% confidence interval for the average attention span for students who eat no
Do the data in Example 11.4 provide sufficient evidence to indicate a difference in the average attention spans depending on the type of breakfast eaten by the student?
A researcher is interested in the effects of five types of insecticides for use in controlling the boll weevil in cotton fields. Explain how to implement a completely randomized design to investigate the effects of the five insecticides on crop yield.
16. The systolic blood pressures are recorded for healthy individuals 40 to 50 years of age. Explain why you would or why you would not be willing to assume that the data described are normal.
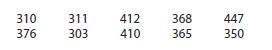
15. The lengths of scrap lumber left after cutting boards to the nearest meter are recorded. Explain why you would or why you would not be willing to assume that the data described are normal.
14. The proportion of defective items among 100 items selected from daily output is recorded for 25 days. Explain why you would or why you would not be willing to assume that the data described are normal.
13. Scores on a math achievement test are recorded for students completing the seventh grade. Explain why you would or why you would not be willing to assume that the data described are normal.
12. A group of individuals are tested until the first person with type O-negative blood is located and this result is recorded. This process continues until 10 individuals with type O-negative blood are found.Explain why you would or why you would not be willing to assume that the data described
11. An educator would like to assess the relative advantages of using a TI-84 calculator, an iPad, or a laptop in teaching math to ninth graders. Identify the treatments or factors and levels
10. A supervisor would like to compare the effect of using raw material obtained from four different sources, each processed using three fixed temperature settings. Identify the treatments or factors and levels
9. A researcher wishes to investigate the effect of daily doses of vitamin C at doses of 200, 500, and 1000 mg on preventing the common cold. Identify the treatments or factors and levels
8. A grower wishes to compare three types of fertilizers as they affect crop yield. Identify the treatments or factors and levels
Define the term Response
Define the term Treatment
Define the term Level of a factor
Define the term Experimental unit
Define the term Observational study
1. What are the assumptions regarding the sampled populations and the sampling methods in order to use an analysis of variance?
Suppose that the experimenter in Example 11.1 began by randomly selecting 20 men and 20 women for the experiment. These two groups were then randomly divided into 10 each for the experimental and control groups. What are the factors, levels, and treatments in this experiment?
A group of people is randomly divided into an experimental and a control group. The control group is given an aptitude test after having eaten a full breakfast. The experimental group is given the same test without having eaten any breakfast. What are the factors, levels, and treatments in this
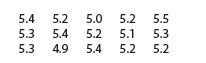
31. RBC Counts Here are the red blood cell counts (in 106 cells per microliter) of a healthy person measured on each of 15 days:Find a 95% confidence interval estimate of m, the true mean red blood cell count for this person during the period of testing. 5.4 5.2 5.0 5.2 5.5 5.3 5.4 5.2 5.1 5.3 5.3
Calculate s2, the pooled estimator of σ2and provide the degrees of freedom for s2 : 6. n =12, n=21, s=18, s = 23
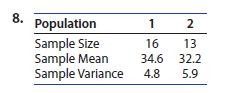
State the null and alternative hypotheses for testing for a significant difference in means, calculate the pooled estimate of 2 , the associated degrees of freedom, and the observed value of the t statistic. What is the rejection region using a 5.05? What is the p-value for the test? What can
State the null and alternative hypotheses for testing for a significant difference in means, calculate the pooled estimate of 2 , the associated degrees of freedom, and the observed value of the t statistic. What is the rejection region using a 5.05? What is the p-value for the test? What can
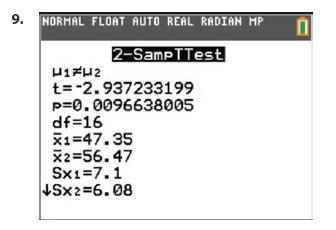
Use the TI-84 Plus and the Excel printouts . In testing for a difference between the two population means, would you conclude that the assumption of a common variance is reasonable?What is the observed value of the test statistic?What are the degrees of freedom for the pooled estimate of the
Use the TI-84 Plus and the Excel printouts . In testing for a difference between the two population means, would you conclude that the assumption of a common variance is reasonable?What is the observed value of the test statistic?What are the degrees of freedom for the pooled estimate of the
11. Enzymes Two methods were used to measure the specific activity of an enzyme, measured in units of enzyme activity per milligram of protein.a. If the researcher wants to test for a difference in the average activity for the two methods, what is the hypothesis to be tested?b. Test the hypothesis
12. Books or iPads? An experiment was conducted to compare the use of iPads versus regular textbooks in teaching algebra to two classes of middle school students.6 To remove teacher-to-teacher variation, the same teacher taught both classes, and all teaching materials were provided by the same
13. Food Production Suppose you wish to compare the mean amount of oil required to produce 1 acre of corn versus 1 acre of cauliflower. The readings (in barrels of oil per acre), based on 20-acre plots, seven for each crop, are shown in the tablea. Use these data to find a 90% confidence interval
14. Healthy Teeth In a study on the effect of an oral rinse on plaque buildup on teeth, 14 people whose teeth were thoroughly cleaned and polished were randomly assigned to two groups of seven subjects each.7 Both groups were assigned to use oral rinses (no brushing) for a 2-week period. Group 1
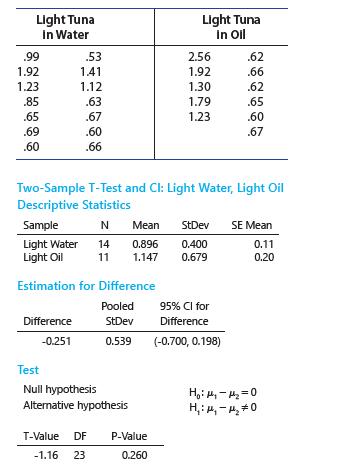
15. Tuna, again Data on the estimated average price for a variety of different brands of tuna, based on prices paid nationally in supermarkets, are shown in the following table.1 Use the MINITAB printout to answer the questions in parts a–c.a. Do the data in the table present sufficient evidence
Calculate s2, the pooled estimator of σ2and provide the degrees of freedom for s2 : 5. n=10, n=4, s=3.4, s2=4.9
Calculate the number of degrees of freedom for s2, the pooled estimator of σ2 4. n =15, n = 3
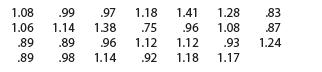
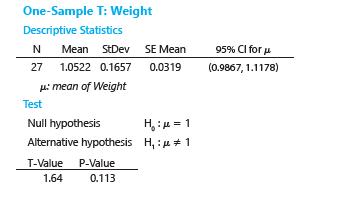
32. Hamburger Meat These data are the weights(in pounds) of 27 packages of ground beef in a supermarket meat display:a. Interpret the accompanying MINITAB printout for the one-sample test and estimation procedures.b. Verify the calculated values of t and the upper and lower confidence limits. 1.08
33. Cholesterol The serum cholesterol levels of 50 subjects randomly selected from the L.A.Heart Data, data from a heart disease study on Los Angeles County employees,5 follow.a. Construct a histogram for the data. Are the data approximately mound-shaped?b. Use a t distribution to construct a 95%
34. Cholesterol, continued Refer to Exercise 33.Since n.30, use the methods of Chapter 8 to create a large-sample 95% confidence interval for the average serum cholesterol level for L.A. County employees.Compare the two intervals. (hint: The two intervals should be quite similar. This is the reason
35. Sodium Chloride Measurements of water intake, obtained from a sample of 17 rats that had been injected with a sodium chloride solution, produced a mean and standard deviation of 31.0 and 6.2 cubic centimeters(cm3 ), respectively. Suppose that the average water intake for noninjected rats
36. Sleep and the College Student How much sleep do you get on a typical school night? A group of 10 college students were asked to report the number of hours that they slept on the previous night with the following results:a. Find a 99% confidence interval for the average number of hours that
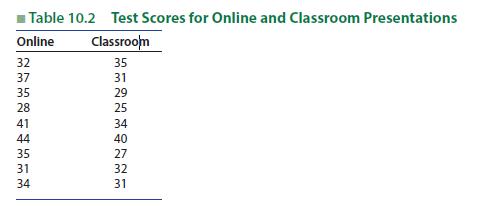
A course can be taken for credit either by attending lecture sessions in a classroom, or by doing online sessions. The instructor wants to know if these two ways of taking the course resulted in a significant difference in achievement as measured by the final exam for the course.Table 10.2 gives
Use a lower 95% confidence bound to estimate the difference (m 2m ) 1 2 in Example 10.5.Does the lower confidence bound indicate that the online average is significantly higher than the classroom average?
1. What assumptions are made about the populations from which random samples are drawn when the t distribution is used to make small-sample inferences about the difference in population means?
Calculate the number of degrees of freedom for s2, the pooled estimator of σ2 2. n =16, n = 8 =8
Calculate the number of degrees of freedom for s2, the pooled estimator of σ2 2. n =16, n = 8 =8
16. Runners and Cyclists An experiment was conducted involving 10 healthy runners and 10 healthy cyclists to determine whether there are significant differences in pressure measurements within the anterior muscle compartment.8 The data summary—compartment pressure in millimeters of mercury
17. Disinfectants An experiment was conducted to study the use of 95% ethanol versus 20% bleach as a disinfectant in removing contamination when culturing plant tissues. The experiment was repeated 15 times with each disinfectant, using cuttings of eggplant tissue.9 The observation reported was the
Calculate the number of degrees of freedom for a paired-difference test with n1=n2=number of observations in each sample and n=number of pairs. 2. n = n = 8
Calculate the number of degrees of freedom for a paired-difference test with n1=n2=number of observations in each sample and n=number of pairs. 3. n=12
Calculate the number of degrees of freedom for a paired-difference test with n1=n2=number of observations in each sample and n=number of pairs. 4. n = n =15
calculate the differences, di and the values for d and sd. 6. Sample 1 5.6 3.1 4.5 8.4 2.3 Sample 2 5.5 4.2 4.9 8.9 2.2
calculate the differences, di and the values for d and sd. 5. Sample 1 18 12 7 15 Sample 2 16 13 9 10
Calculate the observed value of the t statistic for testing the difference between the two population means using paired data. Approximate the p-value for the test and use it to state your conclusions 7. 3, s.16, n =n = 10, Hu, M 0
Calculate the observed value of the t statistic for testing the difference between the two population means using paired data. Approximate the p-value for the test and use it to state your conclusions 8. 5.7, s 256, n=18, H: p>0
calculate the observed value of the t statistic for testing the difference between the two population means using paired data. Find a rejection region with a 5.05 to state your conclusions. Construct a 95%confidence interval for 1 2 m 2m . Does this confirm the results of your hypothesis test? P.
10. Alcohol and Reaction Times To test the effect of alcohol in increasing the reaction time to respond to a given stimulus, the reaction times of seven people were measured both before and after drinking 90 milliliters of 40% alcohol. Do the following data indicate that the mean reaction time
11. At Home or at Preschool? Four sets of identical twins (pairs A, B, C, and D) were selected at random from a computer database of identical twins. One child was selected at random from each pair and was sent to preschool, while the other four children were kept at home as a control group. At the
Find a 95% confidence interval for ( ) 1 2 d m 2m 5m using the data in Table 10.3.
18. Titanium A geologist collected 20 different ore samples, all of the same weight, and randomly divided them into two groups. The titanium contents of the samples, found using two different methods, are listed in the tablea. Use an appropriate method to test for a significant difference in the
19. Raisins The numbers of raisins in each of 14 miniboxes (14-gram size) were counted for a generic brand and for Sunmaid® brand raisinsa. Although counts cannot have a normal distribution, do these data have approximately normal distributions?(hint: Use a histogram or stem and leaf plot.)b. Are
20. Dissolved O2 Content A pollution control inspector suspected that a river community was releasing amounts of semitreated sewage into a river. To check his theory, he drew five randomly selected specimens of river water at a location above the town, and another five below. The dissolved oxygen
21. Freestyle Swimmers To compare the average swimming times for two swimmers, each swimmer was asked to swim freestyle for a distance of 100 meters at randomly selected times. The swimmers were thoroughly rested between laps and did not race against each other, so that each sample of times was an
22. Freestyle Swimmers, continued Refer to Exercise 21. Construct a lower 95% one-sided confidence bound for the difference in the average times for the two swimmers. Does this interval confirm your conclusions in Exercise 21?
23. Comparing NFL Quarterbacks How does Alex Smith, quarterback for the Kansas City Chiefs, compare to Joe Flacco, quarterback for the Baltimore Ravens? The following table shows the number of completed passes for each athlete during the 2017 NFL football seasona. The TI-84 Plus analysis uses the
25. Drug Absorption To compare the mean lengths of time required for the bodily absorption of two drugs A and B, 10 people were randomly selected and assigned to receive one of the drugs. The length of time (in minutes)for the drug to reach a specified level in the blood was recorded, and the data
26. Drug Absorption, continued Refer to Exercise 25.Suppose you wish to estimate the difference in mean times to absorption correct to within 1 minute with probability approximately equal to .95.a. Approximately how large a sample is required for each drug (assume that the sample sizes are
27. Impact Strength The following data are readings (in foot-pounds) of the impact strengths of two kinds of packaging material:a. Use the MS Excel printout to determine whether there is evidence of a difference in the mean strengths for the two kinds of material.b. Are there practical implications
Do the data in Table 10.3 provide sufficient evidence to indicate a difference in the mean wear for tire types A and B? Test using a 5.05.
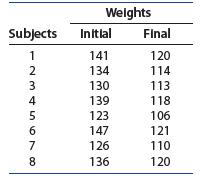
12. Dieting Eight obese persons were placed on a diet for 1 month, and their weights, at the beginning and at the end of the month, were recorded:Estimate the mean weight loss for obese persons when placed on the diet for a 1-month period. Use a 95% confidence interval and interpret your results.
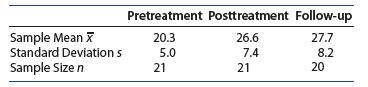
30. Bulimia An article in the British Journal of Clinical Psychology indicates that self-esteem was an important predictor of those who will benefit from treatment for bulimia.4 The table gives the mean and standard deviation of self-esteem scores prior to treatment, at posttreatment, and during a
For a t distribution with 5 degrees of freedom, the value of t that has area .05 to its right is found in row 5 in the column marked t.050. For this particular t distribution, the area to the right of t52.015 is .05; only 5% of all values of the t statistic will exceed this value.
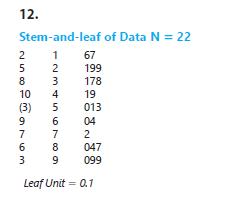
Use the graphical displays to decide whether the data have been selected from a normal population. Explain your answer 12. Stem-and-leaf of Data N = 22 2 1 67 5 2 199 8 3 178 10 4 19 (3) 5 013 9 7 6 3 6819 04 7 2 8 047 099 Leaf Unit = 0.1
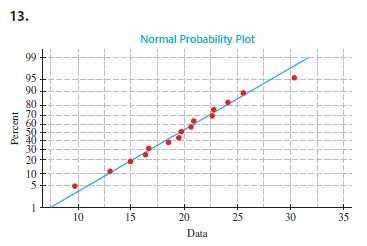
Use the graphical displays to decide whether the data have been selected from a normal population. Explain your answer Percent 13. 99 Normal Probability Plot 95 90 80 70 60 40 30 20 10 5 1 10 15 20 25 30 + 35 Data
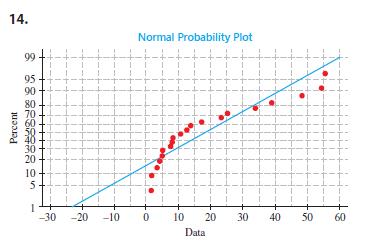
Use the graphical displays to decide whether the data have been selected from a normal population. Explain your answer 14. Percent 99 95 90 80 70 60 30 20 10 8885 Normal Probability Plot T-T II T-T -30 -20 -10 0 10 20 30 40 50 60 Data
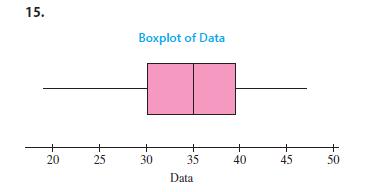
Use the graphical displays to decide whether the data have been selected from a normal population. Explain your answer 15. Boxplot of Data 10 20 + + + + + 25 30 35 40 45 50 Data
A new process for producing synthetic diamonds can be operated at a profitable level only if the average weight of the diamonds is greater than .5 karat. To evaluate the profitability of the process, six diamonds are generated, with recorded weights .46, .61, .52, .48, .57, and .54 karat. Do the
Labels on 1-gallon cans of paint usually indicate the drying time and the area that can be covered in one coat. One manufacturer claims that a gallon of its paint will cover 400 square feet of surface area. To test this claim, a random sample of ten 1-gallon cans of white paint were used to paint
Find the critical value(s) of t that specify the rejection region for the situations given 2. A two-tailed test with a = .01 and 12 df
Find the critical value(s) of t that specify the rejection region for the situations given 3. A right-tailed test with a = .05 and 16 df
Find the critical value(s) of t that specify the rejection region for the situations given 4. A two-tailed test with a = .05 and 25 df
Find the tabled value of t ( ta ) corresponding to a left-tail area a and degrees of freedom given 11. a .005, df =23
Find the tabled value of t ( ta ) corresponding to a left-tail area a and degrees of freedom given 10. a .10, df 35
Suppose you have a sample of size n510 from a normal distribution. Find a value of t such that only 1% of all values of t will be smaller.
1. What are the two assumptions that are required in order that the statistic follow a t distribution? S. n H - X
Find the tabled value of t ( ta ) corresponding to a right-tail area a and degrees of freedom given 2. a .05, df =20
Find the tabled value of t ( ta ) corresponding to a right-tail area a and degrees of freedom given 3. a=.01, df = 18
Find the tabled value of t ( ta ) corresponding to a right-tail area a and degrees of freedom given 4. a=.025, df = 12
Find the tabled value of t ( ta ) corresponding to a right-tail area a and degrees of freedom given 5. a .005, df =25
Showing 2300 - 2400
of 6613
First
17
18
19
20
21
22
23
24
25
26
27
28
29
30
31
Last
Step by Step Answers