New Semester
Started
Get
50% OFF
Study Help!
--h --m --s
Claim Now
Question Answers
Textbooks
Find textbooks, questions and answers
Oops, something went wrong!
Change your search query and then try again
S
Books
FREE
Study Help
Expert Questions
Accounting
General Management
Mathematics
Finance
Organizational Behaviour
Law
Physics
Operating System
Management Leadership
Sociology
Programming
Marketing
Database
Computer Network
Economics
Textbooks Solutions
Accounting
Managerial Accounting
Management Leadership
Cost Accounting
Statistics
Business Law
Corporate Finance
Finance
Economics
Auditing
Tutors
Online Tutors
Find a Tutor
Hire a Tutor
Become a Tutor
AI Tutor
AI Study Planner
NEW
Sell Books
Search
Search
Sign In
Register
study help
business
statistics alive
Introduction To Probability And Statistics 15th Edition William Mendenhall Iii , Robert Beaver , Barbara Beaver - Solutions
Refer to the MINITAB and MS Excel outputs in Exercises 5–6. Which if any of the partial regression coefficients are significant in the presence of other predictors already in the model?What percentage of the total variation in the experiment is explained by using the multiple linear regression
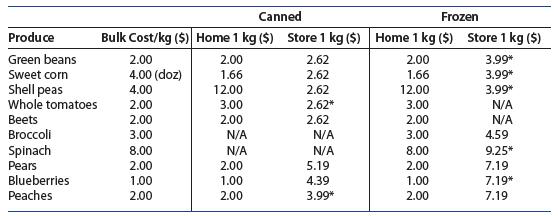
4. Summarize your results in the form of a report. Can you really save money by buying produce in bulk? Explain Canning or freezing produce that you buy in bulk will almost always save you money compared to buying in supermarkets. You can save more than 75% by canning—and more than 80% by
3. Use an appropriate analysis of variance procedure to analyze this data. If you find significance, use Tukey’s procedure to identify real differences in prices.Canning or freezing produce that you buy in bulk will almost always save you money compared to buying in supermarkets. You can save
2. Since the table is incomplete, consider deleting the rows corresponding to whole tomatoes, beets, broccoli, and spinach prior to analysis. Is the design given in part 1 still valid?Canning or freezing produce that you buy in bulk will almost always save you money compared to buying in
1. Does this layout correspond to any of the designs studied in this chapter? If so, identify the rows and/or columns as they relate to that design.Canning or freezing produce that you buy in bulk will almost always save you money compared to buying in supermarkets. You can save more than 75% by
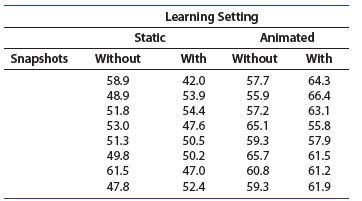
16. Animation Helps? To explore the use of animation versus static images in a learning setting, a factorial experiment measured retention of information under four factorial conditions: with animation or without animation; and reinforcement through snapshots or without snapshots of the major
15. Water Resistance in Textiles To compare the effects of four different chemicals in producing water resistance in textiles, a strip of material randomly selected from a bolt of material was cut into four pieces and the four pieces were randomly assigned to receive an application of one of the
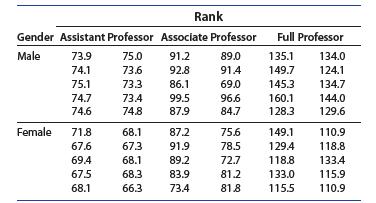
13. Professors’ Salaries II The U.S. Department of Education6 reports the salaries of professors at universities and colleges in the United States. The following data (in thousands of dollars) is adapted from the report for full-time faculty on 9-month contracts at not-for-profit institutions
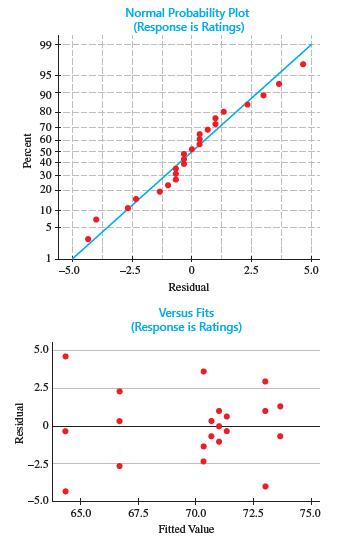
12. Smart Phones, continued Refer to Exercise 11.The diagnostic plots for this experiment are shown below. Does it appear that any of the analysis of variance assumptions have been violated? Explain. Residual -2.5 5.0 2.5 0 Percent 99- 95 90 80 70 60 50 40 30 20 10 5 Normal Probability Plot
11. Smart Phones The data that follow are the ratings for six smart phones from each of the four suppliers, three of which cost $650 or more and three of which cost less than $650 . The ratings have a maximum value of 100 and a minimum of 0.a. What type of experiment was used to evaluate these
10. Physical Fitness Researchers assessed the cardiorespiratory fitness levels in youth aged 12 to 19 years, using estimated maximum oxygen uptake (VO ) 2max to measure a person’s cardiorespiratory level.7 The data that follow are based on that study, and involve the relationship between levels
9. Yield of Wheat The yields of wheat (in bushels per acre) were compared for five different varieties, A, B, C, D, and E, at six different locations.Each variety was randomly assigned to a plot at each location. The results of the experiment are shown in the accompanying table, along with a
8. America’s Market Basket An advertisement for a popular supermarket chain claimed it has had consistently lower prices than one of its competitors.As part of a survey conducted by an independent price-checking company, the average weekly total, based on the prices of approximately 95 items, is
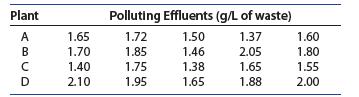
7. Pollution from Chemical Plants Four chemical plants, producing the same product and owned by the same company, discharge effluents into streams near their locations. To measure the pollution created by the effluents and determine whether this varies from plant to plant, the company collected
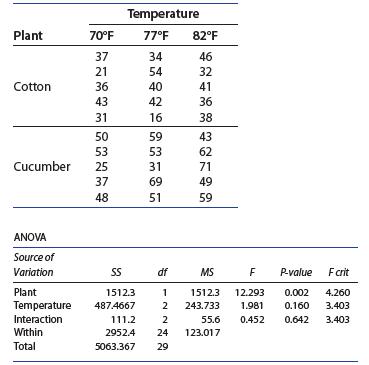
6. The Whitefly in California The whitefly, which causes defoliation of shrubs and trees and a reduction in salable crop yields, has emerged as a pest in Southern California. A study to determine factors that affect the life cycle of the whitefly was conducted in which whiteflies were placed on two
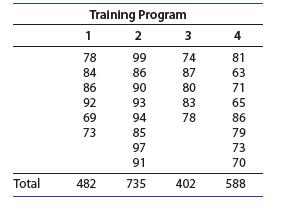
5. Learning to Sell To study the effects of four training programs on the sales abilities of their sales personnel, four equal-sized groups of employees were each subjected to a different sales training program. Because there were some dropouts during the training programs due to illness,
4. Reaction Times II The experiment in Exercise 1 might have been conducted more effectively using a randomized block design with people as blocks, because you would expect mean reaction time to vary from one person to another. Hence, four people were used in a new experiment, and each person was
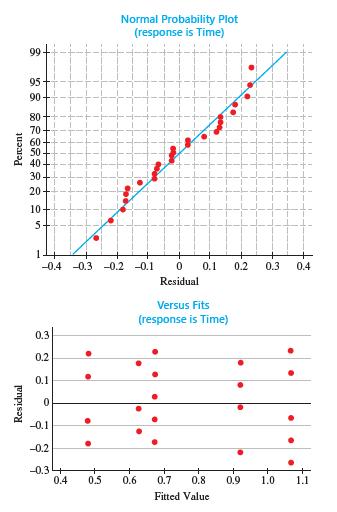
3. Refer to Exercise 1. What do the normal probability plot and the residuals versus fit plot tell you about the validity of your analysis of variance results? Residual Percent 95- 90- 80 70 60 50 40 30 20 10+ 5+ Normal Probability Plot (response is Time) 1 -0.4 -0.3 -0.2 -0.1 0 0.1 0.2 0.3 0.4
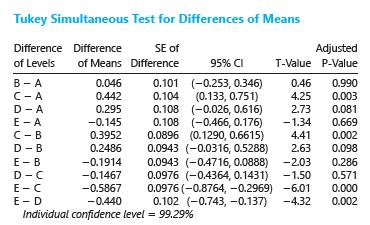
2. Refer to Exercise 1. Use this MINITAB output to identify the differences in the treatment means Tukey Simultaneous Test for Differences of Means Difference Difference SE of Adjusted of Levels of Means Difference 95% CI T-Value P-Value B-A 0.046 0.101 (-0.253, 0.346) 0.46 0.990 C-A 0.442 0.104
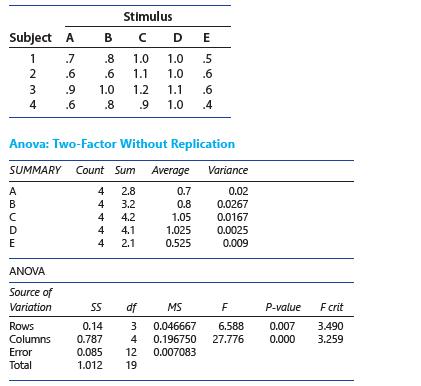
1. Reaction Times versus Stimuli A completely randomized design was used to compare the effects of five different stimuli on reaction time.Regardless of the results of the analysis of variance, the experimenters wanted to compare stimuli A and D.The results of the experiment are given here. Use the
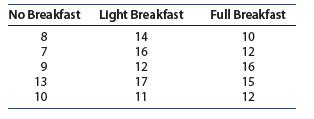
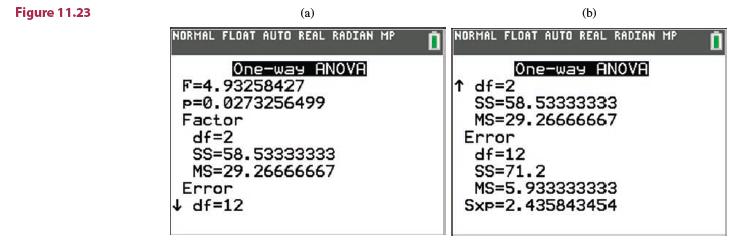
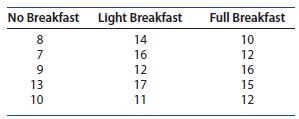
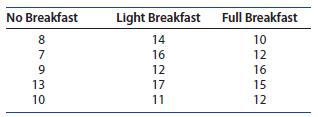
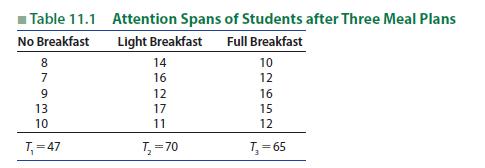
(Completely Randomized Design) Refer to the breakfast study in Example 11.4, in which the effect of nutrition on attention span was studied.1. Select stat ➤ EDIT and enter the recorded attention spans for the three treatments into lists L1, L2, and L3, respectively. Use stat ➤ TESTS ➤ H:
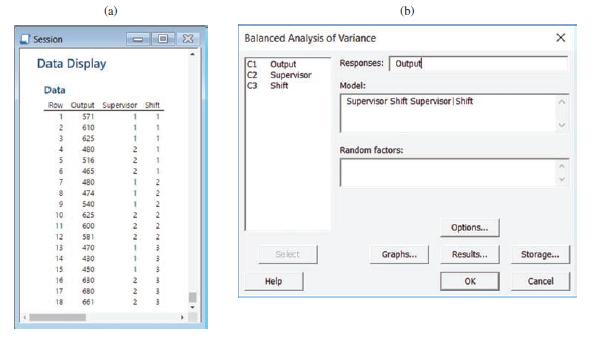
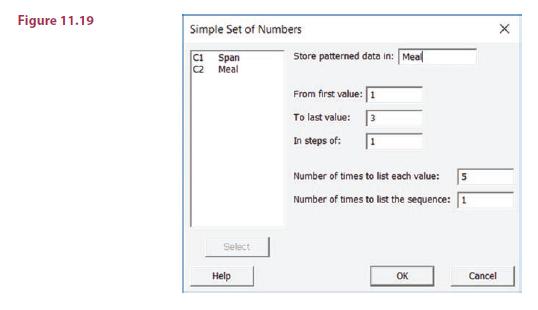
(Two-Way Classification) Refer to the production output study in Example 11.13, in which the effect of supervisor and shift on production output was studied1. Enter the data into the worksheet as shown in Figure 11.21(a). See if you can use the Calc ➤ Make Patterned Data ➤ Simple Set of Numbers
(Completely Randomized Design) Refer to the breakfast study in Example 11.4, in which the effect of nutrition on attention span was studied.1. Enter the 15 recorded attention spans in column C1 of a MINITAB worksheet and name them “Span.” Next, enter the integers 1, 2, and 3 into a second
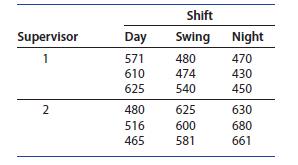
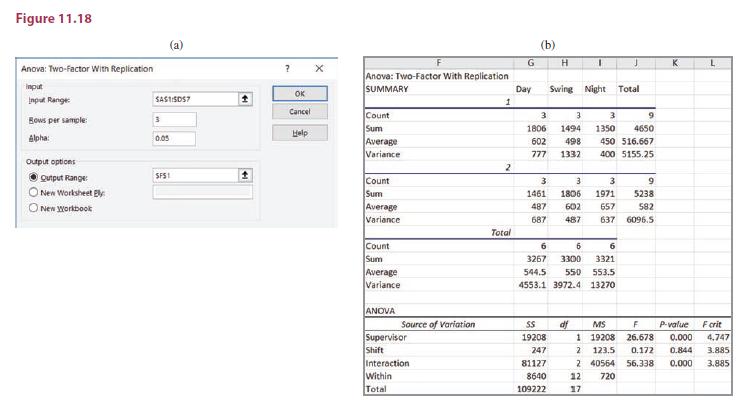
(Factorial Experiment) Refer to the production output study in Example 11.13, in which the effect of supervisor and shift on production output was studied.Enter the data into columns A–D of an Excel spreadsheet, using column A for supervisor labels and row 1 for shift labels, just as shown in the
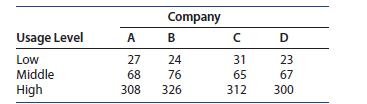
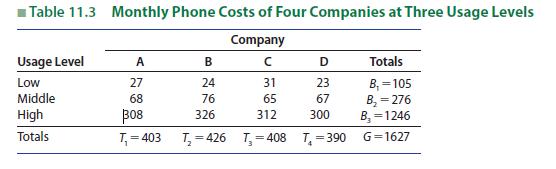
(Randomized Block Design) Refer to the cell phone study in Example 11.8, in which the effect of usage level on cost was studied for four different companies.Enter the data into columns A–E of an Excel spreadsheet, using column A for usage labels and row 1 for company labels, just as shown in the
(Completely Randomized Design) Refer to the breakfast study in Example 11.4, in which the effect of nutrition on attention span was studiedEnter the data into columns A, B, and C of an Excel spreadsheet with one sample per column.1. Use Data ➤ Data Analysis ➤ Anova: Single Factor to generate
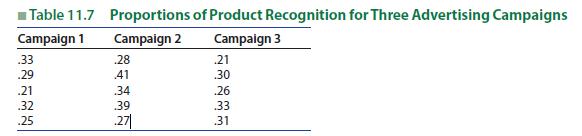
A company plans to promote a new product by using one of three advertising campaigns. To investigate the extent of product recognition from these three campaigns, 15 market areas were selected and five were randomly assigned to each advertising plan. At the end of the ad campaigns, random samples
The data from Example 11.4 involving the attention spans of three groups of elementary students were analyzed using MINITAB. The graphs in Figure 11.14, generated by MINITAB, are the normal probability plot and the residuals versus fit plot for this experiment. Look at the straight-line pattern in
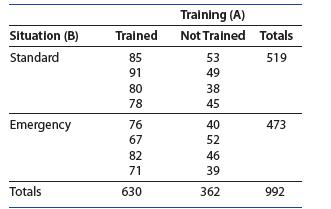
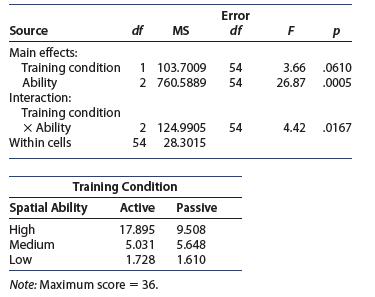
17. Management Training, continued Refer to Exercise 16. The data for this experiment are shown in the table.a. Construct the ANOVA table for this experiment.b. Is there a significant interaction between the presence or absence of training and the type of decision-making situation? Test at the 5%
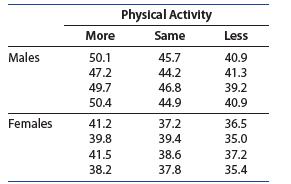
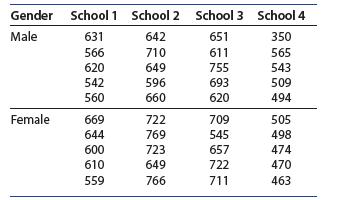
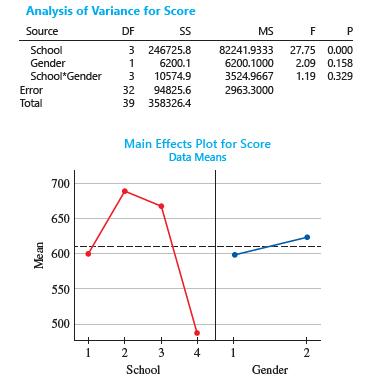
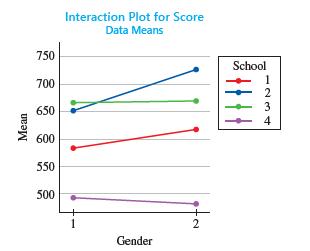
15. Fourth-Grade Test Scores A school board compared test scores on a standardized reading test for fourth-grade students in their district, selecting a random sample of five male and five female fourth-grade students at each of four different elementary schools in the district and recording the
14. Terrain Visualization A study was conducted to determine the effect of two factors on terrain visualization training for soldiers.5 The two factors investigated in the experiment were the participants’ spatial abilities(abilities to visualize in three dimensions) and the viewing
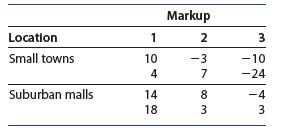
13. Demand for Diamonds A chain of jewelry stores investigated the effect of price markup and location on the demand for its diamonds, selecting six small-town stores, as well as six stores located in large suburban malls. Two stores in each of these locations were assigned to each of three item
Use the computing formulas to calculate the sums of squares and mean squares for the experiments described Enter these results into the appropriate ANOVA table and use them to find the F statistics used to test for a significant interaction between factors A and B. If the interaction is not
Use the computing formulas to calculate the sums of squares and mean squares for the experiments described Enter these results into the appropriate ANOVA table and use them to find the F statistics used to test for a significant interaction between factors A and B. If the interaction is not
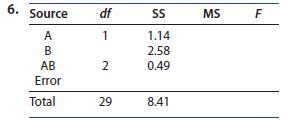
Partially completed ANOVA tables are shown in Exercises 6. Fill in the blanks. Then test for a significant interaction between factors A and B using =.05. Give the approximate p-value for the test. If the interaction is not significant, test to see whether factors A or B have a significant
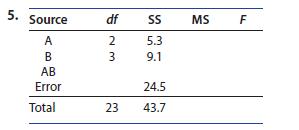
Partially completed ANOVA tables are shown in Exercises 5. Fill in the blanks. Then test for a significant interaction between factors A and B using =.05. Give the approximate p-value for the test. If the interaction is not significant, test to see whether factors A or B have a significant
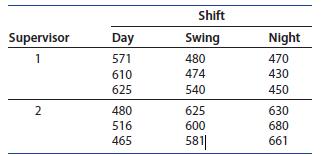
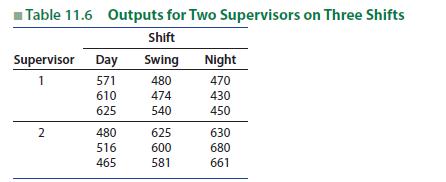
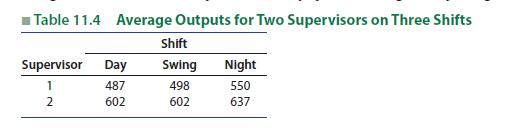
Table 11.6 shows the original data used to generate Table 11.5 in Example 11.12. That is, the two supervisors were each observed on three randomly selected days for each of the three different shifts, and the production outputs were recorded. Analyze these data using the appropriate analysis of
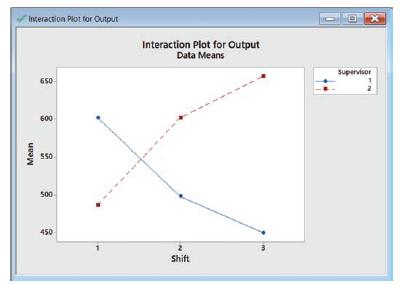
The manager of a manufacturing plant knows that the output of a production line depends on two factors:• Which of two supervisors is in charge of the line• Which of three shifts—day, swing, or night—is being measured The manager suspects that the two supervisors may work differently
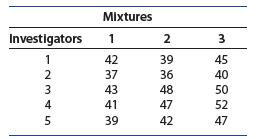
26. Rocket Propellants An experiment was conducted to compare three mixtures of components in making rocket propellant. Five samples of each mixture were obtained for testing. Five investigators measured the propellant thrust in pounds for each of the mixtures, with the mixtures presented in random
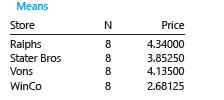
25. Where to Shop?, continued Refer to Exercise 24.The printout that follows provides the average costs of the selected items for the k=4 storesa. What is the appropriate value of q (k, df ) .05 for testing for differences among stores?b. What is the value of c. Use Tukey’s pairwise comparison
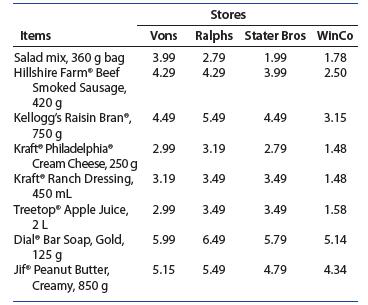
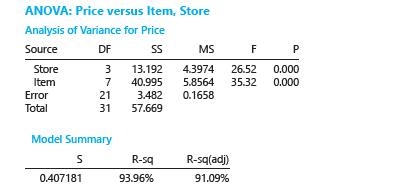
24. Where to Shop? Do you shop at the grocery store closest to home or do you look for the store that has the best prices? We compared the regular prices at four different grocery stores for eight items purchased on the same day.a. What are the blocks and treatments in this experiment?b. Do the
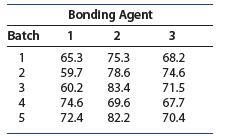
23. Bonding Alloys An engineer ran an experiment to assess the breaking pressure of three bonding agents for an alloy material. Five batches of the alloy material were available for the experiment.The three agents were used for bonding components of the alloy material from each of the five
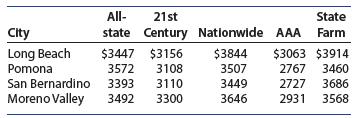
22. Premium Equity? The cost of auto insurance varies by coverage, location, and the driving record of the driver. The following are estimates of the annual cost for standard coverage as of January 19, 2018 for a male driver with 6–8 years of experience, driving a Honda Accord 12,600–15,000
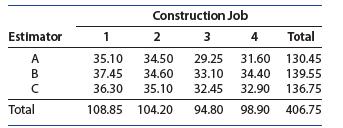
21. Bidding on Construction Jobs A building contractor wants to compare the bids of three construction engineers, A, B, and C, to determine whether one tends to be a more conservative(or liberal) estimator than the others. The contractor selects four projected construction jobs and has each
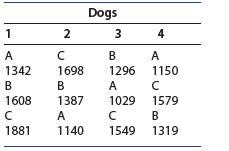
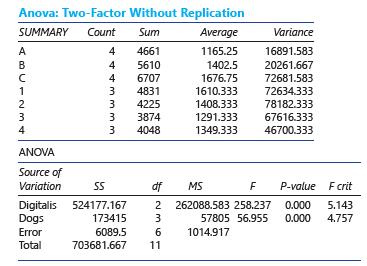
20. Digitalis and Calcium Uptake A study was conducted to compare the effects of three levels of digitalis on the levels of calcium in the heart muscles of dogs. Because calcium uptake varies from one animal to another, the calcium uptakes for the three levels of digitalis, A, B, and C
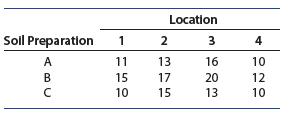
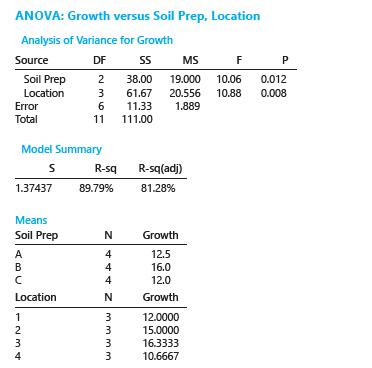
19. Slash Pine Seedlings An experiment was conducted to determine the effects of three methods of soil preparation—A (no preparation), B (light fertilization), and C (burning)—on the first-year growth of slash pine seedlings. Four locations were selected, and each location was divided into
18. Glare in Rearview Mirrors To compare the glare characteristics of four types of automobile rearview mirrors, 40 drivers were exposed to the glare produced by a headlight located 30 feet behind the rear window of the test automobile. Each driver then rated the glare on a scale of 1 (low) to 10
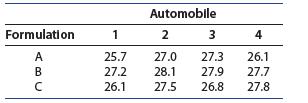
17. Gas Mileage A study was conducted to compare automobile gasoline mileage for three formulations of gasoline. Four automobiles, all of the same make and model, were used, and each formulation was tested in each automobile, thus eliminating automobile-to-automobile variability. The data (in miles
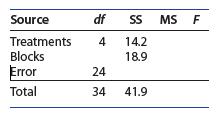
16. Do the data present sufficient evidence to indicate differences among the block means? Test using a=.05.A partially completed ANOVA table for a randomized block design is shown here. Fill in the blanks in the table and use it to answer Source df SS MS F Treatments 4 14.2 Blocks 18.9 Error 24
15. Do the data present sufficient evidence to indicate differences among the treatment means? Test using a =.05.A partially completed ANOVA table for a randomized block design is shown here. Fill in the blanks in the table and use it to answer Source df SS MS F Treatments 4 14.2 Blocks 18.9 Error
14. How many observations are in each block total?A partially completed ANOVA table for a randomized block design is shown here. Fill in the blanks in the table and use it to answer Source df SS MS F Treatments 4 14.2 Blocks 18.9 Error 24 Total 34 41.9
13. How many observations are in each treatment total?A partially completed ANOVA table for a randomized block design is shown here. Fill in the blanks in the table and use it to answer Source df SS MS F Treatments 4 14.2 Blocks 18.9 Error 24 Total 34 41.9
12. How many blocks are involved in the design?A partially completed ANOVA table for a randomized block design is shown here. Fill in the blanks in the table and use it to answer Source df SS MS F Treatments 4 14.2 Blocks 18.9 Error 24 Total 34 41.9
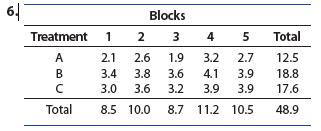
Use the computing formulas to calculate the sums of squares and mean squares for the experiments described . Enter these results into the appropriate ANOVA table and use them to find the F statistics used to test for differences among treatment and block means. Blocks Treatment 1 2 3 4 5 Total A
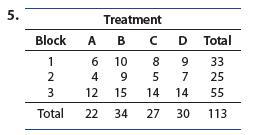
Use the computing formulas to calculate the sums of squares and mean squares for the experiments described . Enter these results into the appropriate ANOVA table and use them to find the F statistics used to test for differences among treatment and block means. 5. Block Treatment A B C D Total 1 6
The cell phone industry is involved in a fierce battle for customers, with each company devising its own complex pricing plan to lure customers. Since the cost of a cell phone minute varies drastically depending on the number of minutes per month used by the customer, a consumer watchdog group
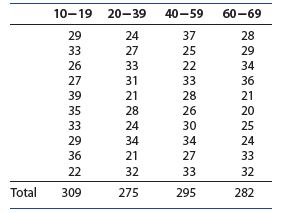
18. Heart Rate and Exercise How does exercise affect your heart rate? Ten male subjects were randomly selected from four age groups:10–19, 20–39, 40–59, and 60–69. Each subject walked on a treadmill at a fixed grade for a period of 12 minutes, and the increase in heart rate, the difference
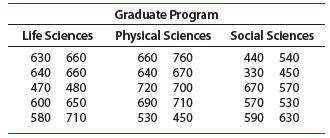
17. GRE Scores The quantitative reasoning scores on the Graduate Record Examination (GRE)3 were recorded for students admitted to three different graduate programs at a local universitya. Do these data provide sufficient evidence to indicate a difference in the mean GRE scores for applicants
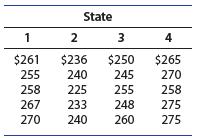
16. The Cost of Lumber, continued The analysis of variance F-test in Exercise 15 (Section 11.2) indicated that there was a difference in the average cost of lumber for the four states. The following information from that exercise is given in the table:Use Tukey’s method for paired comparisons to
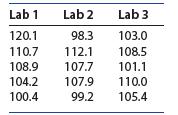
15. Glucose Tolerance Physicians depend on laboratory test results when managing medical problems such as diabetes or epilepsy. In a test for glucose tolerance, three different laboratories were each sent nt 55 identical blood samples from a person who had drunk 50 milligrams (mg) of glucose
14. Calcium, again Refer to Exercise 13 (Section 11.2), where the calcium content of a powdered mineral substance was analyzed using three different methods. The comparisons option in MINITAB provided the printout that follows.Use Tukey’s method to compare the three population means. How would
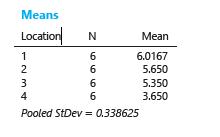
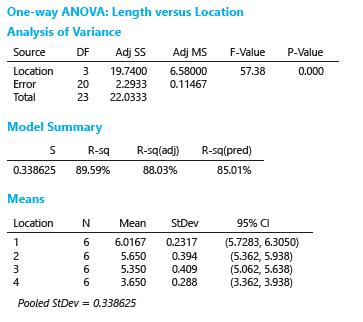
13. Swampy Sites, again Refer to Exercise 11(Section 11.2). Use Tukey’s procedure and the following MINITAB printout to rank the mean leaf growth for the four locations with a =.01 Means Location 1234 4 N 6996 N Mean 6.0167 5.650 5.350 3.650 Pooled StDev = 0.338625
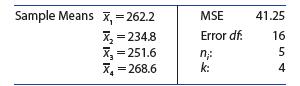
A completely randomized design was used to compare the means of six treatments based on samples of four observations per treatment. The pooled estimator for 2 s is 2 s 59.12. Use this information along with the following sample means to answer12. Rank the treatment means using pairwise
A completely randomized design was used to compare the means of six treatments based on samples of four observations per treatment. The pooled estimator for 2 s is 2 s 59.12. Use this information along with the following sample means to answer11. Provide the critical value you would use to make
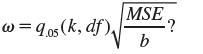
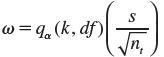
If the sample size for each treatment is nt and 2 s 58.0 is based on k(n 21) t degrees of freedom, find using the information w=qa (k, df) S In.
If the sample size for each treatment is nt and 2 s 58.0 is based on k(n 21) t degrees of freedom, find using the information w=qa (k, df) S In.
If the sample size for each treatment is nt and 2 s 58.0 is based on k(n 21) t degrees of freedom, find using the information w=qa (k, df) S In.
Find the tabled values of qa (k, df ) using the information given 7. a .01, k 3, df = 15
Find the tabled values of qa (k, df ) using the information given 5. a .01, k=6, df = 24
Find the tabled values of qa (k, df ) using the information given 6. a .05, k=4, df = 12
Find the tabled values of qa (k, df ) using the information given 4. a .01, k=4, df = 8
Find the tabled values of qa (k, df ) using the information given 3. a .05, k=3, df = 9
Find the tabled values of qa (k, df ) using the information given 2. a=.05, k=5, df = 10
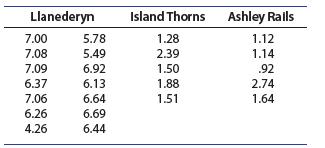
17. Pottery in the United Kingdom Twenty-six samples of Romano-British pottery were found at four different kiln sites in the United Kingdom.2 Since one site only yielded two samples, consider the samples found at the other three sites. The samples were analyzed to determine their chemical
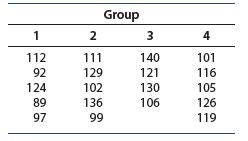
16. Good at Math? Twenty third graders were randomly separated into four equal groups, and each group was taught a math concept using a different teaching method. At the end of the teaching period, progress was measured by a unit test. The scores are shown below (one child in group 3 was absent on
15. The Cost of Lumber A builder wants to compare the prices per 1000 board meters of standard or better grade framing lumber. He randomly selects five suppliers in each of the four states where he is planning to begin construction. The prices are given in the tablea. What type of experimental
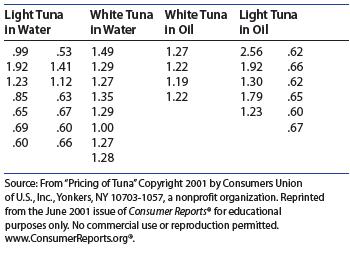
14. Tuna Fish The estimated average prices for a variety of brands of tuna fish, based on prices paid nationally, are shown herea. Construct the ANOVA table for a completely randomized design.b. Is there evidence of a significant difference in average price for these packages at the a 5.05 level of
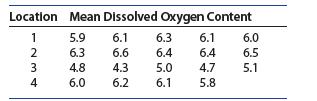
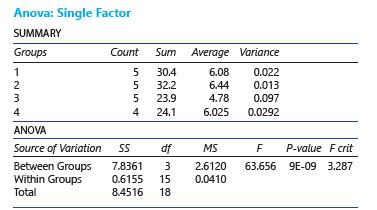
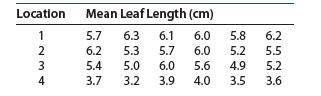
12. Dissolved O2 Content Water samples were taken at four different locations in a river to determine whether the quantity of dissolved oxygen, a measure of water pollution, varied from one location to another. Locations 1 and 2 were selected above an industrial plant, one near the shore and the
11. Swampy Sites A study to compare the rates of growth of vegetation at four swampy undeveloped sites involved measuring the leaf lengths of a particular plant species on a preselected date. Six plants were randomly selected at each of the four sites and the mean leaf length per plant (in
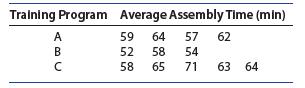
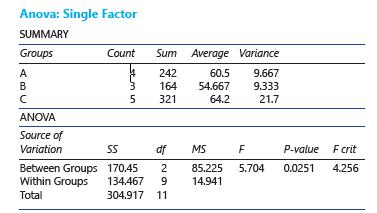
10. Assembling Electronic Equipment An experiment was conducted to compare the effectiveness of three training programs, A, B, and C, for assemblers of a piece of electronic equipment. Five employees were randomly assigned to each of three programs. After completion of the program, each person
8. Reducing Hostility A psychologist wants to compare three methods for reducing hostility levels in university students. Eleven students were judged to have “great hostility,” based on a certain psychological test (HLT). These students were then randomly divided into three groups—five were
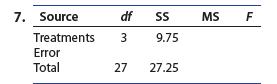
A partially completed ANOVA table is shown in Exercise 7. Fill in the blanks. Then test for a significant difference in the treatment means using a =.01.Bound the p-value and state your conclusions. 7. Source df SS MS F Treatments Error 3 9.75 Total 27 27.25
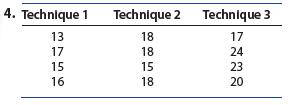
Construct an ANOVA table for these one-way classifications.Provide a formal test of : ... 0 1 2 H k m 5m 5 5m including the rejection region with a 5.05. Bound the p-value for the test and state your conclusions. 4. Technique 1 Technique 2 Technique 3 17 18 18 17 24 7222 0000 L 00 3756 15 16 18 23
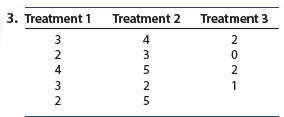
Construct an ANOVA table for these one-way classifications.Provide a formal test of : ... 0 1 2 H k m 5m 5 5m including the rejection region with a 5.05. Bound the p-value for the test and state your conclusions. 3. Treatment 1 Treatment 2 Treatment 3 3 0 202T 1 43525 32432
In an experiment to determine the effect of nutrition on the attention spans of elementary school students, a group of 15 students were randomly assigned to each of three meal plans: no breakfast, light breakfast, and full breakfast. Their attention spans (in minutes) were recorded during a morning
14. An Alternative Test Procedure Consider the following approach as an alternative to using the F-test for investigating differences among four treatment means.Examine the data and select the largest and smallest treatment means and then use a Student’s t-test to compare these two means. If
16. Management Training To investigate the effect of management training on decision-making abilities, sixteen supervisors were selected, and eight were randomly chosen to receive managerial training. Four trained and four untrained supervisors were then randomly selected to function in a situation
Calculate the means for each of the ab factor-combinations in Exercises 10. Then use the means to construct an interaction plot, similar to the one in Figure 11.12. What does the interaction plot tell you about the interaction between factors A and B? Does this confirm the results of the test for a
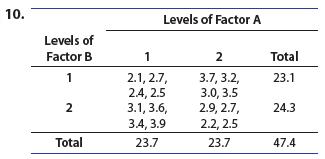
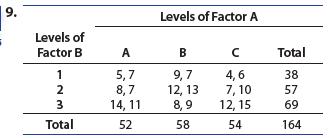
Calculate the means for each of the ab factor-combinations in Exercises 9. Then use the means to construct an interaction plot, similar to the one in Figure 11.12. What does the interaction plot tell you about the interaction between factors A and B? Does this confirm the results of the test for a
8. Refer to Exercise 6. The mean of all observations at the factor levels A1 and A2 are x 53.7 1 and x 51.4 2 , respectively. Find a 95% confidence interval for the difference in mean response for factor levels A1 and A2
7. Refer to Exercise 5. The means of two of the factorlevel combinations—say, A B 1 1 and A B 2 1—are 8.3 1 x 5 and 6.3 2 x 5 , respectively. Find a 95% confidence interval for the difference in the mean response for factorlevel combinations A B 1 1 and A B 2 1.
construct an ANOVA table showing the sources of variation and their respective degrees of freedom. 4. A two-factor factorial experiment with factor A at two levels and factor B at three levels, with five replications per treatment
construct an ANOVA table showing the sources of variation and their respective degrees of freedom. 3. A two-factor factorial experiment with factor A at four levels and factor B at two levels, with r replications per treatment.
construct an ANOVA table showing the sources of variation and their respective degrees of freedom. 2. A two-factor factorial experiment with factor A at four levels and factor B at five levels, with three replications per treatment
1. Explain what is meant by an interaction in a factorial experiment.
Consider two drugs that are used to control high blood pressure. Either drug, when the other drug is not being used, may cause a person’s blood pressure to drop as expected. However, if one drug is used when the other drug is already in a person’s system, there could be a drug interaction—the
A randomized block design has k53 treatments, b56 blocks, with SST 511.4, SSB517.1, and Total SS542.7. T A 521.9 and T B 524.2. Construct an ANOVA table showing all sums of squares, mean squares, and pertinent F-values 11. Do the data provide sufficient evidence to indicate that blocking was
A randomized block design has k53 treatments, b56 blocks, with SST 511.4, SSB517.1, and Total SS542.7. T A 521.9 and T B 524.2. Construct an ANOVA table showing all sums of squares, mean squares, and pertinent F-values 10. Find a 95% confidence interval for the difference between A m and B m .
A randomized block design has k53 treatments, b56 blocks, with SST 511.4, SSB517.1, and Total SS542.7. T A 521.9 and T B 524.2. Construct an ANOVA table showing all sums of squares, mean squares, and pertinent F-values 9. Do the data provide sufficient evidence to indicate differences among the
Test for a significant difference in the treatment and block means using 5 .01. Bound the p-value for the test of equality of treatment means. If a difference exists among the treatment means, use Tukey’s test with 5 .01 to identify where the differences lie. Summarize your results. 8.
Showing 2200 - 2300
of 6613
First
16
17
18
19
20
21
22
23
24
25
26
27
28
29
30
Last
Step by Step Answers