New Semester
Started
Get
50% OFF
Study Help!
--h --m --s
Claim Now
Question Answers
Textbooks
Find textbooks, questions and answers
Oops, something went wrong!
Change your search query and then try again
S
Books
FREE
Study Help
Expert Questions
Accounting
General Management
Mathematics
Finance
Organizational Behaviour
Law
Physics
Operating System
Management Leadership
Sociology
Programming
Marketing
Database
Computer Network
Economics
Textbooks Solutions
Accounting
Managerial Accounting
Management Leadership
Cost Accounting
Statistics
Business Law
Corporate Finance
Finance
Economics
Auditing
Tutors
Online Tutors
Find a Tutor
Hire a Tutor
Become a Tutor
AI Tutor
AI Study Planner
NEW
Sell Books
Search
Search
Sign In
Register
study help
business
statistics alive
Introduction To Probability And Statistics 15th Edition William Mendenhall Iii , Robert Beaver , Barbara Beaver - Solutions
calculate the sample variance, s2. Construct a 95% confidence interval for the population variance, σ2 . Test the given hypothesis using a =.05. 9. n = 7: 1.4, 3.6, 1.7, 2.0, 3.3, 2.8, 2.9 to test H: 02.8 versus H: 0.8.
Use the information given to bound the p-value of the F statistic for a one-tailed test with the indicated degrees of freedom 11. F 2.85, df = 8, df =16
1. Under what assumptions can the F distribution be used in making inferences about the ratio of the population variances?
Find the tabled value for an F variable based on n1 - 1 numerator degrees of freedom, n2 - 1 denominator degrees of freedom with an area of a to its right. 2. n, 3, n, 8, a = .050 =3, =
Find the tabled value for an F variable based on n1 - 1 numerator degrees of freedom, n2 - 1 denominator degrees of freedom with an area of a to its right. 3. n, 7, n=5, a = .010
Find the tabled value for an F variable based on n1 - 1 numerator degrees of freedom, n2 - 1 denominator degrees of freedom with an area of a to its right. == 4. n, 13, n, 14, a=.100
Find the tabled value for an F variable based on n1 - 1 numerator degrees of freedom, n2 - 1 denominator degrees of freedom with an area of a to its right. 5. n, 16, n, 19, a = .005 =19,
Find the tabled value for an F variable based on n1 - 1 numerator degrees of freedom, n2 - 1 denominator degrees of freedom with an area of a to its right. 6. n =25, n=26, a = .050
Find the tabled value for an F variable based on n1 - 1 numerator degrees of freedom, n2 - 1 denominator degrees of freedom with an area of a to its right. 7. n, 10, n, 10, a = .025 "
Use the information given to bound the p-value of the F statistic for a one-tailed test with the indicated degrees of freedom 8. F=8.36, df = 5, df =4
Use the information given to bound the p-value of the F statistic for a one-tailed test with the indicated degrees of freedom 9. F 6.16, df = 4, df = 13
Use the information given to bound the p-value of the F statistic for a one-tailed test with the indicated degrees of freedom 10. F 1.62, df = 15, df = 25
The variability in the amount of impurities in a batch of chemical depends on the length of its process time. A manufacturer using two production lines, 1 and 2, has made a slight adjustment to line 2, hoping to reduce the variability in the amount of impurities. Samples of 25 1 n 5 and 25 2 n 5
An experimenter is concerned that the variability of responses using two different procedures may not be the same. Before conducting his research, he conducts a prestudy with random samples of 10 and 8 responses and records 7.14 1 s2 5 and 3.21 2 s2 5 , respectively. Do the sample variances present
calculate the sample variance, s2. Construct a 95% confidence interval for the population variance, σ2 . Test the given hypothesis using a =.05. 10. n 10: 18.9, 9.7, 12.0, 8.7, 10.6, 8.9, 7.2, 12.4, 14.9, 12.4 to test H: = 9 versus H: > 9.
11. Cerebral Blood Flow Cerebral blood flow (CBF)in the brains of healthy people is normally distributed with a mean of 74. A random sample of 25 stroke patients resulted in an average CBF of 69.7 with a standard deviation of 16.0.a. Test the hypothesis that the standard deviation of CBF
12. A Precise Quarterback The number of passes completed and the total number of passing yards recorded for the Los Angeles Chargers quarterback, Philip Rivers for each of the 15 regular season games that he played in the fall of 201713 were used to calculate the average number of yards per pass
13. Instrument Precision A precision instrument is guaranteed to read accurately to within 2 units. A sample of four instrument readings on the same object yielded the measurements 353, 351, 351, and 355.a. Test the null hypothesis that 5.7 against the alternative ..7. Use a 5.05.b. Find a
14. Pollution Control The EPA limit on the allowable discharge of suspended solids into rivers and streams is 60 milligrams per liter (mg/L) per day. A study of water samples selected from the discharge at a phosphate mine shows that over a long period, the mean daily discharge of suspended solids
15. Drug Potency To properly treat patients, drugs prescribed by physicians must have not only a mean potency value as specified on the drug’s container, but also small variation in potency values. A drug manufacturer claims that his drug has a potency of 56 .1 milligram per cubic centimeter
16. Drug Potency, continued Refer to Exercise 15.Testing of 60 additional randomly selected containers of the drug gave a sample mean and variance equal to 5.04 and .0063 (for the total of n564 containers). Using a 95% confidence interval, estimate the variance of the manufacturer’s potency
17. Hard Hats A manufacturer of hard safety hats for construction workers wants the mean force transmitted by helmets to be 3200 newtons (or less), well under the legal 4000-newton limit, and to be less than 160. A random sample of n540 helmets was tested, and the sample mean and variance were
18. Hard Hats, continued Refer to Exercise 17. Do the data provide sufficient evidence to indicate that exceeds 160?
19. Light Bulbs A manufacturer of industrial light bulbs wants the bulbs to have a mean length of life that is acceptable to its customers and a variation in length of life that is relatively small. A sample of 20 bulbs tested produced the following lengths of life (in hours):2100 2302 1951 2067
Check your ability to use Table 6 in Appendix I by verifying the following statements:1. The value of F with area .05 to its right for 6 1 df 5 and df 59 is 3.37 2 .2. The value of F with area .05 to its right for 5 1 df 5 and df 510 is 3.33 2 .3. The value of F with area .01 to its right for 6 1
15. Lead Levels in Drinking Water Analyses of drinking water samples for 100 homes in each of two different sections of a city gave the following information on lead levels (in parts per million):a. Calculate the test statistic and its p-value to test for a difference in the two population means.
29. What’s Normal? What is normal, when it comes to people’s body temperatures? A random sample of 130 human body temperatures, provided by Allen Shoemaker4 in the Journal of Statistical Education, had a mean of 98.258F and a standard deviation of 0.738F. Does the data indicate that the average
28. Biomass Studies indicate that the biomass for tropical woodlands, thought to be about 35 kilograms per square meter (kg/m2 ), may in fact be too high and that tropical biomass values vary regionally—from about 5 to 55 kg/m2 .3 Suppose you measure the tropical biomass in 400 randomly selected
27. Acidity in Rainfall Refer to Exercise 30 (Section 8.3)and the collection of water samples to estimate the mean acidity (in pH) of rainfalls. Remember that the pH for pure rain falling through clean air is approximately 5.7.The sample of n540 rainfalls produced pH readings with x 53.7 and s5.5.
26. Flextime A company wants to implement a flextime schedule so that workers can schedule their own work hours, but it needs a minimum mean of 7 hours per day per assembly worker in order to operate effectively.A random sample of 80 workers was asked to submit a tentative flextime schedule. If the
25. Potency of an Antibiotic A drug manufacturer claimed that the mean potency of one of its antibiotics was 80%. A random sample of n5100 capsules was tested and produced a sample mean of x 579.7% with a standard deviation of s5.8%. Do the data present sufficient evidence to refute the
24. O Baby! The weights of 3-month-old baby girls are known to have a mean of 5.86 kilograms.2 Doctors at an inner city pediatric facility suspect that the average weight of 3-month-old baby girls at their facility may be less than 5.86 kilograms. They select a random sample of 40 3-month-old baby
23. Hamburger Meat Ground beef is packaged in small trays, intended to hold 1 pound of meat. A random sample of 35 packages in the small tray produced weight measurements with an average of 1.01 pounds and a standard deviation of .18 pound.a. If you were the quality control manager and wanted to
22. Airline Occupancy Rates Suppose a scheduled airline flight must average at least 60% occupancy in order to be profitable. Occupancy rates were recorded daily for a regularly scheduled flight on each of 120 days, showing a mean occupancy per flight of 58%and a standard deviation of 11%.a. If m
A random sample of n535 observations from a quantitative population produced a mean x 52.4 and a standard deviation of s5.29. Your research objective is to show that the population mean m exceeds 2.3. 20. Use the results for b in Exercises 18–19 to graph the power curve for the test.
A random sample of n535 observations from a quantitative population produced a mean x 52.4 and a standard deviation of s5.29. Your research objective is to show that the population mean m exceeds 2.3. 19. Repeat the calculation of for = 2.3, 2.5, and 2.6.
A random sample of n535 observations from a quantitative population produced a mean x 52.4 and a standard deviation of s5.29. Your research objective is to show that the population mean m exceeds 2.3. 18. Calculate = P(accept H, when = 2.4).
A random sample of n535 observations from a quantitative population produced a mean x 52.4 and a standard deviation of s5.29. Your research objective is to show that the population mean m exceeds 2.3. 17. Calculate the p-value for the test statistic in Exercise 16.
A random sample of n535 observations from a quantitative population produced a mean x 52.4 and a standard deviation of s5.29. Your research objective is to show that the population mean m exceeds 2.3. 16. Do the data provide sufficient evidence to conclude that m > 2.3?
A random sample of n535 observations from a quantitative population produced a mean x 52.4 and a standard deviation of s5.29. Your research objective is to show that the population mean m exceeds 2.3. 15. Locate the rejection region for the test using a 5%significance level.
30. Sports and Achilles Tendon Injuries Some sports that involve a significant amount of running, jumping, or hopping put participants at risk for Achilles tendon injuries. A study in The American Journal of Sports Medicine looked at the diameter (in mm) of the injured tendons for patients who
31. Hybrid or EV? In an attempt to reduce their carbon footprint, many consumers are purchasing hybrid, plug-in hybrid, or electric cars. Consumer Reports ranks the Chevrolet Bolt first among electric cars, with an EPA rating of 238 miles between battery charges, although others report a range
To determine whether car ownership affects a student’s academic achievement, random samples of 100 car owners and 100 nonowners were drawn from the student body. The grade point average for the 100 1 n 5 nonowners had an average and variance equal to 2.70 1 x 5 and .36, 1 s2 5 while 2.54 2 x 5
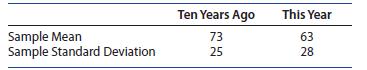
14. Healthy Eating Has the consumption of red meat decreased over the last 10 years? A researcher selected hospital nutrition records for 400 subjects surveyed 10 years ago and compared the average amount of beef consumed per year to amounts consumed by an equal number of subjects interviewed this
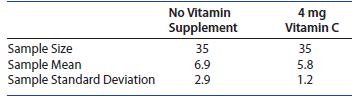
13. Cure for the Common Cold? An experiment was planned to compare the mean time (in days) to recover from a common cold for people given a daily dose of 4 milligrams (mg) of vitamin C versus those who were not.Suppose that 35 adults were randomly selected for each treatment category and that the
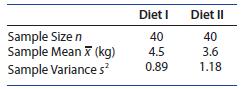
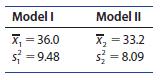
12. Losing Weight In a comparison of the mean 1-month weight losses for women aged 20–30 years, these sample data were obtained for each of two diets:Do the data provide sufficient evidence to indicate that diet I produces a greater mean weight loss than diet II?Use a 5.05. Diet I Diet II Sample
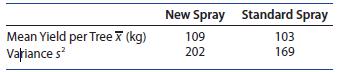
11. Spraying Fruit Trees A fruit grower wants to test a new spray that a manufacturer claims will reduce the loss due to insect damage. To test the claim, the grower sprays 200 trees with the new spray and 200 other trees with the standard spray. The following data were recorded:a. Do the data
10. Put on the Brakes The braking ability was compared for two 2018 automobile models. Random samples of 64 automobiles were tested for each type. The recorded measurement was the distance (in meters) required to stop when the brakes were applied at 80 kilometers per hour.These are the computed
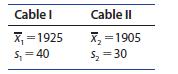
9. Breaking Strengths of Cables A test of the breaking strengths of two different types of cables was conducted using samples of 100 1 2 n 5n 5 pieces of each type of cable.Do the data provide sufficient evidence to indicate a difference between the mean breaking strengths of the two cables? Use a
8. Using the p-value approach for the data in Exercise 6, is there sufficient evidence to show that 1 m is larger than 2 m at the 1% level of significance? Is this result consistent with the results from Exercise 6?
7. Using the p-value approach for the data in Exercise 5, is there sufficient evidence to show that 1 m is larger than 2 m at the 1% level of significance? Is this result consistent with the results from Exercise 5?
More Hypothesis Tests Independent random samples were selected from two quantitative populations, with sample data given . If your research objective is to show that 1 m is larger than 2 m , use the 9.3 Exercises critical value approach to test the appropriate hypothesis with a 5.01. 6. 35, n, 45,
More Hypothesis Tests Independent random samples were selected from two quantitative populations, with sample data given . If your research objective is to show that 1 m is larger than 2 m , use the 9.3 Exercises critical value approach to test the appropriate hypothesis with a 5.01. 5. nn, 50,
4. Calculate the p-value for the data in Exercise 2.Use the p-value to test for a significant difference in the population means at the 5% significance level.
3. Calculate the p-value for the data in Exercise 1.Use the p-value to test for a significant difference in the population means at the 5% significance level.
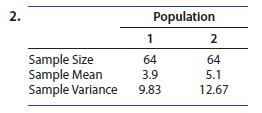
Independent random samples were selected from two quantitative populations, with sample sizes, means, and variances given State the null and alternative hypotheses used to test for a difference in the two population means. Calculate the necessary test statistic, the rejection region with a 5 .05,
Independent random samples were selected from two quantitative populations, with sample sizes, means, and variances given State the null and alternative hypotheses used to test for a difference in the two population means. Calculate the necessary test statistic, the rejection region with a 5 .05,
Construct a 95% confidence interval for the difference in average academic achievements between car owners and nonowners. Using the confidence interval, can you conclude that there is a difference in the population means for the two groups of students?
A random sample of n535 observations from a quantitative population produced a mean x 52.4 and a standard deviation of s5.29. Your research objective is to show that the population mean m exceeds 2.3. 14. Give the null and alternative hypotheses for the test.
Find the p-values for the z-tests and determine the significance of the results. 13. A left-tailed test with observed z=-1.81
14. Calculate the value of the z-statistic based on the sample mean, x . Is this an unusual value of z? It is reported1 that the average or mean number of Facebook friends is 155. Suppose that when 50 randomly chosen Facebook users are polled regarding the number of their friends, the average
13. If we were looking to dispute the reported average of 155, how would you express 0 H and a H ? It is reported1 that the average or mean number of Facebook friends is 155. Suppose that when 50 randomly chosen Facebook users are polled regarding the number of their friends, the average number of
12. What is the probability of observing a value of z53.51 or greater if 0 H is true? What might you conclude? A new variety of pearl millet is expected to provide an increased yield over the variety presently in use which is about 70 bushels per acre. The new variety of millet produced an average
11. Find the value of the test statistic for testing the hypotheses that the new variety will increase yield. Is the value of the test statistic likely, assuming 0 H is true? A new variety of pearl millet is expected to provide an increased yield over the variety presently in use which is about 70
10. A seed wash is expected to change the proportion p of seeds that germinate when planted in poorlydraining soil. Suppose that the current germination rate is about 80%. state the null and alternative hypotheses to be tested.
9. The new tax structure is supposed to help small businesses survive. Suppose we know that presently 20% of all small businesses fail in their first year. state the null and alternative hypotheses to be tested.
8. A new variety of pearl millet is expected to provide an increased yield over the variety presently in use, which has a mean yield of about 70 bushels per acre. state the null and alternative hypotheses to be tested.
7. A researcher wishes to show that a modified treatment decreases the mean time to recovery m, which is currently 5 days. state the null and alternative hypotheses to be tested.
6. A researcher claims that a binomial proportion p is at least 0.8. A statistical test is designed to disprove the researcher’s claim. state the null hypothesis, H0, and the alternative hypothesis, Ha , to be tested.
5. A statistical test is designed to show that the mean m is different from 100. state the null hypothesis, H0, and the alternative hypothesis, Ha , to be tested.
4. A statistical test is designed to show that the proportion p of defectives has decreased below 0.5%. state the null hypothesis, H0, and the alternative hypothesis, Ha , to be tested.
3. A statistical test is designed to show that the mean m is greater than 3.state the null hypothesis, H0, and the alternative hypothesis, Ha , to be tested.
2. Define the level of significance
1. List the five parts of a statistical test.
A die cutting process for sheet metal currently produces an average of 3% defectives. You are interested in showing that a simple adjustment on a machine will decrease p, the proportion of defectives produced in the die cutting process. Thus, the alternative hypothesis is H : p , .03 a and the null
15. What is the probability of observing a value of z greater than 1.43 or less than 21.43? What might you conclude about the average number of Facebook friends? It is reported1 that the average or mean number of Facebook friends is 155. Suppose that when 50 randomly chosen Facebook users are
The average weekly earnings for female social workers is $670. Do men in the same positions have average weekly earnings that are higher than those for women? A random sample of n540 male social workers showed x 5$725 and s5$102. Test the appropriate hypothesis using a 5.01.
The daily yield for a local chemical plant has averaged 880 tons for the last several years.The quality control manager would like to know whether this average has changed in recent months. She randomly selects 50 days from the computer database and calculates the average and standard deviation of
Find the p-values for the z-tests and determine the significance of the results. 12. A two-tailed test with observed z=-2.78.
Find the p-values for the z-tests and determine the significance of the results. 11. A right-tailed test with observed z=1.15.
For the situations described find the appropriate rejection regions and state your conclusion if the observed test statistic was z522.41. If appropriate, provide a measure of reliability for your conclusion. 10. A two-tailed test with a =.02.
For the situations described find the appropriate rejection regions and state your conclusion if the observed test statistic was z522.41. If appropriate, provide a measure of reliability for your conclusion. 9. A left-tailed test with a =.05.
For the situations described find the appropriate rejection regions and state your conclusion if the observed test statistic was z522.41. If appropriate, provide a measure of reliability for your conclusion. 8. A left-tailed test with a =.01.
Find the appropriate rejection regions and state your conclusion if the observed test statistic was z=-.16.If appropriate, provide a measure of reliability for your conclusion 7. A two-tailed test with a =.05
Find the appropriate rejection regions and state your conclusion if the observed test statistic was z=-.16.If appropriate, provide a measure of reliability for your conclusion 6. A right-tailed test with a =.01.
5. What is the power of a test and how is it related to b?
4. What is the p-value for a test of hypothesis?
3. For a fixed value of , what is the effect on b when the sample size is increased?
2. For a fixed sample size n, what is the effect on b when is decreased?
1. Define and b for a statistical test of hypothesis.
Refer to Example 9.5. Calculate b and the power of the test (12b) when m is actually equal to 870 tons.
Standards set by government agencies indicate that Americans should not exceed an average daily sodium intake of 3300 milligrams (mg). To find out whether Americans are exceeding this limit, a sample of 100 Americans is selected, and the mean and standard deviation of daily sodium intake are found
Refer to Example 9.5. The quality control manager wants to know whether the daily yield at a local chemical plant—which has averaged 880 tons for the last several years—has changed in recent months. A random sample of 50 days gives an average yield of 871 tons with a standard deviation of 21
You wish to show that the average hourly wage of electricians in the state of California is different from $21, which is the national average. This is the alternative hypothesis, written as H :m ?21 a The null hypothesis is H :m521 0 You would like to reject the null hypothesis, thus concluding
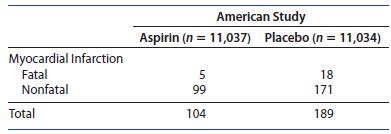
3. Can you think of some possible reasons why the results of these two studies, which were alike in some respects, produced such different conclusions? On Wednesday, January 27, 1988, the front page of the New York Times read, “Heart attack risk found to be cut by taking aspirin: Lifesaving
1. Bass Fishing The pH factor is a measure of the acidity or alkalinity of water. A fishing expert states that the best chance of catching bass occurs when the pH of the water is between 7.5 and 7.9.22 Suppose you suspect that acid rain is lowering the pH of your favorite fishing spot and you wish
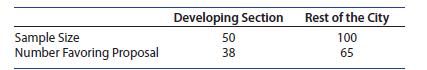
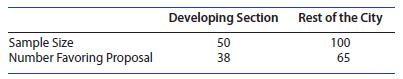
Use the data from Example 8.11 involving citizens opinions about a bond proposal, reproduced as follows. Is there evidence of a difference in the proportions favoring the proposal for the two sections of the city?1. Select stat ➤ TESTS ➤ 6:2-PropZTest… Enter the values for n1, n2, x1, and x2
Use the data from Example 8.11 involving citizens opinions about a bond proposal, reproduced here.Suppose that the citizens in the developing section of the city have no opinion about this proposal, so that they are equally likely to favor as oppose the proposal. Test : .5 0 H p5 against : .5 a H
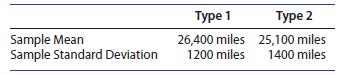
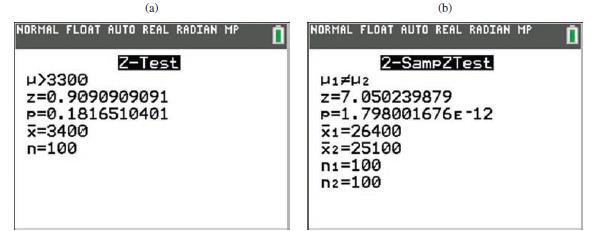
The tire wear of n1 5 n2 5 100 tires of two types in Example 8.9 had sample means and standard deviations shown in the table. Is there evidence of a difference in the tire wear for the two types of tires?1. Select stat ➤ TESTS ➤ 3:2-SampZTest… Select Stats in the “Inpt:” line, and enter
The random sample of n 5 100 Americans in Example 9.7 had an average of 3400 mg of sodium per day, with a sample standard deviation of 1100 mg. Does this provide sufficient evidence to indicate that the average daily sodium intake for Americans is more than 3300?1. Select stat ➤ TESTS ➤
Showing 2500 - 2600
of 6613
First
19
20
21
22
23
24
25
26
27
28
29
30
31
32
33
Last
Step by Step Answers