New Semester
Started
Get
50% OFF
Study Help!
--h --m --s
Claim Now
Question Answers
Textbooks
Find textbooks, questions and answers
Oops, something went wrong!
Change your search query and then try again
S
Books
FREE
Study Help
Expert Questions
Accounting
General Management
Mathematics
Finance
Organizational Behaviour
Law
Physics
Operating System
Management Leadership
Sociology
Programming
Marketing
Database
Computer Network
Economics
Textbooks Solutions
Accounting
Managerial Accounting
Management Leadership
Cost Accounting
Statistics
Business Law
Corporate Finance
Finance
Economics
Auditing
Tutors
Online Tutors
Find a Tutor
Hire a Tutor
Become a Tutor
AI Tutor
AI Study Planner
NEW
Sell Books
Search
Search
Sign In
Register
study help
business
statistics informed decisions using data
Statistics Informed Decisions Using Data 5th Global Edition Michael Sullivan - Solutions
Dr. Penelope Nicholls is interested in exploring a possible connection between high plasma homocysteine (a toxic amino acid created by the body as it metabolizes protein) levels and cardiac hypertrophy (enlargement of the heart) in humans. Because there are many complex relationships among human
According to the U.S. Census Bureau, \(7.1 \%\) of all babies born are of low birth weight ( \(
(a) Test whether \(\mu_{1}
Test whether \(\mu_{1}>\mu_{2}\) at the \(\alpha=0.05\) level of significance for the given sample data.Assume that the populations are normally distributed.
Two researchers conducted a study in which two groups of students were asked to answer 42 trivia questions from a board game. The students in group 1 were asked to spend 5 minutes thinking about what it would mean to be a professor, while the students in group 2 were asked to think about soccer
Kids and Leisure A random sample of 40 adults with no children under the age of 18 years results in a mean daily leisure time of 5.25 hours, with a standard deviation of 2.36 hours. A random sample of 40 adults with children under the age of 18 results in a mean daily leisure time of 4.24 hours,
Comparing Step Pulses A physical therapist wanted to know whether the mean step pulse of men was less than the mean step pulse of women. She randomly selected 60 men and 77 women to participate in the study. Each subject was required to step up and down a 6-inch platform. The pulse of each subject
Right-tailed test with \(\alpha=0.01\), degrees of freedom in the numerator \(=12\), degrees of freedom in the denominator \(=25\).Find the critical value( \(s\) ) for \(\alpha\).
Right-tailed test with \(\alpha=0.025\), degrees of freedom in the numerator \(=15\), degrees of freedom in the denominator \(=50\).Find the critical value( \(s\) ) for \(\alpha\).
Two-tailed test with \(\alpha=0.05\), degrees of freedom in the numerator \(=12\), degrees of freedom in the denominator \(=20\).Find the critical value( \(s\) ) for \(\alpha\).
Two-tailed test with \(\alpha=0.10\), degrees of freedom in the numerator \(=12\), degrees of freedom in the denominator \(=20\).Find the critical value( \(s\) ) for \(\alpha\).
Left-tailed test with \(\alpha=0.01\), degrees of freedom in the numerator \(=20\), degrees of freedom in the denominator \(=25\).Find the critical value( \(s\) ) for \(\alpha\).
Left-tailed test with \(\alpha=0.05\), degrees of freedom in the numerator \(=25\), degrees of freedom in the denominator \(=15\).Find the critical value( \(s\) ) for \(\alpha\).
\(\sigma_{1} eq \sigma_{2}\) at the \(\alpha=0.1\) level of significanceAssume that the populations are normally distributed. Test the given hypothesis.
\(\sigma_{1}>\sigma_{2}\) at the \(\alpha=0.01\) level of significanceAssume that the populations are normally distributed. Test the given hypothesis.
\(\sigma_{1}
\(\sigma_{1}
\(\sigma_{1}>\sigma_{2}\) at the \(\alpha=0.05\) level of significanceAssume that the populations are normally distributed. Test the given hypothesis.
Clifford Adelman, a researcher with the Department of Education, followed a cohort of students who graduated from high school in 1992, monitoring the progress the students made toward completing a bachelor's degree. One aspect of his research was to compare students who first attended a community
In Example 2 from Section 10.3, the quality-control engineer for M\&MMars tested whether the mean weight of fun-size Snickers was 20.1 grams. Suppose that the standard deviation of the weight of the candy was 0.75 gram before a machine recalibration. The engineer wants to know if the
(a) Determine the critical values for a right-tailed test of a standard population deviation with 18 degrees of freedom at \(\alpha=0.1\) level of significance.(b) Determine the critical values for a left-tailed test of a standard population deviation for a sample size of \(n=30\) at
(a) Determine the critical values for a right-tailed test of a standard population deviation with 15 degrees of freedom at \(\alpha=0.1\) level of significance.(b) Determine the critical values for a left-tailed test of a standard population deviation for a sample size of \(n=29\) at
To test \(H_{0}: \sigma=50\) versus \(H_{1}: \sigma
To test \(H_{0}: \sigma=0.35\) versus \(H_{1}: \sigma
A simple random sample of size \(n=200\) drivers were asked if they drive a car manufactured in a certain country. Of the 200 drivers surveyed, 109 responded that they did. Determine if more than half of all drivers drive a car made in this country at the \(\alpha=0.05\) level of significance
A simple random sample of size \(n=20\) is drawn from a population that is normally distributed. The sample variance is found to be 49.3. Determine whether the population variance is less than 95 at the \(\alpha=0.1\) level of significance.
We tested \(H_{0}: p=0.5\) versus \(H_{1}: p
Compute the power of the test for the situation in Example 1.Approach The power of the test is \(1-\beta\). In Example 1, we found that \(\beta\) is 0.7764 when the true population proportion is 0.48 .Data from Example 1We tested \(H_{0}: p=0.5\) versus \(H_{1}: p
\(H_{0}: p=0.6\) versus \(H_{1}: p>0.6\)\(n=250 ; x=165\)Test the hypothesis at the \(\alpha=0.05\) level of significance, using(a) the classical approach(b) the P-value approach. Be sure to verify the requirements of the test.
The mean height of American males is 69.5 inches. The heights of the 43 male U.S. presidents* (Washington through Obama) have a mean 70.78 inches and a standard deviation of 2.77 inches. Treating the 43 presidents as a simple random sample, determine if there is evidence to suggest that U.S.
The "fun size" of a Snickers bar is supposed to weigh 20 grams. Because the penalty for selling candy bars under their advertised weight is severe, the manufacturer calibrates the machine so the mean weight is 20.1 grams. The quality-control engineer at M\&M-Mars, the Snickers manufacturer, is
According to the American Community Survey, the mean travel time to work in Collin County, Texas, in 2013 was 27.5 minutes. The Department of Transportation reprogrammed all the traffic lights in Collin County in an attempt to reduce travel time. To determine if there is evidence that travel time
(a) Determine the critical value(s) for a right-tailed test of a population mean at the \(\alpha=0.01\) level of significance with 15 degrees of freedom.(b) Determine the critical value(s) for a left-tailed test of a population mean at the \(\alpha=0.10\) level of significance based on a sample
To test \(H_{0}: \mu=50\) versus \(H_{1}: \mu
To test \(H_{0}: \mu=80\) versus \(H_{1}: \mu
To test \(H_{0}: \mu=20\) versus \(H_{1}: \mu
One year, the mean age of inmates on death row was 40.6 years. A sociologist wondered whether the mean age of a death row inmate has changed since then. She randomly selects 32 death row inmates and finds that their mean age is 39.2, with a standard deviation of 8.1. Construct a \(95 \%\)
\(H_{0}: p=0.6\) versus \(H_{1}: p
\(H_{0}: p=0.45\) versus \(H_{1}: p
\(H_{0}: p=0.25\) versus \(H_{1}: p
According to a certain government agency for a large country, the proportion of fatal traffic accidents in the country in which the driver had a positive blood alcohol concentration (BAC) is 0.37 . Suppose a random sample of 106 traffic fatalities in a certain region results in 51 that involved a
In a previous poll, \(29 \%\) of adults with children under the age of 18 reported that their family ate dinner together seven nights a week. Suppose that, in a more recent poll, 318 of 1157 adults with children under the age of 18 reported that their family ate dinner together seven nights a week.
Taught Enough Math? In \(1994,52 \%\) of parents with children in high school felt it was a serious problem that high school students were not being taught enough math and science. A recent survey found that 256 of 800 parents with children in high school felt it was a serious problem that high
Several years ago, \(39 \%\) of parents who had children in grades \(\mathrm{K}-12\) were satisfied with the quality of education the students receive. A recent poll asked 1,065 parents who have children in grades K-12 if they were satisfied with the quality of education the students receive. Of
Political Philosophy According to Gallup, \(21 \%\) of adult Americans consider themselves to be liberal. Respondents of the Sullivan Statistics Survey I were asked to disclose their political philosophy: Conservative, Liberal, Moderate. Go to the book's website to obtain the data file
Problem Decide whether the sampling method is independent or dependent. Then determine whether the response variable is qualitative or quantitative.(a) Joliet Junior College decided to implement a course redesign of its developmental mathematics program. Students either enrolled in a traditional
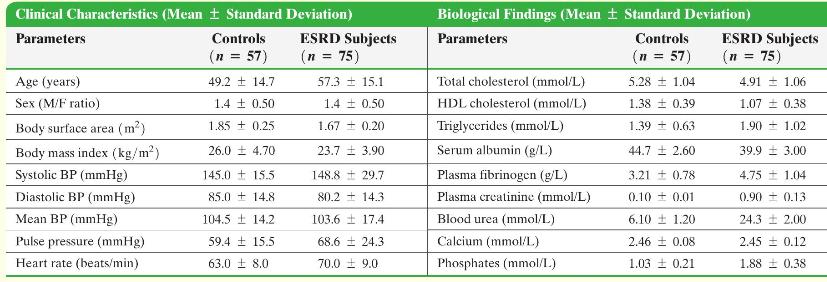
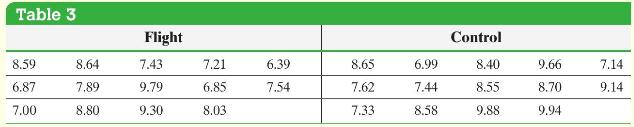
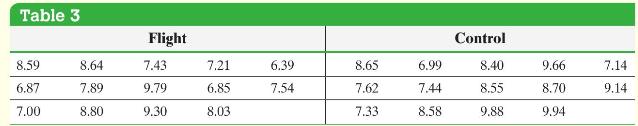
In the Spacelab Life Sciences 2 payload, 14 male rats were sent to space. Upon their return, the red blood cell mass (in milliliters) of the rats was determined. A control group of 14 male rats was held under the same conditions (except for space flight) as the space rats, and their red blood cell
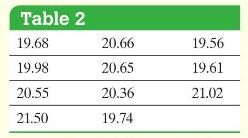
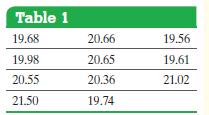
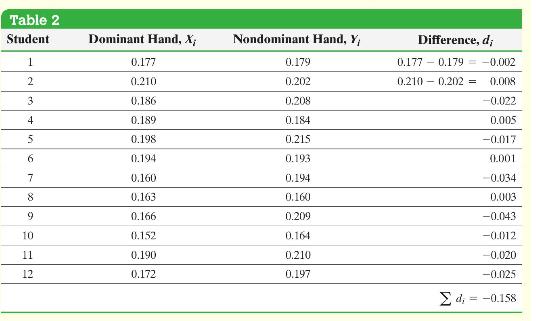
Using the data from Table 2, construct a \(95 \%\) confidence interval estimate of the mean difference, \(\mu_{d}\).By Hand ApproachStep 1 Compute the differenced data. Because the sample size is small, we must verify that the differenced data come from a population that is approximately normal
In clinical trials of Nasonex, 3774 adult and adolescent allergy patients (patients 12 years and older) were randomly divided into two groups. The patients in group 1 (experimental group) received \(200 \mu \mathrm{g}\) of Nasonex, while the patients in group 2 (control group) received a placebo.
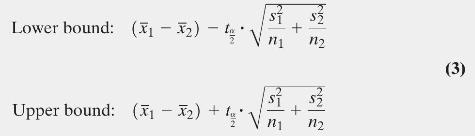
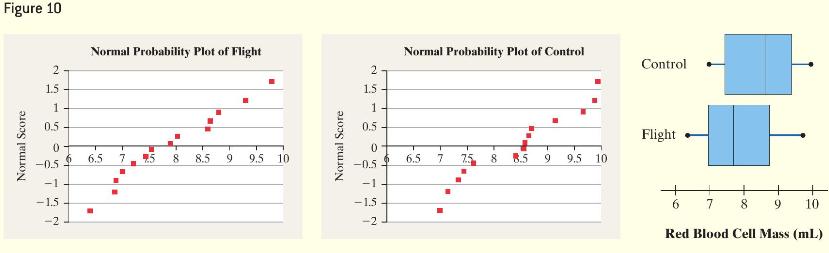
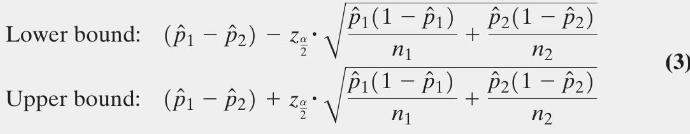
Construct a 95% confidence interval for \(\mu_{1}-\mu_{2}\) using the data presented in Table 3.Approach The normal probability plots and boxplot (Figure 10) indicate that the data are approximately normal with no outliers. Construct the confidence interval with \(\alpha=0.05\) using Formula (3) or
The Gallup organization surveyed 1100 adult Americans on May 6- 9, 2002, and conducted an independent survey of 1100 adult Americans on May 8- 11, 2014. In both surveys they asked the following: "Right now, do you think the state of moral values in the country as a whole is getting better or
A nutritionist wants to estimate the difference between the proportion of males and females who consume the USDA's recommended daily intake of calcium. What sample size should be obtained if she wishes the estimate to be within 3 percentage points with \(95 \%\) confidence, assuming that(a) she
A researcher wishes to compare IQ scores of patients with and without cysts. She obtains a random sample of 708 patients of each category who take an IQ test and determines each patient's IQ.Determine whether the sampling is dependent or independent. Indicate whether the response variable is
(a) Determine \(d_{i}=X_{i}-Y_{i}\) for each pair of data.(b) Compute \(\bar{d}\) and \(s_{d}\).(c) Test if \(\mu_{d}
A researcher wishes to compare academic aptitudes of married mathematicians and their spouses. She obtains a random sample of 287 such couples who take an academic aptitude test and determines each spouse's academic aptitude.Determine whether the sampling is dependent or independent. Indicate
Test whether \(p_{1}>p_{2}\). Sample data: \(x_{1}=127, n_{1}=255\), \(x_{2}=133, n_{2}=309\), where \(\alpha=0.05\).Conduct each test at the \(\alpha\) level of significance by determining(a) the null and alternative hypotheses,(b) the test statistic,(c) the critical value, (d) the
Test whether \(p_{1} > p_{2}\). Sample data: \(x_{1}=28, n_{1}=254\), \(x_{2}=36, n_{2}=302\), where \(\alpha=0.010\).Conduct each test at the \(\alpha\) level of significance by determining(a) the null and alternative hypotheses,(b) the test statistic,(c) the critical value, (d) the
Test whether \(p_{1} > p_{2}\). Sample data: \(x_{1}=28, n_{1}=254\), \(x_{2}=36, n_{2}=301\), where \(\alpha=0.05\).Conduct each test at the \(\alpha\) level of significance by determining(a) the null and alternative hypotheses,(b) the test statistic,(c) the critical value, (d) the
Test whether \(p_{1}>p_{2}\). Sample data: \(x_{1}=120, n_{1}=248\), \(x_{2}=139, n_{2}=313\), where \(\alpha=0.010\).Conduct each test at the \(\alpha\) level of significance by determining(a) the null and alternative hypotheses,(b) the test statistic,(c) the critical value, (d) the
\(x_{1}=357, n_{1}=514, x_{2}=426, n_{2}=566,90 \%\) confidence Construct a confidence interval for \(p_{1}-p_{2}\) at the given level of confidence.
\(x_{1}=371, n_{1}=509, x_{2}=434, n_{2}=579,95 \%\) confidence Construct a confidence interval for \(p_{1}-p_{2}\) at the given level of confidence.
\(x_{1}=30, n_{1}=257, x_{2}=34, n_{2}=318,99 \%\) confidence Construct a confidence interval for \(p_{1}-p_{2}\) at the given level of confidence.
\(x_{1}=30, n_{1}=225, x_{2}=40, n_{2}=317,95 \%\) confidence Construct a confidence interval for \(p_{1}-p_{2}\) at the given level of confidence.
In 1948, an organization surveyed 1100 adults and asked, "Are you a total abstainer from, or do you on occasion consume, alcoholic beverages?" Of the 1100 adults surveyed, 374 indicated that they were total abstainers. In a recent survey, the same question was asked of 1100 adults and 330 indicated
A survey asked, "How many tattoos do you currently have on your body?" Of the 1248 males surveyed, 176 responded that they had at least one tattoo. Of the 1026 females surveyed, 147 responded that they had at least one tattoo. Construct a 95% confidence interval to judge whether the proportion of
A physical therapist wants to determine the difference in the proportion of men and women who participate in regular sustained physical activity. What sample size should be obtained if she wishes the estimate to be within two percentage points with \(90 \%\) confidence, assuming that(a) she uses
The two major college entrance exams that a majority of colleges accept for admission are the SAT and ACT. ACT looked at historical records and established 22 as the minimum ACT math score for a student to be considered prepared for college mathematics. [Note: "Being prepared" means there is a \(75
What do you think is more important- to protect the right of Americans to own guns or to control gun ownership? When asked this question, \(46 \%\) of all Americans said protecting the right to own guns is more important. The Pew Research Center surveyed 1267 randomly selected Americans with at
A 2009 study by Princeton Survey Research Associates International found that \(34 \%\) of teenagers text while driving. Does a recent survey conducted by Consumer Reports, which found that 353 of 1200 randomly selected teens had texted while driving, suggest that the proportion of teens who text
According to the U.S. Department of Agriculture (USDA), \(48.9 \%\) of males aged 20 to 39 years consume the recommended daily requirement of calcium. After an aggressive "Got Milk" advertising campaign, the USDA conducts a survey of 35 randomly selected males aged 20 to 39 and finds that 21 of
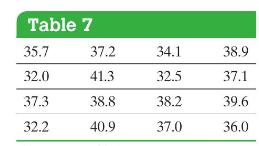
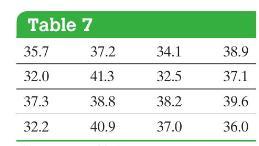
The website fueleconomy.gov allows drivers to report the miles per gallon of their vehicle. The data in Table 7 shows the reported miles per gallon of 2011 Ford Focus automobiles for 16 different owners. Treat the sample as a simple random sample of all 2011 Ford Focus automobiles. Construct a
Use StatCrunch to estimate a 95\% confidence interval for the mean and median miles per gallon of a 2011 Ford Focus based on the sample data in Table 7.Approach The steps for constructing confidence intervals using a bootstrap sample using StatCrunch's Resample command are given in the Technology
Suppose the following data represent the heights (in inches) of a random sample of males: \(63,67,68,69,73,74\). Which of the following could be a possible bootstrap sample?(a) \(74,69,74,65,68,68\)(b) \(68,68,67,68,74\)(c) \(67,74,74,67,63,68\)(d) \(67,67,67,69,69,63,63\)(e) \(74,63,68,68,68,69\)
Suppose the following data represent the heights (in inches) of a random sample of males: \(63,66,67,70,73,75\). Below are three bootstraps samples. For each bootstrap sample, determine the bootstrap sample mean.Bootstrap Sample 1:75,73, 66, 63, 67, 67 Bootstrap Sample 2: 75, 66, 75, 70,75, 70
IQ scores are known to be approximately normally distributed with mean 100 and standard deviation 15 .(a) Simulate obtaining a random sample of 12 IQ scores from this population.(b) Use the data from part(a) to construct a \(95 \%\) confidence interval for the mean IQ using Student's
The exponential probability distribution can be used to model waiting time in line or the lifetime of electronic components. Its density function is skewed right. Suppose the wait-time in a line can be modeled by the exponential distribution with \(\mu=\sigma=5\) minutes.(a) Simulate obtaining a
Certain statistics are difficult to bootstrap. One such statistic is the median. Consider the following to see why.(a) Simulate obtaining a random sample of 12 IQ scores. Recall IQ scores are approximately normally distributed with mean 100 and standard deviation 15 .(b) Given that IQ scores are
A friend of yours wants to play a simple coin-flipping game. If the coin comes up heads, you win; if it comes up tails, your friend wins. Suppose the outcome of five plays of the game is \(\mathrm{T}, \mathrm{T}, \mathrm{T}, \mathrm{T}, \mathrm{T}\). Is your friend cheating?Approach To decide
Determine the null and alternative hypotheses. State whether the test is two tailed, left-tailed, or right-tailed.(a) The Medco pharmaceutical company has just developed a new antibiotic for children. Two percent of children taking competing antibiotics experience headaches as a side effect. A
Problem The Medco pharmaceutical company has just developed a new antibiotic. Two percent of children taking competing antibiotics experience headaches as a side effect. A researcher for the Food and Drug Administration wishes to know if the percentage of children taking the new antibiotic who
The Medco pharmaceutical company has just developed a new antibiotic. Two percent of children taking competing antibiotics experience a headache as a side effect. A researcher for the Food and Drug Administration believes that the proportion of children taking the new antibiotic who experience a
\(H_{0}: \sigma=9\)The null and alternative hypotheses are given. Determine whether the hypothesis test is left-tailed, right-tailed, or two-tailed. What parameter is being tested?
\(H_{0}: \mu=7\)\(H_{1}: \sigma7\)The null and alternative hypotheses are given. Determine whether the hypothesis test is left-tailed, right-tailed, or two-tailed. What parameter is being tested?
\(H_{0}: \mu=110\)\(H_{1}: \mu
\(H_{0}: \sigma=7.8\)\(H_{1}: \sigma eq 7.8\)The null and alternative hypotheses are given. Determine whether the hypothesis test is left-tailed, right-tailed, or two-tailed. What parameter is being tested?
For students who first enrolled in two year public institutions in a recent semester, the proportion who earned a bachelor's degree within six years was 0.386 . The president of a certain college believes that the proportion of students who enroll in her institution have a lower completion
Single-Family Home Price Three years ago, the mean price of an existing single-family home was \(\$ 243,787\). A real estate broker believes that existing home prices in her neighborhood are higher.(a) determine the null and alternative hypotheses,(b) explain what it would mean to make a Type I
According to a report, the standard deviation of monthly cell phone bills was \(\$ 49.11\) three years ago. A researcher suspects that the standard deviation of monthly cell phone bills is different today.(a) determine the null and alternative hypotheses,(b) explain what it would mean to make a
For the hypotheses in Problem 15, the null hypothesis is rejected.Data from Problem 15Complete College For students who first enrolled in two year public institutions in a recent semester, the proportion who earned a bachelor's degree within six years was 0.386 . The president of a certain college
Popcorn Consumption According to a food website, the mean consumption of popcorn annually by Americans is 59 quarts. The marketing division of the food website unleashes an aggressive campaign designed to get Americans to consume even more popcorn.(a) Determine the null and alternative hypotheses
E-Cigs According to the Centers for Disease Control and Prevention, \(9.8 \%\) of high school students currently use electronic cigarettes. A high school counselor is concerned the use of e-cigs at her school is higher.(a) Determine the null and alternative hypotheses.(b) If the sample data
84%Determine the critical value zα/2 that corresponds to the given level of confidence.
91%Determine the critical value zα/2 that corresponds to the given level of confidence.
82%Determine the critical value zα/2 that corresponds to the given level of confidence.
97%Determine the critical value zα/2 that corresponds to the given level of confidence.
Lower bound = 0.229, upper bound = 0.771, n = 1200 Determine the point estimate of the population proportion, the margin of error for each confidence interval, and the number of individuals in the sample with the specified characteristic, x, for the sample size provided.
Lower bound = 0.102, upper bound = 0.348, n = 1000 Determine the point estimate of the population proportion, the margin of error for each confidence interval, and the number of individuals in the sample with the specified characteristic, x, for the sample size provided.
Lower bound = 0.257, upper bound = 0.513, n = 1200 Determine the point estimate of the population proportion, the margin of error for each confidence interval, and the number of individuals in the sample with the specified characteristic, x, for the sample size provided.
Lower bound = 0.114, upper bound = 0.606, n = 1200 Determine the point estimate of the population proportion, the margin of error for each confidence interval, and the number of individuals in the sample with the specified characteristic, x, for the sample size provided.
x = 105, n = 150, 90% confidence Construct a confidence interval of the population proportion at the given level of confidence.
Showing 4700 - 4800
of 5564
First
41
42
43
44
45
46
47
48
49
50
51
52
53
54
55
Last
Step by Step Answers