New Semester
Started
Get
50% OFF
Study Help!
--h --m --s
Claim Now
Question Answers
Textbooks
Find textbooks, questions and answers
Oops, something went wrong!
Change your search query and then try again
S
Books
FREE
Study Help
Expert Questions
Accounting
General Management
Mathematics
Finance
Organizational Behaviour
Law
Physics
Operating System
Management Leadership
Sociology
Programming
Marketing
Database
Computer Network
Economics
Textbooks Solutions
Accounting
Managerial Accounting
Management Leadership
Cost Accounting
Statistics
Business Law
Corporate Finance
Finance
Economics
Auditing
Tutors
Online Tutors
Find a Tutor
Hire a Tutor
Become a Tutor
AI Tutor
AI Study Planner
NEW
Sell Books
Search
Search
Sign In
Register
study help
business
statistics informed decisions using data
Statistical Methods 4th Edition Donna L. Mohr, William J. Wilson, Rudolf J. Freund - Solutions
Urn I contains eleven black and nine white balls and urn II contains three black, eight white, and six red balls. Roll a fair die.If the die is a one, three, or five, randomly select a ball from urn I. However, if the die is a two, four, or six, randomly select a ball from urn II.(a) Determine the
Urn I contains six black and nine white balls; urn II contains five black, twelve white, and nine red balls; and urn III contains eleven black, six white, and twelve red balls. Roll a fair die. If the die is a one, three, or five, randomly select a ball from urn I.If the die is a two or four,
Urn I contains seven black and three white balls; urn II contains twelve black, five white, and six red balls; and urn III contains one black, eight white, and four red balls. Roll a fair die.If the die is a one, randomly select a ball from urn I. If the die is a two, three, or four, randomly
Color Blindness The most common form of color blindness is red–green color blindness. People with this type of color blindness cannot distinguish between green and red.Approximately 8% of all males have red–green color blindness, while only about 0.64% of women have red–green color blindness.
ELISA Test The standard test for the HIV virus is the ELISA test, which tests for the presence of HIV antibodies. If an individual does not have the HIV virus, the test will come back negative for the presence of HIV antibodies 99.8% of the time and will come back positive for the presence of HIV
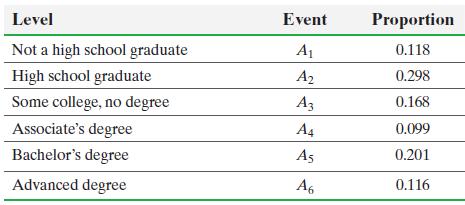
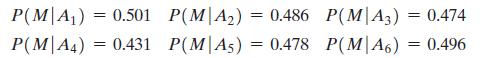
The data in the following table represent the proportion of Americans 25 years of age or older at various levels of educational attainment in 2013.If we let M represent the event that a randomly selected American who is 25 years of age or older is male, we can also obtain the following
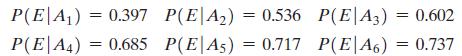
Refer to Problem 35. If we let E represent the event that a randomly selected American who is 25 years of age or older is employed, we can also obtain the following probabilities from the Census Bureau data.(a) What is the probability that a randomly selected American 25 years of age or older is
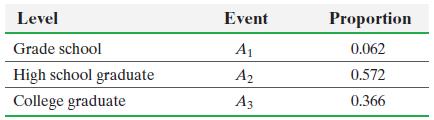
Voting Pattern The following data represent the proportion of Americans who voted in the 2012 presidential election at various levels of educational attainment.If we let D represent the event that a randomly selected American who voted in the 2012 presidential election voted Democratic, we can also
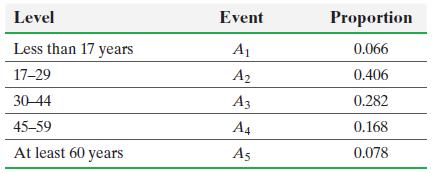
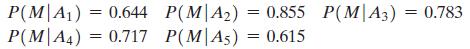
The following data represent the proportion of murder victims at various age levels in 2013.If we let M represent the event that a randomly selected murder victim was male, we can also obtain the following probabilities from the FBI data.(a) What is the probability that a randomly selected murder
The CIA suspects that one of its operatives is a double agent. Past experience indicates that 95% of all operatives suspected of espionage are, in fact, guilty. The CIA decides to administer a polygraph to the suspected spy. It is known that if a person is guilty, the polygraph returns a result
If we decrease the confidence level, the width of the confidence interval will: (1) increase (2) remain unchanged (3) decrease (4) double (5) none of the above
_______ The t distribution is more dispersed than the normal.
Indicate true or false for the following statements. If false, specify what change will make the statement true. _______ The χ2 distribution is used for inferences on the mean when the variance is unknown.
_______ The mean of the t distribution is affected by the degrees of freedom.
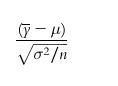
_______ The quantity has the t distribution with (n - 1) degrees of freedom. (H) 2/n
_______ In the t test for a mean, the level of significance increases if the population standard deviation increases, holding the sample size constant.
Indicate true or false for the following statements. If false, specify what change will make the statement true. _______ The χ2 distribution is used for inferences on the variance.
_______ The mean of the t distribution is zero.
Indicate true or false for the following statements. If false, specify what change will make the statement true. _______ When the test statistic is t and the number of degrees of freedom is >30, the critical value of t is very close to that of z (the standard normal).
Indicate true or false for the following statements. If false, specify what change will make the statement true. _______ The χ2 distribution is skewed and its mean is always 2.
Indicate true or false for the following statements. If false, specify what change will make the statement true. _______ The sampling distribution of a proportion is approximated by the χ2 distribution.
_______ The t test can be applied with absolutely no assumptions about the distribution of the population.
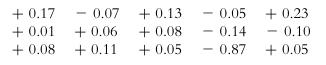
A manufacturer of watches has established that on the average his watches do not gain or lose. He also would like to claim that at least 95% of the watches are accurate to ±0.2 s per week. A random sample of 15 watches provided the following gains (+) or losses (-) in seconds in 1 week:Can the
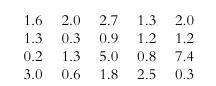
A sample of 20 insurance claims for automobile accidents (in \($1000\)) gives the following values: Construct a 0.95 confidence interval on the mean value of claims. Comment on the usefulness of this estimate. 1.6 2.0 2.0 2.7 2.7 1.3 2.0 1.3 0.3 0.9 1.2 1.2 0.2 1.3 5.0 0.8 7.4 3.0 0.6 1.8 2.5 0.3
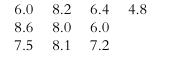
It is said that the average weight of healthy 12-hour-old infants is supposed to be 7.5 lb. A sample of newborn babies from a low-income neighborhood yielded the following weights (in pounds) at 12 hours after birth: At the 0.01 significance level, can we conclude that babies from this
A production line in a certain factory puts out washers with an average inside diameter of 0.10 in. A quality control procedure that requires the line to be shut down and adjusted when the standard deviation of inside diameters of washers exceeds 0.002 in. has been established. Discuss the quality
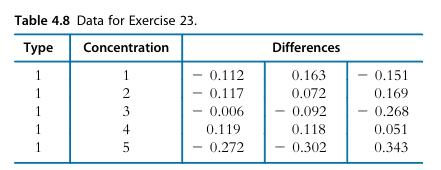
This experiment concerns the precision of one type of collecting tubes used for air sampling of hydrofluoric acid. The tubes are tested three times at five different concentrations. The data shown in Table 4.8 give the differences between the three observed and true concentrations. The differences
_______________________ One of the assumptions underlying the use of the (pooled) two-sample test is that the samples are drawn from populations having equal means.
_______________________ In the two-sample t test, the number of degrees of freedom for the test statistic increases as sample sizes increase.
_______________________ A two-sample test is twice as powerful as a one sample test.
Indicate true or false for the following statements. If false, specify what change will make the statement true. _______________________ If every observation is multiplied by 2, then the t statistic is multiplied by 2.
_______________________ When the means of two independent samples are used to compare two population means, we are dealing with dependent (paired) samples.
_______________________ The use of paired samples allows for the control of variation because each pair is subject to the same common sources of variability.
Indicate true or false for the following statements. If false, specify what change will make the statement true. _______________________ The χ2 distribution is used for making inferences about two population variances.
_______________________ The F distribution is used for testing differences between means of paired samples.
_______________________ The standard normal (z) score may be used for inferences concerning population proportions.
Indicate true or false for the following statements. If false, specify what change will make the statement true. _______________________ The F distribution is symmetric and has a mean of 0.
Indicate true or false for the following statements. If false, specify what change will make the statement true. _______________________ The F distribution is skewed and its mean is close to 1.
_______________________ The pooled variance estimate is used when comparing means of two populations using independent samples.
_______________________ It is not necessary to have equal sample sizes for the paired t test.
_______________________ If the calculated value of the t statistic is negative, then there is strong evidence that the null hypothesis is false.
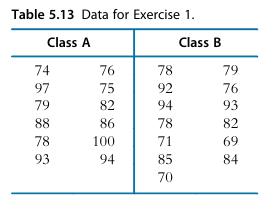
Two sections of a class in statistics were taught by two different methods. Students’ scores on a standardized test are shown in Table 5.13. Do the results present evidence of a difference in the effectiveness of the two methods? (Use α = 0:05.) Table 5.13 Data for Exercise 1. Class A Class B 74
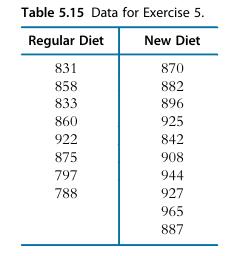
To assess the effectiveness of a new diet formulation, a sample of 8 steers is fed a regular diet and another sample of 10 steers is fed a new diet. The weights of the steers at 1 year are given in Table 5.15. Do these results imply that the new diet results in higher weights? (Use α = 0:05.)
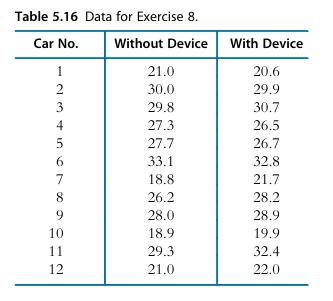
In a test of the effectiveness of a device that is supposed to increase gasoline mileage in automobiles, 12 cars were run, in random order, over a prescribed course both with and without the device in random order. The mileages (mpg) are given in Table 5.16. Is there evidence that the device is
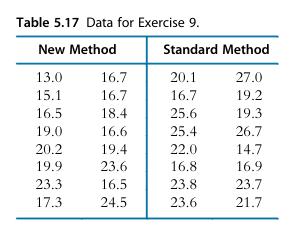
A new method of teaching children to read promises more consistent improvement in reading ability across students. The new method is implemented in one randomly chosen class, while another class is randomly chosen to represent the standard method. Improvement in reading ability using a standardized
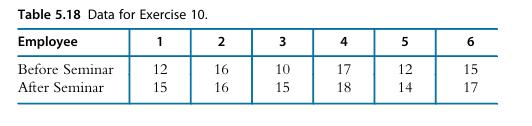
A company offers a seminar on a technical subject to its employees. Before the seminar begins, each employee scores their self-rating of knowledge on the subject. Three months after the seminar, each employee again rates their knowledge of the subject. The data are shown in Table 5.18. (a) Is
Chlorinated hydrocarbons (mg/kg) found in samples of two species of fish in a lake are as follows: Perform a hypothesis test to determine whether there is a difference in the mean level of hydrocarbons between the two species, assuming the population variances are equal. Is the equal variance
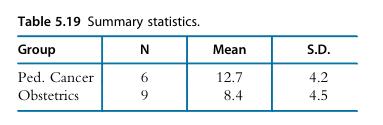
A large hospital administers a “compassion burnout” survey to a random sample of nurses. The responses are scored on a scale of 0 = least burnout to 20 = most burnout. The responses of the nurses in the pediatric cancer and obstetrics units are summarized in Table 5.19. Use α = 5%. (a) Is
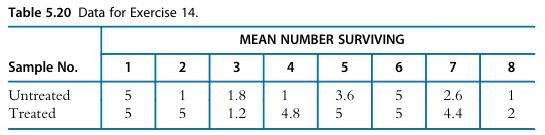
Eight samples of effluent from a pulp mill were each divided into 10 batches. From each sample, 5 randomly selected batches were subjected to a treatment process intended to remove toxic substances. Five fish of the same species were placed in each batch, and the mean number surviving in the 5
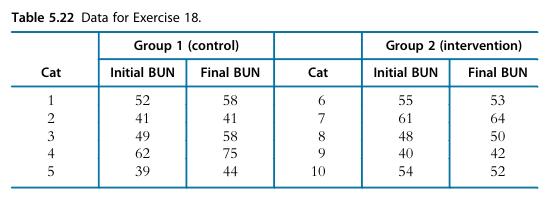
Elevated levels of blood urea nitrogen (BUN) denote poor kidney function. Ten elderly cats showing early signs of renal failure are randomly divided into two groups. Group 1 (control group) is placed on a standard high-protein diet. Group 2 (intervention group) is placed on a low-phosphorus
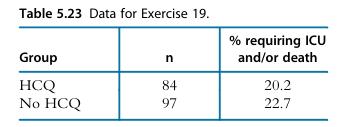
In the 2020 Covid-19 pandemic, a number of emergency observational studies were carried out to evaluate hydro chloroquine (HCQ) as a potential treatment. Table 5.23 reports the results of a French study of Covid-19 patients who had developed pneumonia and required oxygen support (CNN, 4/15/2020).
Garcia and Ybarra (2007) describe an experiment in which 174 undergraduates were randomly divided into a people-accounting condition (describing a numerical imbalance in an award) and a control condition. A situation was described to them, and they made a choice that could either add to or detract
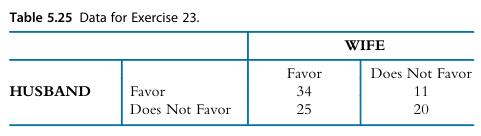
A sample of 90 randomly selected married couples are asked about their views on universal background checks for gun permits (Favor/Do Not Favor). The responses are summarized in Table 5.25. Do husbands and wives differ in their probability of favoring background checks? If so, which member of the
____________ When there are only two samples, you should prefer the independent samples t test because it has more statistical power than the ANOVA.
____________ A set of sample means is more likely to result in rejection of the hypothesis of equal population means if the variability within the populations is smaller.
____________ Dunnett’s Procedure is more powerful than Scheffé’s, but it is more limited in the kinds of hypotheses it tests.
For the following true/false statements regarding concepts and uses of the analysis of variance, indicate whether the statement is true or false and specify what will correct a false statement.____________ If every observation is multiplied by 2, then the value of the F statistic in an ANOVA is
____________ To use the F statistic to test for the equality of two variances, the sample sizes must be equal.
____________ The logarithmic transformation is used when the variance is proportional to the mean.
____________ With the usual ANOVA assumptions, the ratio of two mean squares whose expected values are the same has an F distribution.
____________ One purpose of randomization is to remove experimental error from the estimates.
____________ To apply the F test in ANOVA, the sample size for each factor level (population) must be the same.
____________ To apply the F test for ANOVA, the sample standard deviations for all factor levels must be the same.
____________ To apply the F test for ANOVA, the population standard deviations for all factor levels must be the same.
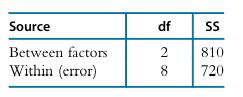
____________ An ANOVA table for a one-way experiment gives the following: Source Between factors Within (error) df SS - 28 810 720
____________ A “statistically significant F” in an ANOVA indicates that you have identified which levels of factors are different from the others.
____________ Random models are appropriate when we are content simply to make statements about the factor levels actually used in the experiment and not about some larger group of factor levels.
____________ A sum of squares is a measure of dispersion.
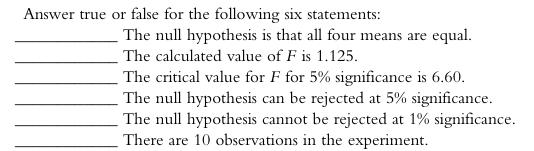
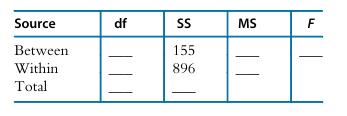
Forty participants are randomly divided into five groups. Each participant is given a list of words to memorize. The groups differ in the kinds of word lists given to them. A portion of the ANOVA table is given below. Complete the table, and draw the appropriate conclusion assuming α = 5%. Source
Sixty older homes are randomly divided into four groups. Homes in each group are retrofitted with a different type of insulation, and then the change in energy consumption is recorded. A portion of the ANOVA table is given below. Complete the table, and draw the appropriate conclusion assuming α =
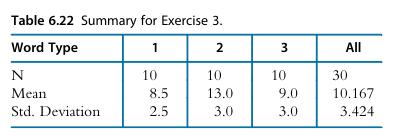
Thirty participants are randomly divided into three groups. Each participant is given a list of words to memorize. The groups differ in the kinds of words given to them, and the response is the number of words the participant could recall. The data has been summarized in Table 6.22. Construct the
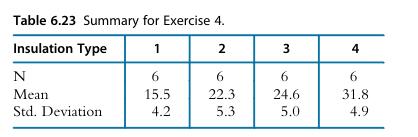
A sample of 24 older homes are randomly divided into four groups and retrofitted with different types of insulation. The response variable is the relative decrease in energy usage. The data is summarized in Table 6.23. Construct the ANOVA table, and draw the appropriate conclusion assuming α =
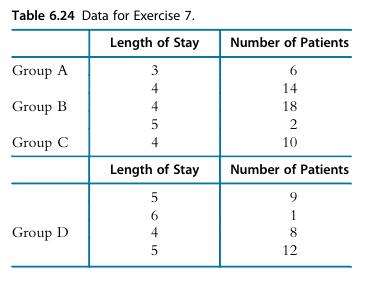
A study of the effect of different types of anesthesia on the length of postoperative hospital stay yielded the following for cesarean patients: Group A was given an epidural MS. Group B was given an epidural. Group C was given a spinal. Group D was given general anesthesia. The data are
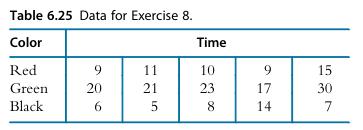
Three sets of five mice were randomly selected to be placed in a standard maze but with different color doors. The response is the time required to complete the maze as seen in Table 6.25.(a) Perform the appropriate analysis to test whether there is an effect due to door color.(b) The researchers
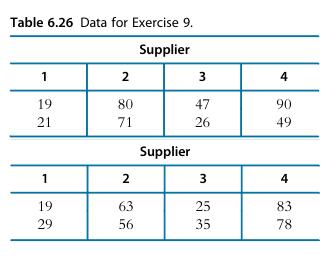
A manufacturer of air conditioning ducts is concerned about the variability of the tensile strength of the sheet metal among the many suppliers of this material. Four samples of sheet metal from four randomly chosen suppliers are tested for tensile strength. The data are given in Table
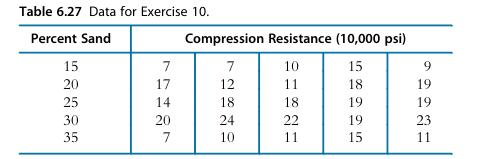
A manufacturer of concrete bridge supports is interested in determining the effect of varying the sand content of concrete on the strength of the supports. Five supports are made for each of five different amounts of sand in the concrete mix and each support tested for compression resistance. The
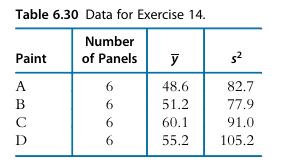
The data shown in Table 6.30 are times in months before the paint started to peel for four brands of paint applied to a set of test panels. If all paints cost the same, can you make recommendations on which paint to use? Table 6.30 Data for Exercise 14. Number Paint of Panels y 5 ABCD 6 48.6
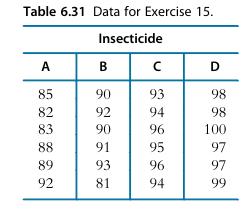
The data shown in Table 6.31 relate to the effectiveness of several insecticides. One hundred insects of a particular species were put into a chamber and exposed to an insecticide for 15 s. The procedure was applied in random order six times for each of four insecticides. The response is the number
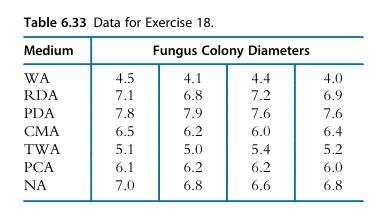
For laboratory studies of an organism, it is important to provide a medium in which the organism flourishes. The data for this exercise shown in Table 6.33 are from a completely randomized design with four samples for each of seven media. The response is the diameters of the colonies of
For the following true/false statements regarding concepts and uses of simple linear regression analysis, indicate whether the statement is true or false and specify what will correct a false statement. ______ A plot of the residuals versus the dependent variable provides a good graphical check
______ In linear regression we may extrapolate without danger.
______ When there is no linear relationship between two variables, a horizontal regression line best describes the relationship.
The scores of eight persons on the Stanford-Binet IQ test were:The median is:(1) 107 (2) 110 (3) 112 (4) 104 (5) none of the above 95 87 96 110 150 104 112 110
The concentration of DDT, in milligrams per liter, is:(1) a nominal variable(2) an ordinal variable(3) an interval variable(4) a ratio variable
If the interquartile range is zero, you can conclude that:(1) the range must also be zero(2) the mean is also zero(3) at least 50% of the observations have the same value(4) all of the observations have the same value(5) none of the above is correct
The species of each insect found in a plot of cropland is:(1) a nominal variable(2) an ordinal variable(3) an interval variable(4) a ratio variable
The “average” type of grass used in Texas lawns is best described by(1) the mean(2) the median(3) the mode
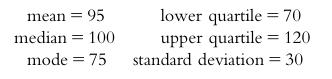
A sample of 100 IQ scores produced the following statistics:Which statement(s) is (are) correct?(1) Half of the scores are less than 95.(2) The middle 50% of scores are between 100 and 120.(3) One-quarter of the scores are greater than 120.(4) The most common score is 95. mean = 95 median 100 lower
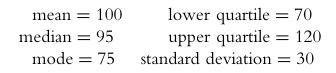
A sample of 100 IQ scores produced the following statistics:Which statement(s) is (are) correct?(1) Half of the scores are less than 100.(2) The middle 50% of scores are between 70 and 120.(3) One-quarter of the scores are greater than 100.(4) The most common score is 95. mean = 100 median = 95
Identify which of the following is a measure of dispersion:(1) median(2) 90th percentile(3) interquartile range(4) mean
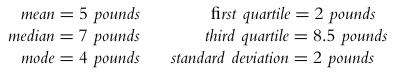
A sample of pounds lost in a given week by individual members of a weightreducing clinic produced the following statistics: Identify the correct statement:(1) One-fourth of the members lost less than 2 pounds.(2) The middle 50% of the members lost between 2 and 8.5 pounds.(3) The most common
A measurable characteristic of a population is:(1) a parameter(2) a statistic(3) a sample(4) an experiment
What is the primary characteristic of a set of data for which the standard deviation is zero?(1) All values of the variable appear with equal frequency.(2) All values of the variable have the same value.(3) The mean of the values is also zero.(4) All of the above are correct.(5) None of the above
Let X be the distance in miles from their present homes to residences when in high school for individuals at a class reunion. Then X is:(1) a categorical (nominal) variable(2) a continuous variable(3) a discrete variable(4) a parameter(5) a statistic
A subset of a population is:(1) a parameter(2) a population(3) a statistic(4) a sample(5) none of the above
The median is a better measure of central tendency than the mean if:(1) the variable is discrete(2) the distribution is skewed(3) the variable is continuous(4) the distribution is symmetric(5) none of the above is correct
A small sample of automobile owners at Texas A & M University produced the following number of parking tickets during a particular year: 4, 0, 3, 2, 5, 1, 2, 1, 0. The mean number of tickets (rounded to the nearest tenth) is:(1) 1.7(2) 2.0(3) 2.5(4) 3.0(5) none of the above
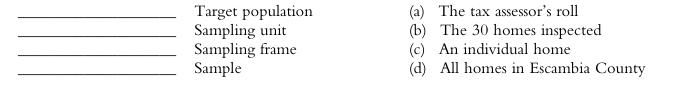
To judge the extent of damage from Hurricane Ivan, an Escambia County official randomly selects addresses of 30 homes from the county tax assessor’s roll and then inspects these homes for damage.Identify each of the following by writing the appropriate letter into the blank. Target population
A physician tells you the largest typical hemoglobin value is 13.5 and the smallest is 9.5 mg/L. A reasonable estimate of the standard deviation is:(1) 11.5(2) 1.0(3) 4.0(4) unknowable with this information
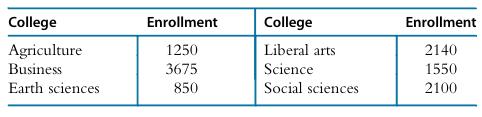
A university published the following distribution of students enrolled in the various colleges: Construct a bar chart of these data. College Enrollment College Enrollment Agriculture 1250 Liberal arts 2140 Business 3675 Science 1550 Earth sciences 850 Social sciences 2100
Showing 5100 - 5200
of 5564
First
42
43
44
45
46
47
48
49
50
51
52
53
54
55
56
Step by Step Answers