New Semester
Started
Get
50% OFF
Study Help!
--h --m --s
Claim Now
Question Answers
Textbooks
Find textbooks, questions and answers
Oops, something went wrong!
Change your search query and then try again
S
Books
FREE
Study Help
Expert Questions
Accounting
General Management
Mathematics
Finance
Organizational Behaviour
Law
Physics
Operating System
Management Leadership
Sociology
Programming
Marketing
Database
Computer Network
Economics
Textbooks Solutions
Accounting
Managerial Accounting
Management Leadership
Cost Accounting
Statistics
Business Law
Corporate Finance
Finance
Economics
Auditing
Tutors
Online Tutors
Find a Tutor
Hire a Tutor
Become a Tutor
AI Tutor
AI Study Planner
NEW
Sell Books
Search
Search
Sign In
Register
study help
business
statistics informed decisions using data
Statistics Informed Decisions Using Data 5th Global Edition Michael Sullivan - Solutions
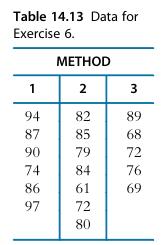
Three teaching methods were tested on a group of 18 students with homogeneous backgrounds in statistics and comparable aptitudes. Each student was randomly assigned to a method and at the end of a 6-week program was given a standardized exam. Because of classroom space, the students were not
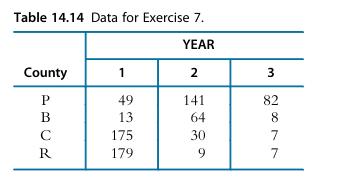
Hail damage to cotton, in pounds per planted acre, was recorded for four counties for three years. The data are shown in Table 14.14. Using years as blocks use the Friedman test to determine whether there was a difference in hail damage among the four counties. If a difference exists, determine the
A sociologist uses 10 independent variables (plus an intercept term) to predict “socioeconomic status.”(a) In a data set with n = 500, would R2 = 0.07 be “significant”?(b) Is the sociologist entitled to claim that at least one of the independent variables is related to socioeconomic
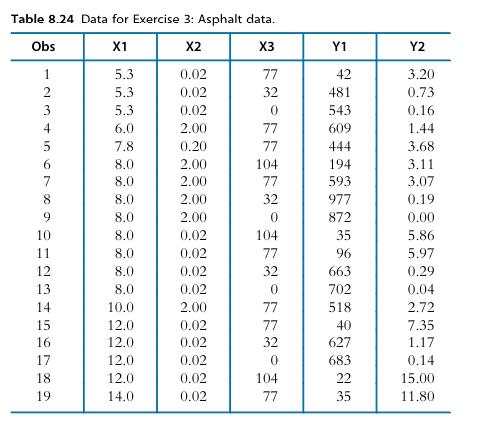
The data in Table 8.24 represent the results of a test for the strength of an asphalt concrete mix. The test consisted of applying a compressive force on the top of different sample specimens. Two responses occurred: the stress and strain at which a sample specimen failed. The factors relate to
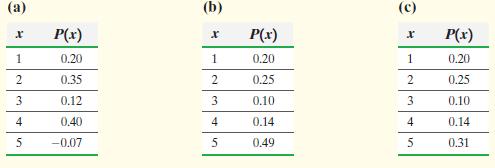
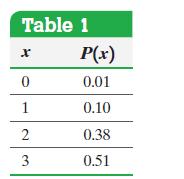
Which of the following is a discrete probability distribution?Approach In a discrete probability distribution, the sum of the probabilities must equal 1, and all probabilities must be between 0 and 1, inclusive. (a) (b) (c) 4 P(x) x P(x) x P(x) 1 0.20 1 0.20 1 0.20 2 0.35 2 0.25 2 0.25 3 0.12 3
Graph the discrete probability distribution given in Table 1 from Example 2.Approach In the graph of a discrete probability distribution, the horizontal axis represents the values of the discrete random variable and the vertical axis represents the corresponding probability of the discrete random
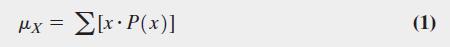
Compute the mean of the discrete random variable given in Table 1 from Example 2.Approach Find the mean of a discrete random variable by multiplying each value of the random variable by its probability and adding these products.Data from Example 2Suppose we ask a basketball player to shoot three
The basketball player from Example 2 is asked to shoot three free throws 100 times. Compute the mean number of free throws made.Approach The player shoots three free throws and the number made is recorded. We repeat this experiment 99 more times and then compute the mean number of free throws
A term life insurance policy will pay a beneficiary a certain sum of money upon the death of the policyholder. These policies have premiums that must be paid annually. Suppose an 18- year-old male buys a \($250\),000 1-year term life insurance policy for \($350\). According to the National Vital
Find the standard deviation of the discrete random variable given in Table 1 from Example 2.Approach We will use Formula (2a) with the unrounded mean μX = 2.39.Approach We will use Formula (2b) with the unrounded mean μX = 2.39.Formula 2Data from Example 2Suppose we ask a basketball player to
Use statistical software or a graphing calculator to find the mean and the standard deviation of the random variable whose distribution is given in Table 1.Approach We will use a TI-84 Plus C graphing calculator to obtain the mean and standard deviation. The steps for determining the mean and
Suppose a life insurance company sells a \($210\),000 one-year term life insurance policy to a 25-year-old female for \($220\). The probability that the female survives the year is 0.999524. Compute and interpret the expected value of this policy to the insurance company.
An investment counselor calls with a hot stock tip. He believes that if the economy remains strong, the investment will result in a profit of \($30\),000. If the economy grows at a moderate pace, the investment will result in a profit of \($10\),000.However, if the economy goes into recession, the
In the game of roulette, a player can place an \($8\) bet on the number 13 and have a 1/38 probability of winning. If the metal ball lands on 13, the player gets to keep the \($8\) paid to play the game and the player is awarded an additional \($280\).Otherwise, the player is awarded nothing and
An experimental drug is administered to 60 randomly selected individuals, with the number of individuals responding favorably recorded.Determine which of the following probability experiments represents a binomial experiment. If the probability experiment is not a binomial experiment, state why.
A basketball player who makes 81% of his free throws is asked to shoot free throws until he misses. The number of free throws attempted is recorded.Determine which of the following probability experiments represents a binomial experiment. If the probability experiment is not a binomial experiment,
An investor randomly purchases 12 stocks listed on a stock exchange. Historically, the probability that a stock listed on this exchange will increase in value over the course of a year is 50%. The number of stocks that increase in value is recorded.Determine which of the following probability
n = 20, p = 0.01, x = 2 A binomial probability experiment is conducted with the given parameters. Compute the probability of x successes in the n independent trials of the experiment.
n = 5, p = 0.55, x = 3 A binomial probability experiment is conducted with the given parameters. Compute the probability of x successes in the n independent trials of the experiment.
n = 9, p = 0.4, x ≤ 3 A binomial probability experiment is conducted with the given parameters. Compute the probability of x successes in the n independent trials of the experiment.
n = 11, p = 0.15, x ≤ 4 A binomial probability experiment is conducted with the given parameters. Compute the probability of x successes in the n independent trials of the experiment.
n = 11, p = 0.75, x ≥ 8 A binomial probability experiment is conducted with the given parameters. Compute the probability of x successes in the n independent trials of the experiment.
According to an airline, flights on a certain route are on time 75% of the time. Suppose 17 flights are randomly selected and the number of on-time flights is recorded.(a) Explain why this is a binomial experiment.(b) Find and interpret the probability that exactly 15 flights are on time.(c) Find
A poll reported that 65% of adults were satisfied with the job the major airlines were doing.Suppose 9 adults are selected at random and the number who are satisfied is recorded.(a) Explain why this is a binomial experiment.(b) Find and interpret the probability that exactly 7 of them are satisfied
According to a study done by a university student, the probability a randomly selected individual will not cover his or her mouth when sneezing is 0.267. Suppose you sit on a bench in a mall and observe people’s habits as they sneeze.(a) What is the probability that among 12 randomly observed
Fourteen jurors are randomly selected from a population of 3 million residents. Of these 3 million residents, it is known that 40% are of a minority race. Of the 14 jurors selected, 2 are minorities.(a) What proportion of the jury described is from a minority race?(b) If 14 jurors are randomly
According to an almanac, 70% of adult smokers started smoking before turning 18 years old.(a) Compute the mean and standard deviation of the random variable X, the number of smokers who started before 18 in 200 trials of the probability experiment.(b) Interpret the mean.(c) Would it be unusual to
Suppose that a recent poll found that 64% of adults believe that the overall state of moral values is poor.(a) Compute the mean and standard deviation of the random variable X, the number of adults who believe that the overall state of moral values in the United States is poor based on a random
According to another almanac, 60% of adult smokers started smoking before turning 18 years old.(a) If 300 adult smokers are randomly selected, how many would we expect to have started smoking before turning 18 years old?(b) Would it be unusual to observe 270 smokers who started smoking before
According to a survey, 21% of residents of a country 25 years old or older had earned at least a bachelor’s degree. You are performing a study and would like at least 10 people in the study to have earned at least a bachelor’s degree.(a) How many residents of the country 25 years old or older
9!Find the value of each factorial.
13!Find the value of each factorial.
11!Find the value of each factorial.
3P2 Find the value of each permutation.
6P6 Find the value of each permutation.
4P2 Find the value of each permutation.
3P3 Find the value of each permutation.
8P1 Find the value of each permutation.
18P0 Find the value of each permutation.
6P3 Find the value of each permutation.
8P4 Find the value of each permutation.
5C4 Find the value of each combination.
11C5 Find the value of each combination.
11C8 Find the value of each combination.
10C8 Find the value of each combination.
7C1 Find the value of each combination.
1C1 Find the value of each combination.
41C2 Find the value of each combination.
46C5 Find the value of each combination.
List all the permutations of three objects x, y, and z taken two at a time without repetition. What is 3P2?
List all the permutations of four objects w, x, y, and z taken two at a time without repetition. What is 4P2?
A woman has eight skirts and four blouses. Assuming that they all match, how many different skirt and- blouse combinations can she wear?
A woman has ten skirts and five blouses. Assuming that they all match, how many different skirt-and blouse combinations can she wear?
Suppose Aaron is going to burn a compact disk (CD) that will contain 11 songs. In how many ways can Aaron arrange the 11 songs on the CD?
A salesperson must travel to five cities to promote a new marketing campaign. How many different trips are possible if any route between cities is possible?
Randomly Playing Songs A certain digital music player randomly plays each of 10 songs. Once a song is played, it is not repeated until all the songs have been played. In how many different ways can the player play the 10 songs?
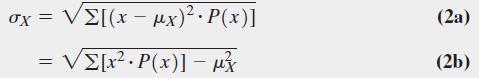
In the game show Deal or No Deal?, a contestant is presented with 26 suitcases that contain amounts ranging from $0.01 to $1,000,000. The contestant must pick an initial case that is set aside as the game progresses. The amounts are randomly distributed among the suitcases prior to the game as
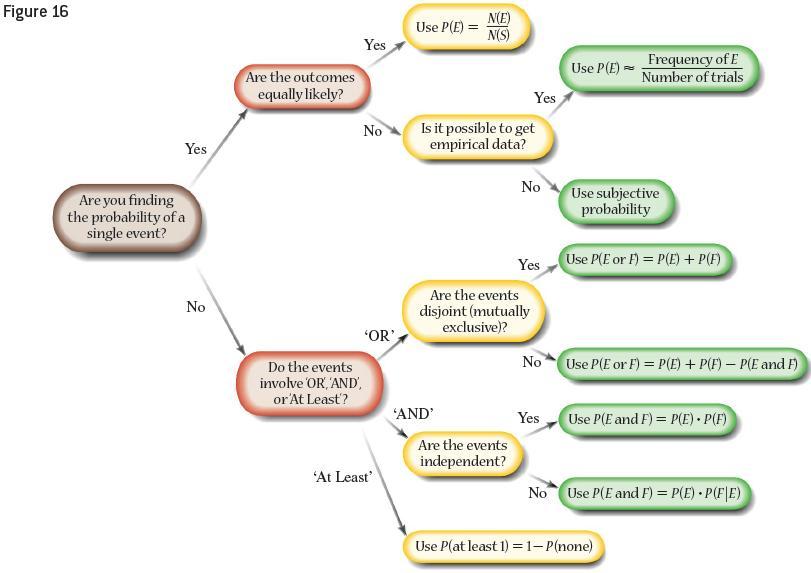
According to a Harris poll, 14% of adult Americans have one or more tattoos, 50% have pierced ears, and 65% of those with one or more tattoos also have pierced ears. What is the probability that a randomly selected adult American has one or more tattoos and pierced ears?Approach Follow the
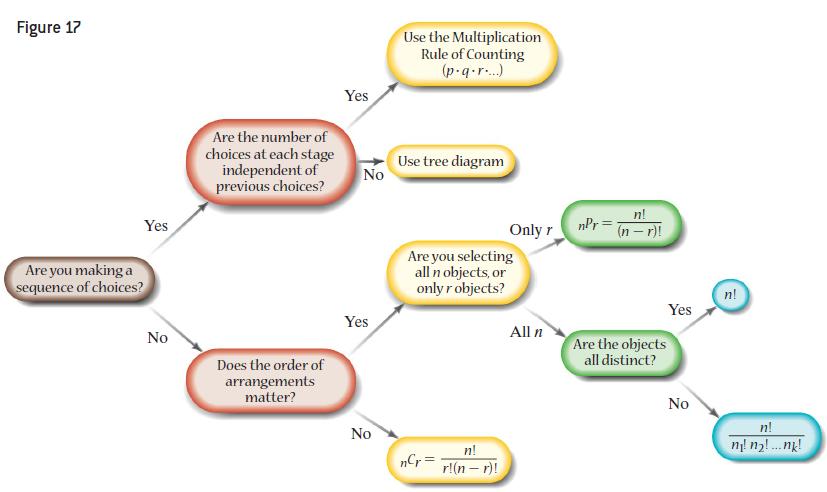
The Hazelwood city council consists of five men and four women. How many different subcommittees can be formed that consist of three men and two women?Approach Follow the flowchart in Figure 17. Figure 17 Are you making a sequence of choices? Yes Use the Multiplication Rule of Counting (p.q.r....)
The Daytona 500, the season opening NASCAR event, has 43 drivers in the race. In how many different ways could the top four finishers (first, second, third, and fourth place) occur?Approach Follow the flowchart in Figure 17. Figure 17 Are you making a sequence of choices? Yes Are the number of
E = {6, 10}.Let the sample space be S = {1, 2, 3, 4, 5, 6, 7, 8, 9, 10}. Suppose that the outcomes are equally likely. Compute the probability of the event:
E = “an odd number.”Let the sample space be S = {1, 2, 3, 4, 5, 6, 7, 8, 9, 10}. Suppose that the outcomes are equally likely. Compute the probability of the event:
6!2!/4!Evaluate each expression.
5P3 Evaluate each expression.
E = {red or blue or yellow} Let the sample space be S = {red, green, blue, orange, yellow}. Suppose that the outcomes are equally likely. Compute the probability of the event:
Suppose that P(E) = 0.76, P(F) = 0.45, and P(E and F) = 0.32. What is P(E or F)?
Suppose that there are two urns. Urn I contains four black and three white balls. Urn II contains four black, seven white, and two red balls. Suppose that we roll a fair die. If the die is a one or a two, we randomly select a ball from urn I. However, if the die is a three, four, five, or six, we
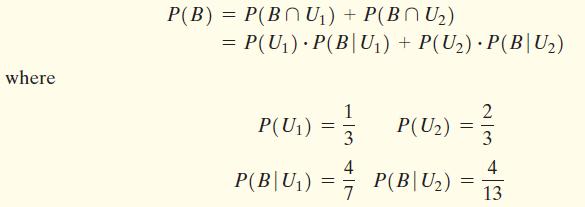
Redo Example 1 using Formula (1). Approach We will define the events as we did in Example 1. We want the probability of selecting a black ball. This can occur by selecting urn I and then selecting a black ball or by selecting urn II and then selecting a black ball. With B representing the event
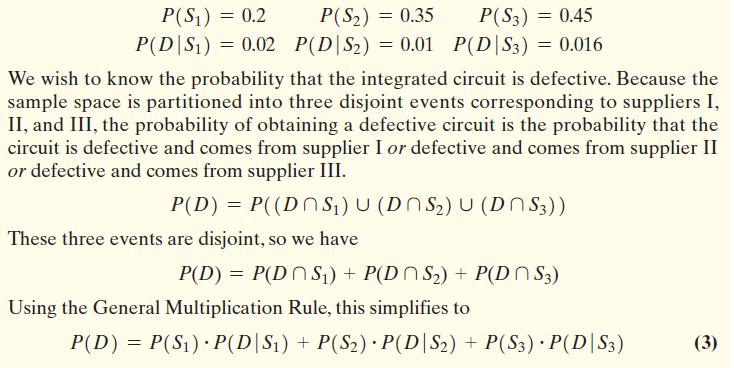
Suppose that a calculator manufacturer buys integrated circuits from three different suppliers: supplier I, supplier II, and supplier III. Based on past experience, it is known that 2% of circuits from supplier I are defective, 1% of circuits from supplier II are defective, and 1.6% of circuits
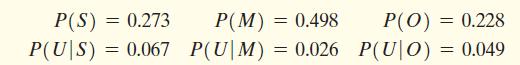
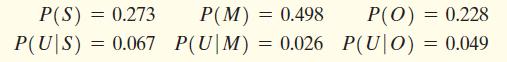
According to the U.S. Census Bureau, 27.3% of U.S. adult women have never married (single), 49.8% of U.S. adult women are married, and 22.8% of U.S. adult women are widowed, divorced, or separated (other). Of the single women, 6.7% are unemployed; of the married women, 2.6% are unemployed; of the
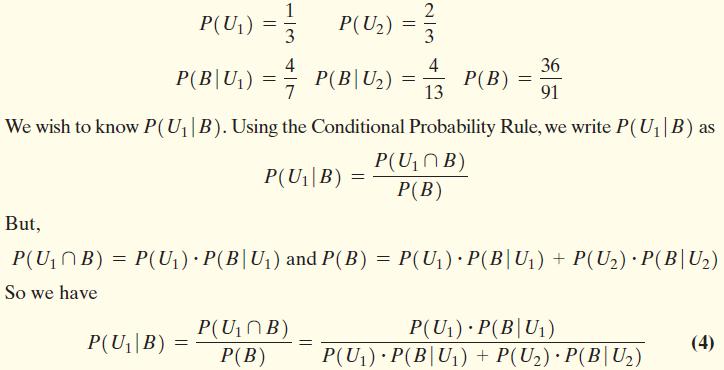
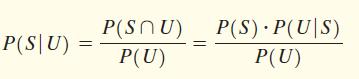
Refer to Examples 1 and 2. Suppose that a black ball was selected. What is the probability that the black ball came from urn I?Approach We know that P(U) = 1 P(U) = 3 4 P(B|U) = P(B|U2) 23 4 = P(B) = 13 36 91 We wish to know P(U|B). Using the Conditional Probability Rule, we write P(U|B) as P(U|B)
According to the U.S. Census Bureau, 27.3% of U.S. adult women have never married (single), 49.8% of U.S. adult women are married, and 22.8% of U.S. adult women are widowed, divorced, or separated (other). Of the single women, 6.7% are unemployed; of the married women, 2.6% are unemployed; of the
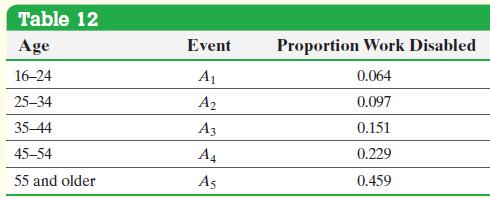
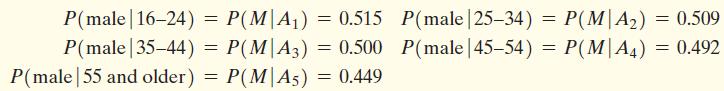
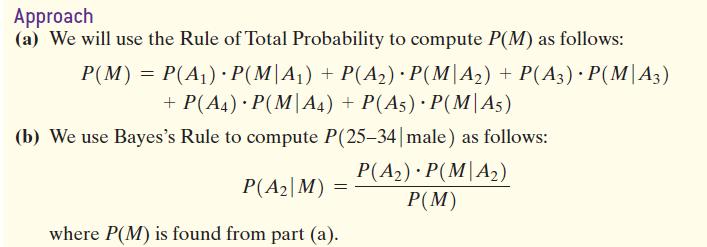
Persons are classified as work disabled if they have a health problem that prevents them from working in the type of work they can do. Table 12 on the next page contains the proportion, by age, of Americans who are 16 years of age or older who are work disabled.If we let M represent the event that
Suppose that S is a sample space. What would it mean to partition S into three disjoint subsets A1, A2, and A3? Draw a figure to help support your explanation.
What must be true regarding the sum of the probability of events that make up the partitions of the sample space?
Describe the Rule of Total Probability in your own words.
What is the difference between a priori and a posteriori probabilities? Which is Bayes’s Rule used for?
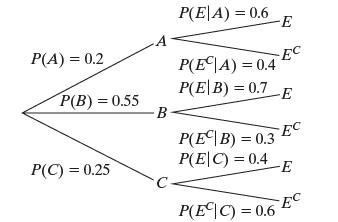
P(E|A)Find the indicated probabilities by referring to the given tree diagram and by using Bayes’s Rule. A P(A) = 0.2 P(E|A)=0.6 E P(ECA) = 0.4 -EC P(B) = 0.55 P(E|B)=0.7 -E B EC P(E|B) = 0.3 P(C) = 0.25 P(E|C)=0.4 E EC P(ECC)=0.6
P(E|B)Find the indicated probabilities by referring to the given tree diagram and by using Bayes’s Rule. A P(A) = 0.2 P(E|A)=0.6 E P(ECA) = 0.4 -EC P(B) = 0.55 P(E|B)=0.7 -E B EC P(E|B) = 0.3 P(C) = 0.25 P(E|C)=0.4 E EC P(ECC)=0.6
P(Ec|A) Find the indicated probabilities by referring to the given tree diagram and by using Bayes’s Rule. A P(A) = 0.2 P(E|A)=0.6 E P(ECA) = 0.4 -EC P(B) = 0.55 P(E|B)=0.7 -E B EC P(E|B) = 0.3 P(C) = 0.25 P(E|C)=0.4 E EC P(ECC)=0.6
P(Ec|B)Find the indicated probabilities by referring to the given tree diagram and by using Bayes’s Rule. A P(A) = 0.2 P(E|A)=0.6 E P(ECA) = 0.4 -EC P(B) = 0.55 P(E|B)=0.7 -E B EC P(E|B) = 0.3 P(C) = 0.25 P(E|C)=0.4 E EC P(ECC)=0.6
P(E|C)Find the indicated probabilities by referring to the given tree diagram and by using Bayes’s Rule. A P(A) = 0.2 P(E|A)=0.6 E P(ECA) = 0.4 -EC P(B) = 0.55 P(E|B)=0.7 -E B EC P(E|B) = 0.3 P(C) = 0.25 P(E|C)=0.4 E EC P(ECC)=0.6
P(Ec|C) Find the indicated probabilities by referring to the given tree diagram and by using Bayes’s Rule. A P(A) = 0.2 P(E|A)=0.6 E P(ECA) = 0.4 -EC P(B) = 0.55 P(E|B)=0.7 -E B EC P(E|B) = 0.3 P(C) = 0.25 P(E|C)=0.4 E EC P(ECC)=0.6
P(E)Find the indicated probabilities by referring to the given tree diagram and by using Bayes’s Rule. A P(A) = 0.2 P(E|A)=0.6 E P(ECA) = 0.4 -EC P(B) = 0.55 P(E|B)=0.7 -E B EC P(E|B) = 0.3 P(C) = 0.25 P(E|C)=0.4 E EC P(ECC)=0.6
P(Ec) Find the indicated probabilities by referring to the given tree diagram and by using Bayes’s Rule. A P(A) = 0.2 P(E|A)=0.6 E P(ECA) = 0.4 -EC P(B) = 0.55 P(E|B)=0.7 -E B EC P(E|B) = 0.3 P(C) = 0.25 P(E|C)=0.4 E EC P(ECC)=0.6
P(A|E)Find the indicated probabilities by referring to the given tree diagram and by using Bayes’s Rule. A P(A) = 0.2 P(E|A)=0.6 E P(ECA) = 0.4 -EC P(B) = 0.55 P(E|B)=0.7 -E B EC P(E|B) = 0.3 P(C) = 0.25 P(E|C)=0.4 E EC P(ECC)=0.6
P(A|Ec)Find the indicated probabilities by referring to the given tree diagram and by using Bayes’s Rule. A P(A) = 0.2 P(E|A)=0.6 E P(ECA) = 0.4 -EC P(B) = 0.55 P(E|B)=0.7 -E B EC P(E|B) = 0.3 P(C) = 0.25 P(E|C)=0.4 E EC P(ECC)=0.6
P(C|E) Find the indicated probabilities by referring to the given tree diagram and by using Bayes’s Rule. A P(A) = 0.2 P(E|A)=0.6 E P(ECA) = 0.4 -EC P(B) = 0.55 P(E|B)=0.7 -E B EC P(E|B) = 0.3 P(C) = 0.25 P(E|C)=0.4 E EC P(ECC)=0.6
P(B|Ec)Find the indicated probabilities by referring to the given tree diagram and by using Bayes’s Rule. A P(A) = 0.2 P(E|A)=0.6 E P(ECA) = 0.4 -EC P(B) = 0.55 P(E|B)=0.7 -E B EC P(E|B) = 0.3 P(C) = 0.25 P(E|C)=0.4 E EC P(ECC)=0.6
P(B|E)Find the indicated probabilities by referring to the given tree diagram and by using Bayes’s Rule. A P(A) = 0.2 P(E|A)=0.6 E P(ECA) = 0.4 -EC P(B) = 0.55 P(E|B)=0.7 -E B EC P(E|B) = 0.3 P(C) = 0.25 P(E|C)=0.4 E EC P(ECC)=0.6
P(C|Ec)Find the indicated probabilities by referring to the given tree diagram and by using Bayes’s Rule. A P(A) = 0.2 P(E|A)=0.6 E P(ECA) = 0.4 -EC P(B) = 0.55 P(E|B)=0.7 -E B EC P(E|B) = 0.3 P(C) = 0.25 P(E|C)=0.4 E EC P(ECC)=0.6
Suppose that events A1 and A2 form a partition of the sample space S with P(A1) = 0.55 and P(A2) = 0.45. If E is an event that is a subset of S and P(E|A1) = 0.06 and P(E|A2) = 0.08, find P(E).
Suppose that events A1 and A2 form a partition of the sample space S with P(A1) = 0.35 and P(A2) = 0.65. If E is an event that is a subset of S and P(E|A1) = 0.12 and P(E|A2) = 0.09, find P(E).
Suppose that events A1, A2, and A3 form a partition of the sample space S with P(A1) = 0.35, P(A2) = 0.45, and P(A3) = 0.2. If E is an event that is a subset of S and P(E|A1) = 0.25, P(E|A2) = 0.18, and P(E|A3) = 0.14, find P(E).
Suppose that events A1, A2, and A3 form a partition of the sample space S with P(A1) = 0.3, P(A2) = 0.65, and P(A3) = 0.05. If E is an event that is a subset of S and P(E|A1) = 0.05,P(E|A2) = 0.25, and P(E|A3) = 0.5, find P(E).
Use the information given in Problem 21 to find:(a) P(A1|E)(b) P(A2|E)Data from Problem 21Suppose that events A1 and A2 form a partition of the sample space S with P(A1) = 0.55 and P(A2) = 0.45. If E is an event that is a subset of S and P(E|A1) = 0.06 and P(E|A2) = 0.08, find P(E).
Use the information given in Problem 22 to find:(a) P(A1|E)(b) P(A2|E)Data from Problem 22Suppose that events A1 and A2 form a partition of the sample space S with P(A1) = 0.35 and P(A2) = 0.65. If E is an event that is a subset of S and P(E|A1) = 0.12 and P(E|A2) = 0.09, find P(E).
Use the information given in Problem 23 to find:(a) P(A1|E)(b) P(A2|E)(c) P(A3|E)Data from Problem 23Suppose that events A1, A2, and A3 form a partition of the sample space S with P(A1) = 0.35, P(A2) = 0.45, and P(A3) = 0.2. If E is an event that is a subset of S and P(E|A1) = 0.25, P(E|A2) = 0.18,
Use the information given in Problem 24 to find:(a) P(A1|E)(b) P(A2|E)(c) P(A3|E)Data from Problem 24Suppose that events A1, A2, and A3 form a partition of the sample space S with P(A1) = 0.3, P(A2) = 0.65, and P(A3) = 0.05. If E is an event that is a subset of S and P(E|A1) = 0.05,P(E|A2) = 0.25,
Urn I contains five black and seven white balls. Urn II contains six black, five white, and three red balls. Roll a fair die.If the die is a one, three, or five, randomly select a ball from urn I. However, if the die is a two, four, or six, randomly select a ball from urn II.(a) Determine the
Showing 5000 - 5100
of 5564
First
42
43
44
45
46
47
48
49
50
51
52
53
54
55
56
Step by Step Answers