New Semester
Started
Get
50% OFF
Study Help!
--h --m --s
Claim Now
Question Answers
Textbooks
Find textbooks, questions and answers
Oops, something went wrong!
Change your search query and then try again
S
Books
FREE
Study Help
Expert Questions
Accounting
General Management
Mathematics
Finance
Organizational Behaviour
Law
Physics
Operating System
Management Leadership
Sociology
Programming
Marketing
Database
Computer Network
Economics
Textbooks Solutions
Accounting
Managerial Accounting
Management Leadership
Cost Accounting
Statistics
Business Law
Corporate Finance
Finance
Economics
Auditing
Tutors
Online Tutors
Find a Tutor
Hire a Tutor
Become a Tutor
AI Tutor
AI Study Planner
NEW
Sell Books
Search
Search
Sign In
Register
study help
business
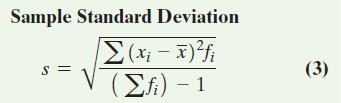
statistics informed decisions using data
Statistics Informed Decisions Using Data 5th Global Edition Michael Sullivan - Solutions
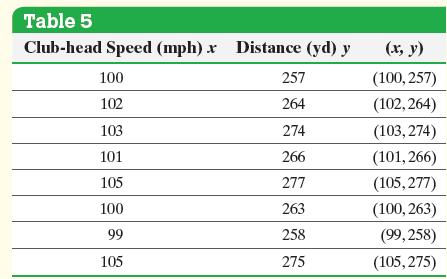
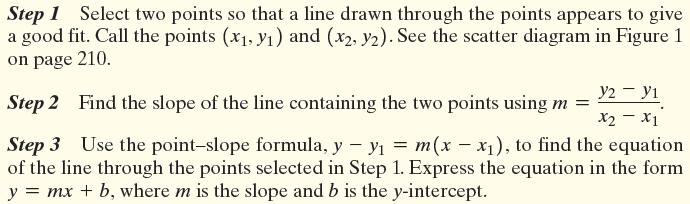
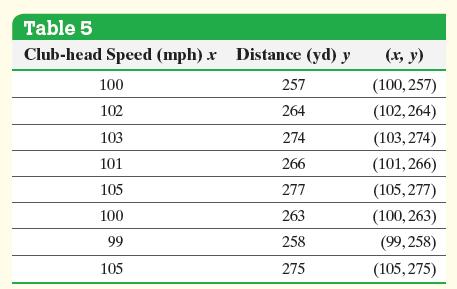
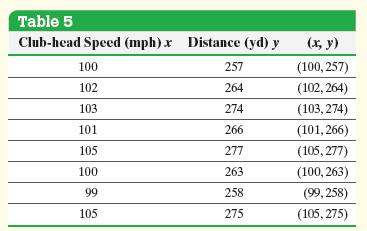
The data in Table 5 represent the club-head speed and the distance a golf ball travels for eight swings of the club. We found that these data are linearly related .(a) Find a linear equation that relates club-head speed, x (the explanatory variable), and distance, y (the response variable), by
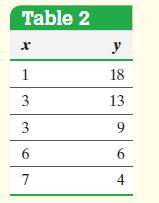
Find the least-squares regression line for the data in Table 2 from Section 4.1.Approach We foundSubstitute the values in Formulas (2) and (3) to find the slope and intercept of the least-squares regression line.Data from Table 2 section 4.1Formulas r = -0.946, x = 4, sx = 2.44949, y = 10, and sy =
Use the golf data in Table 5.(a) Find the least-squares regression line.(b) Draw the least-squares regression line on the scatter diagram of the data.(c) Predict the distance a golf ball will travel when hit with a club-head speed of 103 miles per hour (mph).(d) Determine the residual for the
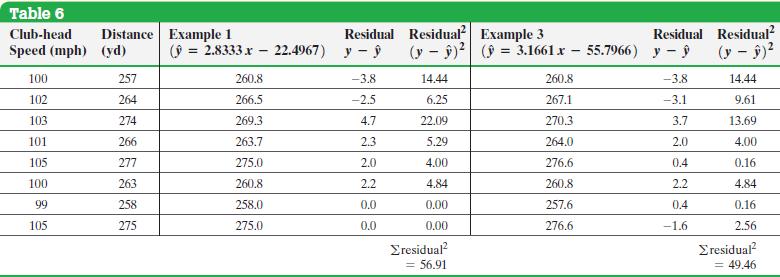
Compare the sum of squared residuals for the lines in Examples 1 and 3.Approach Use a table to compute ∑residuals2 using the predicted values of y, ŷ, for the equations in Examples 1 and 3.Data from Example 1The data in Table 5 represent the club-head speed and the distance a golf ball travels
Determine and interpret the coefficient of determination, R2, for the clubhead speed versus distance data shown in Table 5 on page 225.By Hand ApproachTo compute R2, we square the linear correlation coefficient, r.Technology Approach We will use Excel to determine R2. The steps for obtaining the
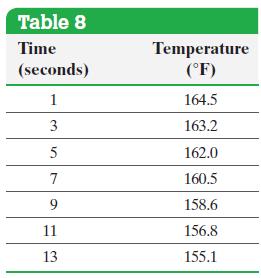
The data in Table 8 were collected by placing a temperature probe in a portable heater, removing the probe, and recording the temperature (in degrees Fahrenheit) over time (in seconds). Determine whether the relation between the temperature of the probe and time is linear.Approach Find the
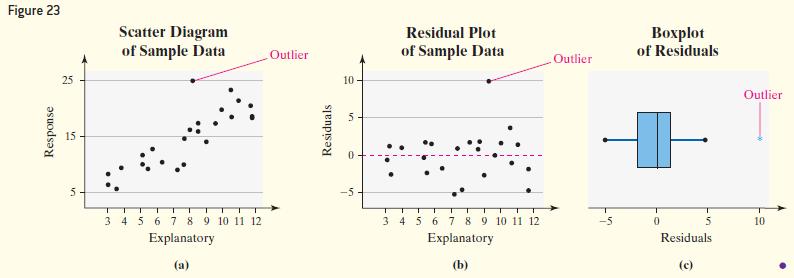
Figure 23(a) shows a scatter diagram of a set of data. The residual plot is shown in Figure 23(b) and the boxplot of the residuals is in Figure 23(c). Do the data have any outliers?Approach We examine the residual plot and boxplot for outliers. Figure 23 Scatter Diagram of Sample Data Outlier 25 10
The data in Table 6 on page 232 represent the club-head speed, the distance the golf ball traveled, and the residuals (Column 7) for eight swings of a golf club. Construct a residual plot and boxplot of the residuals and comment on the appropriateness of the least-squares regression model.Approach
Suppose that our golf ball experiment calls for nine trials, but the player that we are using hurts his wrist. Luckily, Bubba Watson is practicing on the same range and graciously agrees to participate in our experiment. His club-head speed is 120 miles per hour and he hits the golf ball 305 yards.
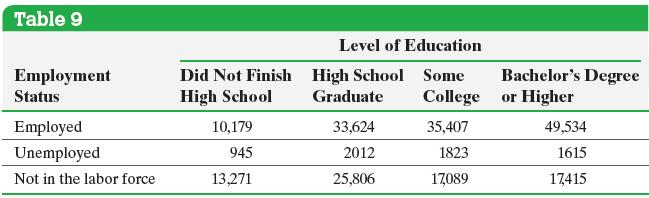
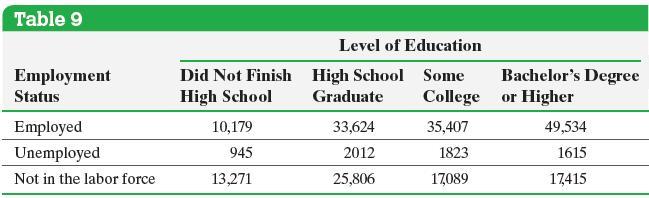
Find the frequency marginal distributions for employment status and level of education from the data in Table 9.Approach Find the row total for the category “employed” by adding the number of employed individuals who did not finish high school, who finished high school, and so on. Repeat this
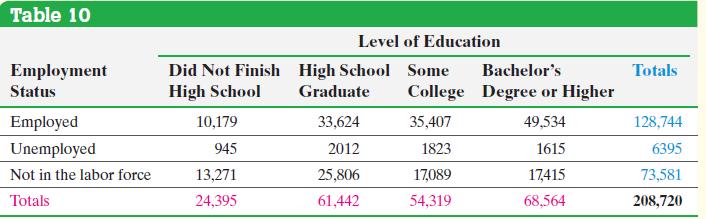
Determine the relative frequency marginal distribution for level of education and employment status from the data in Table 10.Approach The relative frequency marginal distribution for the row variable, employment status, is found by dividing the row total for each employment status by the table
What proportion of the following groups of individuals is employed?(a) Those who did not finish high school (b) High school graduates(c) Those who finished some college (d) Those who have at least a bachelor’s degreeApproach In part (a), we are asking, “Of the individuals who did not finish
Find the conditional distribution of the response variable employment status by level of education, the explanatory variable, for the data in Table 9 on page 253.What is the association between level of education and employment status?Approach First compute the relative frequency for each
Using the results of Example 4, draw a bar graph that represents the conditional distribution of employment status by level of education.Approach When drawing conditional bar graphs, label the values of the explanatory variable on the horizontal axis, and use different colored bars for each value
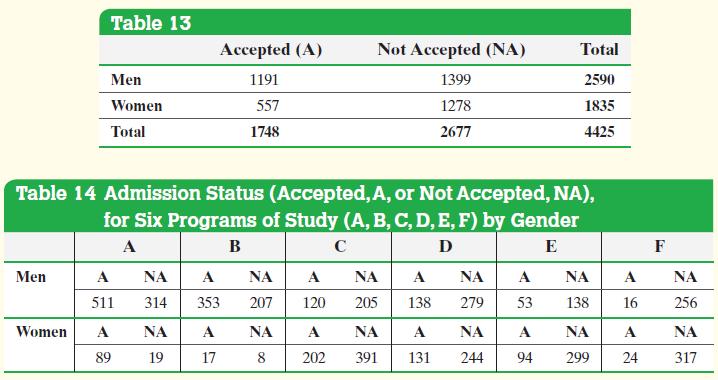
The data in Table 13 show the admission status and gender of students who applied to the University of California, Berkeley. From the data in Table 13, the proportion of accepted applications is 1748/4425 = 0.395. The proportion of accepted men is 1191/2590 = 0.460 and the proportion of accepted
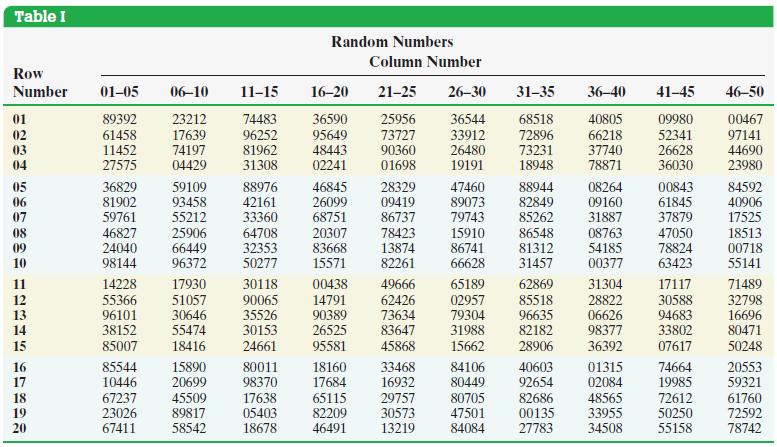
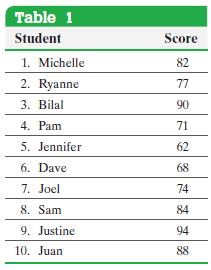
The data in Table 1 represent the first exam score of 10 students enrolled in Introductory Statistics. Treat the 10 students as a population.(a) Compute the population mean.(b) Find a simple random sample of size n = 4 students.(c) Compute the sample mean of the sample found in part (b).Approach(a)
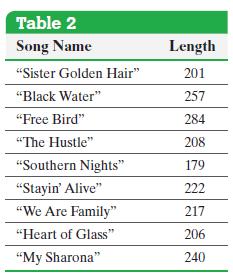
The data in Table 2 represent the length (in seconds) of a random sample of songs released in the 1970s. Find the median length of the songs.Approach Follow the steps listed above. Table 2 Song Name Length "Sister Golden Hair" 201 "Black Water" 257 "Free Bird" 284 "The Hustle" 208 "Southern Nights"
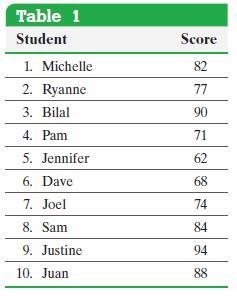
Find the median score of the data in Table 1.Approach Follow the steps listed on the previous page. Table 1 Student Score 1. Michelle 82 2. Ryanne 77 3. Bilal 90 4. Pam 71 5. Jennifer 62 6. Dave 68 7. Joel 74 8. Sam 84 9. Justine 94 10. Juan 88
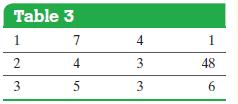
Yolanda wants to know how much time she typically spends on her cell phone. She goes to her phone’s website and records the call length for a random sample of 12 calls, shown in Table 3. Find the mean and median length of a cell phone call. Which measure of central tendency better describes the
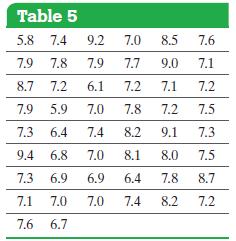
The data in Table 5 represent the birth weights (in pounds) of 50 randomly sampled babies.(a) Find the mean and the median birth weight.(b) Describe the shape of the distribution.(c) Which measure of central tendency better describes the average birth weight?Approach(a) This can be done either by
The following data represent the number of O-ring failures on the shuttle Columbia for its 17 flights prior to its fatal flight:0, 0, 0, 0, 0, 0, 0, 0, 0, 0, 0, 1, 1, 1, 1, 2, 3 Find the mode number of O-ring failures.Approach Tally the number of times we observe each data value. The data value
Find the mode of the exam score data listed in Table 1, which is repeated here:82, 77, 90, 71, 62, 68, 74, 84, 94, 88Approach Tally the number of times we observe each data value. The data value with the highest frequency is the mode.
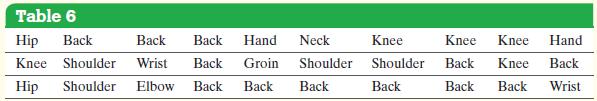
The data in Table 6 represent the location of injuries that required rehabilitation by a physical therapist. Determine the mode location of injury.Approach Determine the location of injury that occurs with the highest frequency. Table 6 Hip Back Back Back Hand Neck Knee Knee Knee Hand Knee
Sample: 25, 14, 1, 5, 10 Find the population mean or sample mean as indicated.
Population: 2, 5, 15, 16, 12 Find the population mean or sample mean as indicated.
For a large sporting event, broadcasters sold 66 ad slots for a total revenue of $164 million. What was the mean price per ad slot?
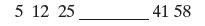
The median for the given set of six ordered data values is 30.5.What is the missing value? 5 12 25 41 58
An insurance company crashed four cars of the same model at 5 miles per hour. The cost of repair for each of the four crashes was \($434\), \($413\), \($452\), and \($241\). Compute the mean, median, and mode cost of repair.
The following data represent the amount of time (in minutes) a random sample of eight students took to complete the online portion of an exam in a particular statistics course.Compute the mean, median, and mode time.68.7, 75.8, 89.8, 106.7, 128.4, 99.4, 94.7, 117.5
A concrete mix is designed to withstand 3000 pounds per square inch (psi) of pressure. The following data represent the strength of nine randomly selected casts (in psi). 3950, 4080, 3300, 3100, 2950, 3840, 4080, 4050, 3590 Compute the mean, median and mode strength of the concrete (in psi).
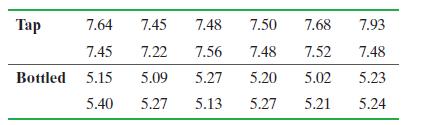
The acidity or alkalinity of a solution is measured using pH. A pH less than 7 is acidic; a pH greater than 7 is alkaline. The accompanying data represent the pH in samples of bottled water and tap water.(a) Determine the mean, median, and mode pH for each type of water. Comment on the differences
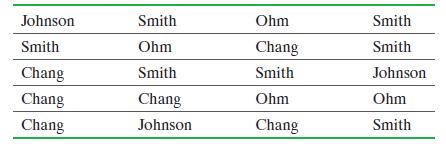
A sample of 20 registered voters was surveyed in which the respondents were asked, “Do you think Chang, Johnson, Ohm, or Smith is most qualified to be a senator?” The results of the survey are shown in the table.(a) Determine the mode candidate.(b) Do you think it would be a good idea to rotate
Mr. Zuro finds the mean height of all 15 students in his statistics class to be 67.0 inches. Just as Mr. Zuro finishes explaining how to get the mean, Danielle walks in late. Danielle is 63.8 inches tall. What is the mean height of the 16 students in the class?
Missing Exam Grade A professor has recorded exam grades for 20 students in his class, but one of the grades is no longer readable. If the mean score on the exam was 80 and the mean of the 19 readable scores is 84, what is the value of the unreadable score?
In January 2015, the mean amount of money lost per visitor to a local riverboat casino was $135. Do you think the median was more than, less than, or equal to this amount? Why?
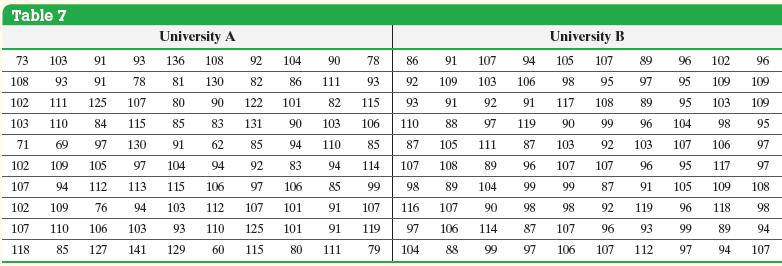
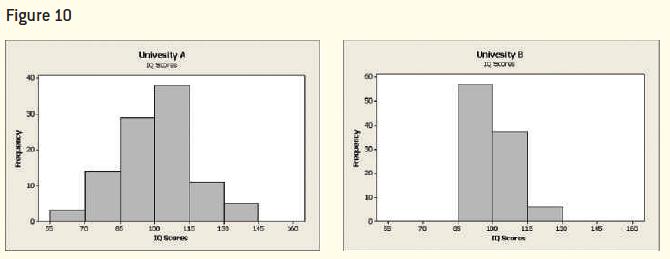
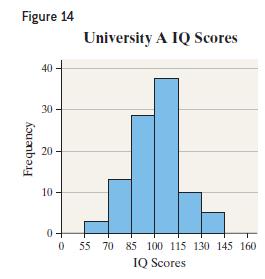
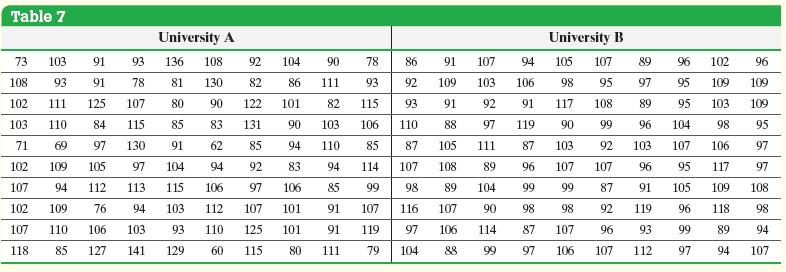
The data in Table 7 represent the IQ scores of a random sample of 100 students from two different universities. For each university, compute the mean IQ score and draw a histogram using a lower class limit of 55 for the first class and a class width of 15. Comment on the results.Approach We will
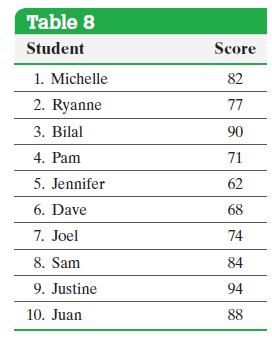
The data in Table 8 represent the scores on the first exam of 10 students enrolled in Introductory Statistics. Compute the range.Approach The range is the difference between the largest and smallest data values. Table 8 Student Score 1. Michelle 82 2. Ryanne 77 3. Bilal 90 4. Pam 71 5. Jennifer 62
Compute the population standard deviation of the test scores in Table 8.Approach Using Formula (1)Step 1 Create a table with four columns. Enter the population data in Column 1. In Column 2, enter the population mean.Step 2 Compute the deviation about the mean for each data value, xi - μ. Enter
Compute the sample standard deviation of the sample obtained in Example 1 (b) from Section 3.1.Approach We follow the same approach that we used to compute the population standard deviation, but this time using the sample data. In looking back at Example 1(b) from Section 3.1, we see that Jennifer
Use statistical software or a calculator to determine the population standard deviation of the data listed in Table 8 and the sample standard deviation of the sample data from Example 4.Approach We will use a TI-84 Plus C graphing calculator. The steps for determining the standard deviation using
Refer to the data in Example 1. Use the standard deviation to determine whether University A or University B has more dispersion in its students’ IQ scores.Approach We will use Minitab to determine the standard deviation of IQ for each university. The university with the higher standard deviation
Use the results of Examples 3 and 4 to determine the population and sample variance of test scores on the statistics exam.Approach The population variance is found by squaring the population standard deviation. The sample variance is found by squaring the sample standard deviation.Data from Example
Use the data from University A in Table 7.(a) Determine the percentage of students who have IQ scores within 3 standard deviations of the mean according to the Empirical Rule.(b) Determine the percentage of students who have IQ scores between 67.8 and 132.2 according to the Empirical Rule.(c)
Use the data from University A in Table 7.(a) Determine the minimum percentage of students who have IQ scores within 3 standard deviations of the mean according to Chebyshev’s Inequality.(b) Determine the minimum percentage of students who have IQ scores between 67.8 and 132.2, according to
Sample: 23, 12, 6, 8, 9 By hand, find the population variance and standard deviation or the sample variance and standard deviation as indicated.
Sample: 4, 13, 25, 31, 37 By hand, find the population variance and standard deviation or the sample variance and standard deviation as indicated.
Sample: 4, 46, 14, 51, 32, 23, 28, 30, 36, 27 By hand, find the population variance and standard deviation or the sample variance and standard deviation as indicated.
An insurance company crashed four cars in succession at 5 miles per hour. The cost of repair for each of the four crashes was \($422\), \($454\), \($419\), \($215\). Compute the range, sample variance, and sample standard deviation cost of repair.
Compute the range and sample standard deviation for the strength of this concrete (in psi).3930, 4080, 3500, 3000, 2950, 3870, 4080, 4040
The following data represent the flight time (in minutes) of a random sample of seven flights from one city to another city.284, 270, 260, 266, 257, 263, 269 Compute the range and sample standard deviation of flight time.
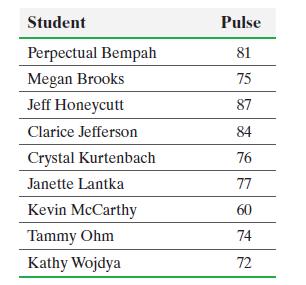
The accompanying data represent the pulse rates (beats per minute) of nine students enrolled in a statistics course. Treat the nine students as a population.(a) Compute the population standard deviation.(b) Determine the sample standard deviation of the following three simple random samples of size
IQ Test Scores in an IQ test have a bell-shaped distribution with a mean of 100 and a standard deviation of 19.(a) What percentage of people has an IQ score between 62 and 138?(b) What percentage of people has an IQ score less than 81 or greater than 119?(c) What percentage of people has an IQ
A certain standardized test’s math scores have a bell-shaped distribution with a mean of 520 and a standard deviation of 119.(a) What percentage of standardized test scores is between 401 and 639?(b) What percentage of standardized test scores is less than 401 or greater than 639?(c) What
The weight of an organ in adult males has a bell-shaped distribution with a mean of 300 grams and a standard deviation of 45 grams.(a) About 99.7% of organs will be between what weights?(b) What percentage of organs weighs between 255 grams and 345 grams?(c) What percentage of organs weighs less
Commuting to Work The mean of the commute time to work for a resident of a certain city is 28.8 minutes. Assume that the standard deviation of the commute time is 7.1 minutes to complete parts (a) through (c).(a) What minimum percentage of commuters in the city has a commute time within 2 standard
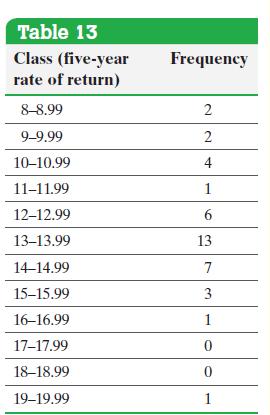
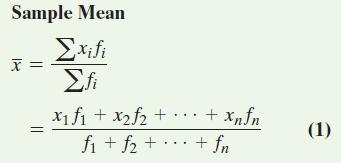
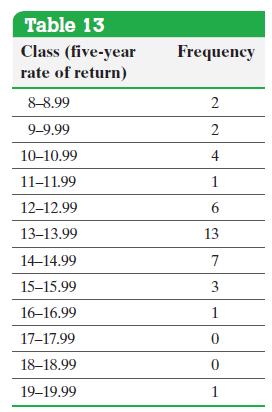
The frequency distribution in Table 13 represents the five-year rate of return of a random sample of 40 large-blended mutual funds. Approximate the mean fiveyear rate of return.Approach Step 1 Determine the class midpoint of each class by adding consecutive lower class limits and dividing the
Marissa just completed her first semester in college. She earned an A in her four-hour statistics course, a B in her three-hour sociology course, an A in her three hour psychology course, a C in her five-hour computer programming course, and an A in her one-hour drama course. Determine Marissa’s
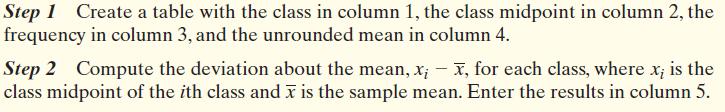
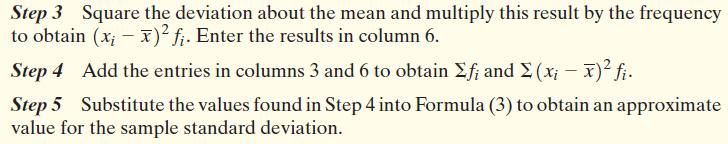
The data in Table 13 represent the five-year rate of return of a random sample of 40 large-blended mutual funds. Approximate the standard deviation of the five-year rate of return.Approach Use the sample standard deviation Formula (3). Step 1 Create a table with the class in column 1, the class
Approximate the mean and standard deviation of the five-year rate of return data in Table 13 using a TI-84 Plus C graphing calculator.Approach The steps for approximating the mean and standard deviation of grouped data using the TI-83/84 Plus graphing calculator and StatCrunch are given in the
Clarissa has just completed her second semester in college. She earned a grade of B in her 4-hour linear algebra course, a grade A in her 2-hour government course, a grade of D in her 3-hour physics course, and a grade of C in her 5-hour speech-writing course. Assuming that A equals 4 points, B
In Marissa’s calculus course, attendance counts for 5% of the grade, quizzes count for 20% of the grade, exams count for 60% of the grade, and the final exam counts for 15% of the grade. Marissa had a 100% for attendance, 93% for quizzes, 86% for exams, and 85% on the final. Determine Marissa’s
Stan and Francine want to make perfume. In order to get the right balance of ingredients for their tastes, they bought 3 ounces of rose oil at \($2.04\) per ounce, 5 ounces of ginger essence for \($2.86\) per ounce, and 5 ounces of black currant essence for \($2.19\) per ounce. Determine the cost
Determine whether the Los Angeles Angels or the Colorado Rockies had a relatively better run-producing season. The Angels scored 773 runs and play in the American League, where the mean number of runs scored was μ = 677.4 and the standard deviation was σ = 51.7 runs. The Rockies scored 755 runs
Jennifer just received the results of her SAT exam. Her SAT Mathematics score of 600 is in the 74th percentile. What does this mean?Approach The kth percentile of an observation means that k percent of the observations are less than or equal to the observation.
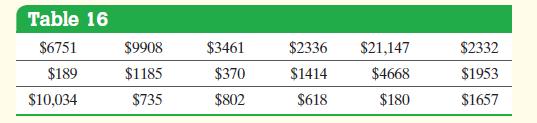
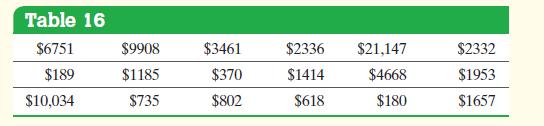
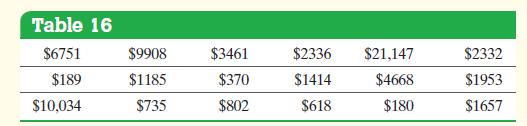
The Highway Loss Data Institute routinely collects data on collision coverage claims. Collision coverage insures against physical damage to an insured individual’s vehicle. The data in Table 16 represent a random sample of 18 collision coverage claims based on data obtained from the Highway Loss
Find the quartiles of the collision coverage claims data in Table 16.Approach Use both StatCrunch and Minitab to obtain the quartiles. The steps for obtaining quartiles using a TI-83/84 Plus graphing calculator, Minitab, Excel, and StatCrunch are given in the Technology Step-by-Step. Table 16 $6751
Determine and interpret the interquartile range of the collision claim data from Example 3.Approach Use the quartiles found by hand in Example 3. The interquartile range, IQR, is found by computing the difference between the third and first quartiles. It represents the range of the middle 50% of
Check the collision coverage claims data in Table 16 for outliers.Approach Follow the preceding steps. Any data value that is less than the lower fence or greater than the upper fence will be considered an outlier. Table 16 $6751 $9908 $3461 $2336 $21,147 $2332 $189 $1185 $370 $1414 $4668 $1953
In a certain city, the average 20 to 29 year old man is 69.8 inches tall, with a standard deviation of 3.0 inches, while the average 20 to 29 year old woman is 64.3 inches tall, with a standard deviation of 3.8 inches. Who is relatively taller, a 75-inch man or a 70-inch woman?
The mean finish time for a yearly amateur auto race was 185.13 minutes with a standard deviation of 0.353 minute. The winning car, driven by Perry, finished in 184.77 minutes.The previous year’s race had a mean finishing time of 111.1 with a standard deviation of 0.106 minute. The winning car
Explain the meaning of the following percentiles.(a) The 10th percentile of the weight of males 36 months of age in a certain 10 city is 12.0 kg.(b) The 95th percentile of the length of newborn females in a certain city is 53.3 cm.
Quartiles Violent crimes include rape, robbery, assault, and homicide. The following is a summary of the violent-crime rate (violent crimes per 100,000 population) for all states of a country in a certain year.Q1 = 272.8 Q2 = 387.9 Q3 = 528.3(a) Provide an interpretation of these results.(b)
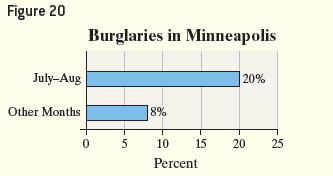
A home security company located in Minneapolis, Minnesota, develops a summer ad campaign with the slogan “When you leave for vacation, burglars leave for work.” According to the city of Minneapolis, roughly 20% of home burglaries occur during the peak vacation months of July and August. The
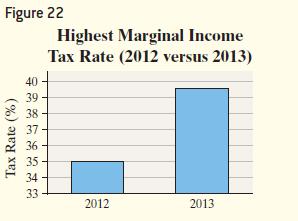
A national news organization developed the graphic shown in Figure 22 to illustrate the change in the highest marginal tax rate effective January 1, 2013. Why might this graph be considered misleading?Approach We need to find any characteristics that may mislead a reader, such as manipulation of
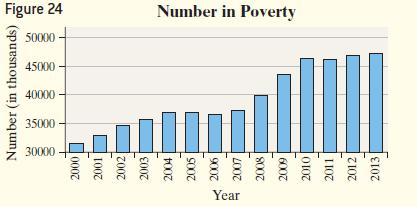
The time-series graph in Figure 24 depicts the number of residents in the United States living in poverty. Why might this graph be considered misrepresentative?Approach Look for any characteristics that may mislead a reader, such as manipulation of the vertical scale. Figure 24 Number (in
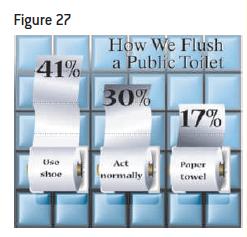
The bar graph illustrated in Figure 27 is a USA Today-type graph. A survey was conducted by Impulse Research for Quilted Northern Confidential in which individuals were asked how they would flush a toilet when the facilities are not sanitary.What’s wrong with the graphic?Approach Compare the
Soccer continues to grow in popularity as a sport in the United States. High-profile players such as Hope Solo and Landon Donovan have helped generate renewed interest in the sport at various age levels. In 1991, there were approximately 10 million participants in the United States aged 7 years or
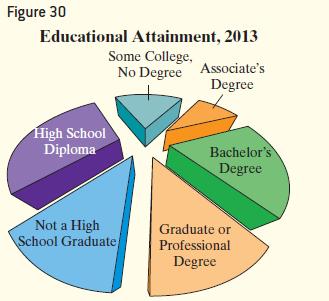
Figure 30 represents the educational attainment (level of education) in 2013 of adults 25 years and older who are U.S. residents. Why might this graph be considered misrepresentative.Approach Find any characteristics that may mislead a reader, such as overemphasis on one category of data. Figure 30
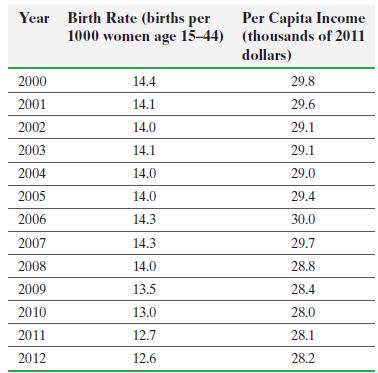
The data below shows birth rate and per capita income (in thousands of 2011 dollars) from 2000 through 2012. Draw a time-series plot for both birth rate and per capita income. Comment on any similarities in the trends. Year Birth Rate (births per 1000 women age 15-44) Per Capita Income (thousands
Determine whether the following variables are qualitative or quantitative.(a) Gender(b) Temperature(c) Number of days during the past week that a college student studied(d) Zip codeApproach Quantitative variables are numerical measures such that meaningful arithmetic operations can be performed on
Determine whether the quantitative variables are discrete or continuous.(a) The number of heads obtained after flipping a coin five times.(b) The number of cars that arrive at a McDonald’s drive-thru between 12:00 p.m. and 1:00 p.m.(c) The distance a 2014 Toyota Prius can travel in city driving
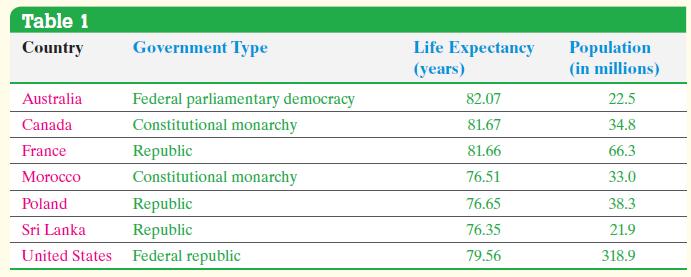
Table 1 presents a group of selected countries and information regarding these countries as of July, 2014. Identify the individuals, variables, and data in Table 1.ApproachAn individual is an object or person for whom we wish to obtain data. The variables are the characteristics of the individuals,
For each of the following variables, determine the level of measurement.(a) Gender(b) Temperature(c) Number of days during the past week that a college student studied(d) Letter grade earned in your statistics classApproach For each variable, we ask the following: Does the variable simply
In a national survey of high school students (grades 9 to 12), 25% of respondents reported that someone had offered them a cigarette at least once.Determine whether the underlined value is a parameter or a statistic.
In a survey of a sample of 1050 teenagers, 17% said they like to watch soccer.Determine whether the underlined value is a parameter or a statistic.
Telephone interviews of 1,502 adults found that only 69% could identify the current vice-president’s voice over the phone.Determine whether the underlined value is a parameter or a statistic.
In a national survey on substance abuse, 66.4% of respondents who were full-time college students aged 18 to 22 responded that they have never used drugs.Determine whether the underlined value is a parameter or a statistic.
The average score for a class of 28 students taking a calculus midterm exam was 72%.Determine whether the underlined value is a parameter or a statistic.
Favorite musical group Classify the variable as qualitative or quantitative.
Address Classify the variable as qualitative or quantitative.
Height Classify the variable as qualitative or quantitative.
Number of students at a universityClassify the variable as qualitative or quantitative.
Number of cars owned Classify the variable as qualitative or quantitative.
Miles per hour at which a car is traveling Classify the variable as qualitative or quantitative.
Phone number Classify the variable as qualitative or quantitative.
Amount of money spent on computers this year Classify the variable as qualitative or quantitative.
Number of pieces of lumber used to make a deck Determine whether the quantitative variable is discrete or continuous.
Volume of liquid in a glass Determine whether the quantitative variable is discrete or continuous.
Number of beats in a song Determine whether the quantitative variable is discrete or continuous.
Number of coins in a jar Determine whether the quantitative variable is discrete or continuous.
Showing 5400 - 5500
of 5564
First
42
43
44
45
46
47
48
49
50
51
52
53
54
55
56
Step by Step Answers