New Semester
Started
Get
50% OFF
Study Help!
--h --m --s
Claim Now
Question Answers
Textbooks
Find textbooks, questions and answers
Oops, something went wrong!
Change your search query and then try again
S
Books
FREE
Study Help
Expert Questions
Accounting
General Management
Mathematics
Finance
Organizational Behaviour
Law
Physics
Operating System
Management Leadership
Sociology
Programming
Marketing
Database
Computer Network
Economics
Textbooks Solutions
Accounting
Managerial Accounting
Management Leadership
Cost Accounting
Statistics
Business Law
Corporate Finance
Finance
Economics
Auditing
Tutors
Online Tutors
Find a Tutor
Hire a Tutor
Become a Tutor
AI Tutor
AI Study Planner
NEW
Sell Books
Search
Search
Sign In
Register
study help
business
statistics informed decisions using data
Statistics Informed Decisions Using Data 5th Global Edition Michael Sullivan - Solutions
x = 45, n = 150, 99% confidence Construct a confidence interval of the population proportion at the given level of confidence.
x = 80, n = 200, 95% confidence Construct a confidence interval of the population proportion at the given level of confidence.
x = 120, n = 1200, 94% confidence Construct a confidence interval of the population proportion at the given level of confidence.
In a survey of 2065 adults in a certain country conducted during a period of economic uncertainty, 54% thought that wages paid to workers in industry were too low. The margin of error was 9 percentage points with 90% confidence. For parts (a) through (d) below, which represent a reasonable
A national survey of 1000 adult citizens of a nation found that 25% dreaded Valentine’s Day. The margin of error for the survey was 5.6 percentage points with 85% confidence. Explain what this means.
A researcher wishes to estimate the proportion of adults who have high-speed Internet access. What size sample should be obtained if she wishes the estimate to be within 0.04 with 99% confidence if(a) she uses a previous estimate of 0.34?(b) she does not use any prior estimates?
A researcher wishes to estimate the percentage of adults who support abolishing the penny. What size sample should be obtained if he wishes the estimate to be within 3 percentage points with 99% confidence if(a) he uses a previous estimate of 36%?(b) he does not use any prior estimates?
A television sports commentator wants to estimate the proportion of Americans who follow professional football. What sample size should be obtained if he wants to be within 3 percentage points with 95% confidence if(a) he uses an estimate of 52% obtained from a poll?(b) he does not use any prior
In a poll, 37% of the people polled answered yes to the question: “Are you in favor of the death penalty for a person convicted of murder?” The margin of error in the poll was 3%, and the estimate was made with 95% confidence. At least how many people were surveyed?
A group conducted a poll of 2049 likely voters just prior to an election. The results of the survey indicated that candidate A would receive 48% of the popular vote and candidate B would receive 46% of the popular vote. The margin of error was reported to be 2%. The group reported that the race was
Explain what “98% confidence” means in a 98% confidence interval.
By how many times does the sample size have to be increased to decrease the margin of error by a factor of 1/3?
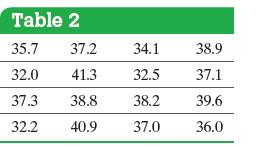
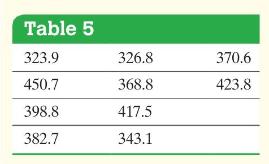
The website fueleconomy.gov allows drivers to report the miles per gallon of their vehicle. The data in Table 2 show the reported miles per gallon of 2011 Ford Focus automobiles for 16 different owners. Obtain a point estimate of the population mean miles per gallon of a 2011 Ford Focus.Approach
(a) Use statistical software such as Minitab or StatCrunch to obtain 1500 simple random samples of size n = 5 from a normal population with μ = 50 and σ = 10. Calculate the sample mean and sample standard deviation for each sample. Computefor each sample. Draw histograms for both z and t.(b)
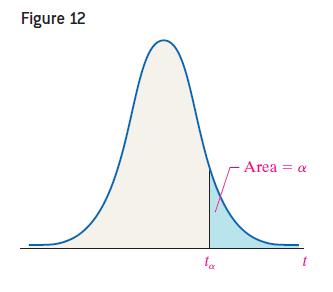
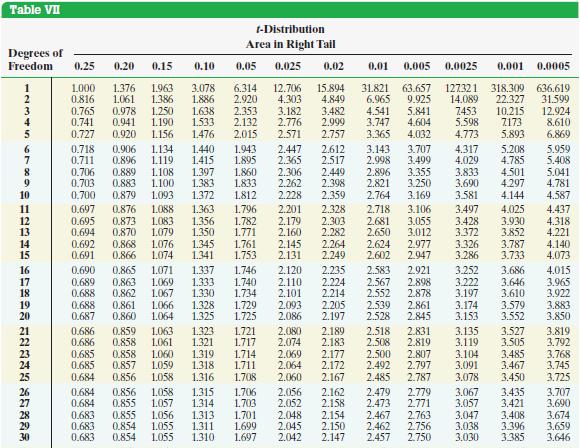
Find the t-value such that the area under the t-distribution to the right of the t-value is 0.10, assuming 15 degrees of freedom (df). That is, find t0.10 with 15 degrees of freedom.ApproachStep 1 Draw a t-distribution with the unknown t-value labeled. Shade the area under the curve to the right of
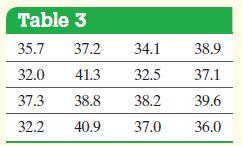
The website fueleconomy.gov allows drivers to report the miles per gallon of their vehicle. The data in Table 3 show the reported miles per gallon of 2011 Ford Focus automobiles for 16 different owners. Treat the sample as a simple random sample of all 2011 Ford Focus automobiles. Construct a 95%
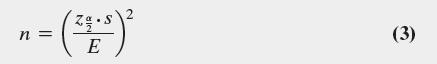
We again consider the problem of estimating the miles per gallon of a 2011 Ford Focus. How large a sample is required to estimate the mean miles per gallon within 0.5 mile per gallon with 95% confidence?Approach Use Formula (3) with zα/2 = z0.025 = 1.96, s = 2.92, and E = 0.5 to find the required
\(n=12\); Correlation \(=0.987\)A simple random sample of size \(n
\(n=15\); Correlation \(=0.893\)A simple random sample of size \(n
\(n=13 ;\) Correlation \(=0.966\)A simple random sample of size \(n
\(n=9\); Correlation \(=0.997\)A simple random sample of size \(n
Lower bound: 20 , upper bound: 26 Determine the point estimate of the population mean and margin of error for each confidence interval.
Lower bound: 16 , upper bound: 26 Determine the point estimate of the population mean and margin of error for each confidence interval.
Lower bound: 19 , upper bound: 27 Determine the point estimate of the population mean and margin of error for each confidence interval.
Lower bound: 21 , upper bound: 29 Determine the point estimate of the population mean and margin of error for each confidence interval.
In a survey, 700 adults in a certain country were asked how many hours they worked in the previous week. Based on the results, a \(95 \%\) confidence interval for mean number of hours worked was lower bound: 41.7 and upper bound: 43.6. Which of the following represents a reasonable interpretation
A trade magazine routinely checks the drive-through service times of fast-food restaurants. A 95% confidence interval that results from examining 602 customers in one fast-food chain's drivethrough has a lower bound of 175.1 seconds and an upper bound of 178.1 seconds. What does this mean?
For the "Hours Worked" survey conducted by Gallup in Problem 21, provide two recommendations for increasing the precision of the interval.Data from Problem 21In a survey, 700 adults in a certain country were asked how many hours they worked in the previous week. Based on the results, a \(95 \%\)
A doctor wants to estimate the mean HDL cholesterol of all 20- to 29-year-old females. How many subjects are needed to estimate the mean HDL cholesterol within 2 points with \(99 \%\) confidence assuming \(s=11.2\) based on earlier studies? Suppose the doctor would be content with \(90 \%\)
People were polled on how many books they read the previous year. Initial survey results indicate that \(s=18.8\) books.(a) How many subjects are needed to estimate the mean number of books read the previous year within four books with \(90 \%\) confidence?(b) How many subjects are needed to
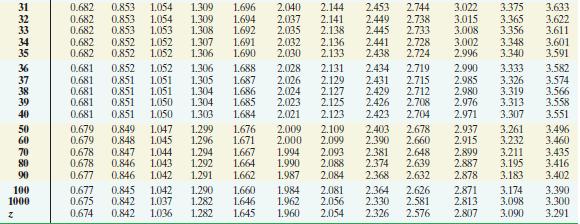
Find the critical values that separate the middle \(90 \%\) of the chi-square distribution from the 5% area in each tail, assuming 15 degrees of freedom.Approach Perform the following steps to obtain the critical values.Step 1 Draw a chi-square distribution with the critical values and areas
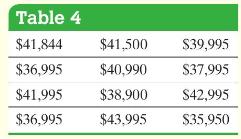
Table 4 shows the sale price of 12 randomly selected 6-year-old Chevy Corvettes. Construct a \(90 \%\) confidence interval for the population variance and standard deviation of the price of a 6- year-old Chevy Corvette.Approach Step 1 Verify the data are obtained randomly and the sample size is
\(90 \%\) confidence, \(n=25\)Find the critical values \(\chi_{1-\alpha / 2}^{2}\) and \(\chi_{\alpha / 2}^{2}\) for the given level of confidence and sample size.
\(80 \%\) confidence, \(n=15\)Find the critical values \(\chi_{1-\alpha / 2}^{2}\) and \(\chi_{\alpha / 2}^{2}\) for the given level of confidence and sample size.
\(98 \%\) confidence, \(n=30\)Find the critical values \(\chi_{1-\alpha / 2}^{2}\) and \(\chi_{\alpha / 2}^{2}\) for the given level of confidence and sample size.
\(98 \%\) confidence, \(n=10\)Find the critical values \(\chi_{1-\alpha / 2}^{2}\) and \(\chi_{\alpha / 2}^{2}\) for the given level of confidence and sample size.
A simple random sample of size \(n\) is drawn from a population that is known to be normally distributed. The sample variance, \(s^{2}\), is determined to be 12.4.(a) Construct a \(90 \%\) confidence interval for \(\sigma^{2}\) if the sample size, \(n\), is 20 .(b) Construct a 90\% confidence
A simple random sample of size \(n\) is drawn from a population that is known to be normally distributed. The sample variance, \(s^{2}\), is determined to be 19.8 .(a) Construct a \(95 \%\) confidence interval for \(\sigma^{2}\) if the sample size, \(n\), is 10 .(b) Construct a \(95 \%\) confidence
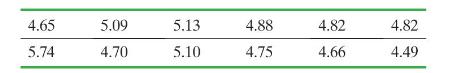
The following data represent the \(\mathrm{pH}\) of rain for a random sample of 12 rain dates in a particular region. A normal probability plot suggests the data could come from a population that is normally distributed. A boxplot indicates there are no outliers. The sample standard deviation is
Robert wishes to estimate the mean number of miles that his Buick Lacrosse can be driven on a full tank of gas. He fills up his car with regular unleaded gasoline from the same gas station 10 times and records the number of miles that he drives until his low-tank indicator light comes on. He
A simple random sample of size \(n=450\) individuals who are currently employed is asked if they work at home at least once per week. Of the 450 employed individuals surveyed, 42 responded that they did work at home at least once per week. Construct a 99% confidence interval for the population
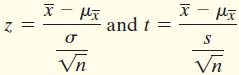
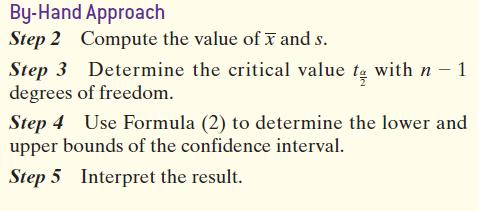
A simple random sample of size \(n=23\) is drawn from a population that is normally distributed. The sample mean is found to be \(\bar{x}=67\), and the sample standard deviation is found to be \(s=11\). Construct a \(95 \%\) confidence interval about the population mean.
A simple random sample of size \(n=40\) is drawn from a population. The sample mean is found to be \(\bar{x}=120.8\), and the sample standard deviation is found to be \(s=12.3\). Construct a \(99 \%\) confidence interval for the population mean.
A simple random sample of size 20 is drawn from a population that is known to be normally distributed. The sample variance, \(s^{2}\), is determined to be 12.8 . Construct a \(90 \%\) confidence interval for \(\sigma^{2}\).
A simple random sample of size \(n=25\) is drawn from a population that is normally distributed. The sample variance is found to be \(s^{2}=3.97\). Construct a \(95 \%\) confidence interval for the population standard deviation.
Estate Tax Returns In a random sample of 100 audited estate tax returns, it was determined that the mean amount of additional tax owed was \(\$ 3481\) with a standard deviation of \(\$ 2588\). Construct and interpret a \(90 \%\) confidence interval for the mean additional amount of tax owed for
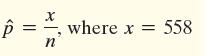
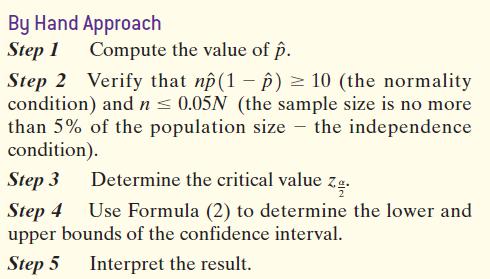
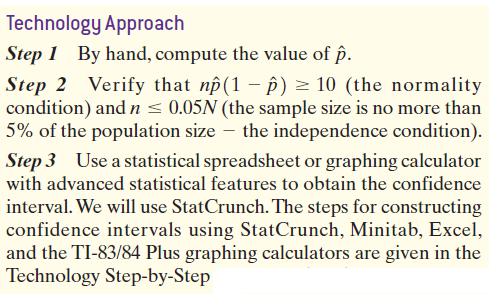
The Gallup Organization conducted a poll in which a simple random sample of 1016 Americans 18 and older were asked, “Do you consider the amount of federal income tax you have to pay is fair?” Of the 1016 adult Americans surveyed, 558 said yes. Obtain a point estimate for the proportion of
When the Gallup Organization conducted the poll introduced in Example 1, 54.9% of those surveyed considered the amount of federal income tax they have to pay as fair. Gallup reported its “survey methodology” as follows:Results are based on telephone interviews with a random sample of 1016
In the Parent–Teen Cell Phone Survey conducted by Princeton Survey Research Associates International, 800 randomly sampled 16-to 17-year-olds living in the United States were asked whether they have ever used their cell phone to text while driving. Of the 800 teenagers surveyed, 272 indicated
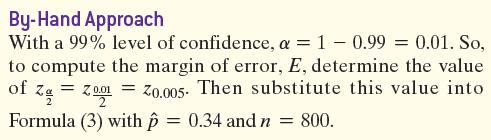
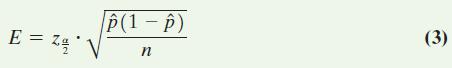
For the problem of estimating the proportion of 16- to 17- year-old teenagers who text while driving, determine the effect on the margin of error by increasing the level of confidence from 95% to 99%.Formula 3 By-Hand Approach With a 99% level of confidence, a = 10.99 = 0.01. So, to compute the
An economist wants to know if the proportion of the U.S. population who commutes to work via carpooling is on the rise. What size sample should be obtained if the economist wants an estimate within 2 percentage points of the true proportion with 90% confidence if(a) the economist uses the 2009
The probability that less than 57 households have a gas stove.A discrete random variable is given. Assume the probability of the random variable will be approximated using the normal distribution. Describe the area under the normal curve that will be computed. For example, if we wish to compute the
The probability that there are exactly 15 defective parts in a shipment.A discrete random variable is given. Assume the probability of the random variable will be approximated using the normal distribution. Describe the area under the normal curve that will be computed. For example, if we wish to
The probability that at most 39 households have a gas stove.A discrete random variable is given. Assume the probability of the random variable will be approximated using the normal distribution. Describe the area under the normal curve that will be computed. For example, if we wish to compute the
The probability that more than 350 Americans support the bill proposing to extend daylight savings time.A discrete random variable is given. Assume the probability of the random variable will be approximated using the normal distribution. Describe the area under the normal curve that will be
The probability that the number of people with blood type O-negative is between 18 and 27.A discrete random variable is given. Assume the probability of the random variable will be approximated using the normal distribution. Describe the area under the normal curve that will be computed. For
n = 40, p = 0.3, x = 20 Compute P(x) using the binomial probability formula. Then determine whether the normal distribution can be used as an approximation for the binomial distribution. If so, approximate P(x) and compare the result to the exact probability.
A certain flight arrives on time 87 percent of the time. Suppose 149 flights are randomly selected. Use the normal approximation to the binomial to approximate the probability that(a) exactly 127 flights are on time.(b) at least 127 flights are on time.(c) fewer than 134 flights are on time.(d)
In the Healthy Handwashing Survey conducted by Bradley Corporation, it was found that 64% of adult Americans operate the flusher of toilets in public restrooms with their foot. Suppose you survey a random sample of 740 adult American women aged 18–24 years. Use the normal approximation to the
According to a study, 73% of all males between the ages of 18 and 24 live at home. (Unmarried college students living in a dorm are counted as living at home.) Suppose that a survey is administered and 177 of 234 respondents indicated that they live at home.(a) Use the normal approximation to the
Find the value of z0.20 .
Find the value of z0.04.
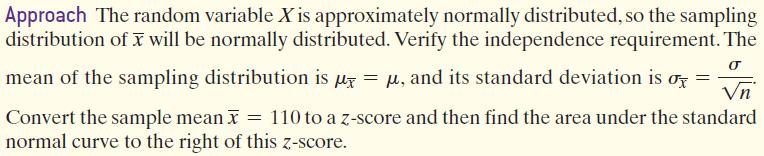
An intelligence quotient, or IQ, is a measurement of intelligence derived from a standardized test, such as the Stanford Binet IQ test. Scores on this test are approximately normally distributed with a mean score of 100 and a standard deviation of 15. What is the sampling distribution of the sample
Repeat the problem in Example 1 with a sample of size n = 25.Approach Use the approach presented in Example 1, but let n = 25 instead of n = 9.Data from Example 1 An intelligence quotient, or IQ, is a measurement of intelligence derived from a standardized test, such as the Stanford Binet IQ test.
The IQ, X, of humans is approximately normally distributed with mean μ = 100 and standard deviation σ = 15. Compute the probability that a simple random sample of size n = 10 results in a sample mean greater than 110. That is, compute P(x̅ > 110). Approach The random variable X is
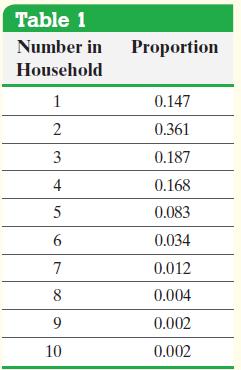
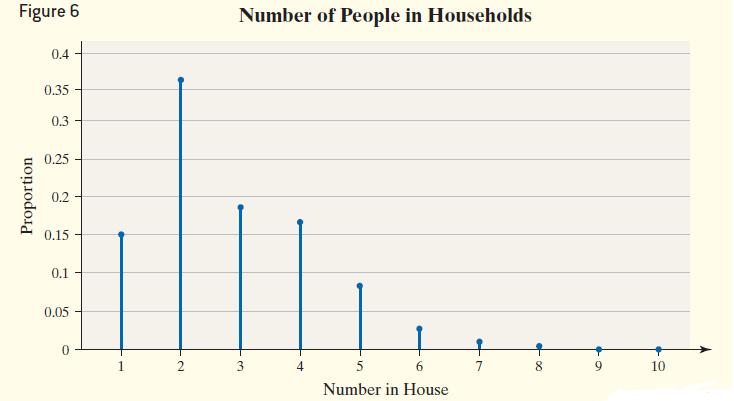
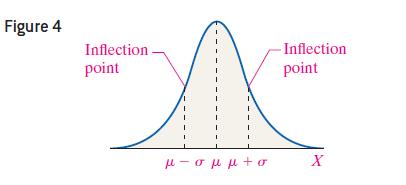
The data in Table 1 represent the probability distribution of the number of people living in households in the United States. Figure 6 shows a graph of the probability distribution. From the data in Table 1, we determine the mean and standard deviation number of people living in households in the
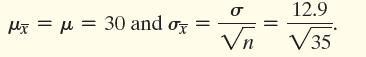
The mean weight gain during pregnancy is 30 pounds, with a standard deviation of 12.9 pounds. Weight gain during pregnancy is skewed right. An obstetrician obtains a random sample of 35 low-income patients and determines their mean weight gain during pregnancy was 36.2 pounds. Does this result
A simple random sample of size n = 55 is obtained from a population with μ = 82 and σ = 2. Does the population need to be normally distributed for the sampling distribution of x to be approximately normally distributed? Why? What is the sampling distribution of x?
μ = 78, σ = 14, n = 49 Determine μx̅ and σx̅ from the given parameters of the population and the sample size.
μ = 80, σ = 36, n = 81 Determine μx̅ and σx̅ from the given parameters of the population and the sample size.
μ = 63, σ = 5, n = 21 Determine μx̅ and σx̅ from the given parameters of the population and the sample size.
μ = 42, σ = 14, n = 20 Determine μx̅ and σx̅ from the given parameters of the population and the sample size.
A simple random sample of size n = 64 is obtained from a population with μ = 83 and σ = 32.(a) Describe the sampling distribution of x̅.(b) What is P(x̅ > 88.6)?(c) What is P(x̅ ≤ 74)?(d) What is P(79.6 < x̅ < 91)?
A simple random sample of size n = 12 is obtained from a population with μ = 69 and σ = 15.(a) What must be true regarding the distribution of the population in order to use the normal model to compute probabilities regarding the sample mean? Assuming the normal model can be used, describe the
A simple random sample of size n = 12 is obtained from a population with μ = 63 and σ = 19.(a) What must be true regarding the distribution of the population in order to use the normal model to compute probabilities involving the sample mean? Assuming that this condition is true, describe the
The reading speed of second-grade students in a large city is approximately normal, with a mean of 92 words per minute (wpm) and a standard deviation of 10 wpm.(a) What is the probability a randomly selected student from this population will read at more than 97 words per minute?(b) What is the
Suppose a geyser has a mean time between eruptions of 74 minutes. If the interval of time between the eruptions is normally distributed with standard deviation 26 minutes, answer the following questions.(a) What is the probability that a randomly selected time interval between eruptions is longer
A very good poker player is expected to earn \($1\) per hand in \($100\)/\($200\) Texas Hold’em. The standard deviation is approximately \($32\).(a) What is the probability a very good poker player earns a profit (more than \($0\)) after playing 50 hands in \($100\)/\($200\) Texas Hold’em?(b)
The Harris Poll conducted a survey of 1200 adult Americans who vacation during the summer and asked whether the individuals plan to work while on summer vacation. Of those surveyed, 552 indicated that they plan to work while on vacation.Find the sample proportion of individuals surveyed who plan to
Based on a study conducted by the Gallup organization, 76% of Americans believe that the state of moral values in the United States is getting worse. Describe the sampling distribution of the sample proportion for samples of size (a) n = 10,(b) n = 25, (c) n = 60.Approach Describing a distribution
Based on a study conducted by the Gallup organization, 76% of Americans believe that the state of moral values in the United States is getting worse. Suppose we obtain a simple random sample of n = 60 Americans and determine which believe that the state of the moral values in the United States is
According to the National Center for Health Statistics, 15% of all Americans have hearing trouble.(a) In a random sample of 120 Americans, what is the probability at most 12% have hearing trouble?(b) Suppose that a random sample of 120 Americans who regularly listen to music using headphones
In a town of 500 households, 220 have a dog. The population proportion of dog owners in this town (expressed as a decimal) is p = ______ .
True or False: The mean of the sampling distribution of p̂ is p.
n = 200, p = 0.4. Assume the size of the population is 10,000.Describe the sampling distribution of p̂.
n = 800, p = 0.4. Assume the size of the population is 20,000.Describe the sampling distribution of p̂.
n = 1000, p = 0.706. Assume the size of the population is 25,000.Describe the sampling distribution of p̂.
n = 800, p = 0.476. Assume the size of the population is 20,000.Describe the sampling distribution of p̂.
A simple random sample of size n = 150 is obtained from a population whose size is N = 10,000 and whose population proportion with a specified characteristic is p = 0.6.(a) Describe the sampling distribution of pn.(b) What is the probability of obtaining x = 93 or more individuals with the
A simple random sample of size n = 1000 is obtained from a population whose size is N = 1,500,000 and whose population proportion with a specified characteristic is p = 0.44. Complete parts (a) through (c) below.(a) Describe the sampling distribution of pn.(b) What is the probability of obtaining x
According to a study conducted by an organization, the proportion of Americans who were afraid to fly in 2006 was 0.10.A random sample of 1,200 Americans results in 132 indicating that they are afraid to fly. Explain why this is not necessarily evidence that the proportion of Americans who are
A researcher studying public opinion of proposed Social Security changes obtains a simple random sample of 25 adult Americans and asks them whether or not they support the proposed changes. To say that the distribution of the sample proportion of adults who respond yes, is approximately normal, how
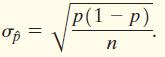
Finite Population Correction Factor In this section, we assumed that the sample size was less than 5% of the size of the population. When sampling without replacement from a finite population in which n 7 0.05N, the standard deviation of the distribution of pn is given by where N is the size of the
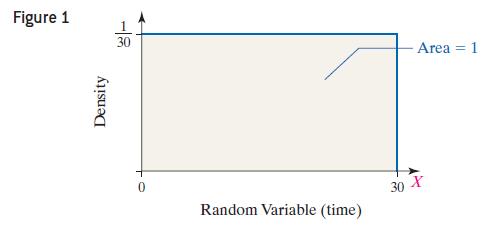
Refer to the situation in Example 1.(a) What is the probability your friend will be between 10 and 20 minutes late?(b) It is 10 a.m. There is a 20% probability your friend will arrive within the next ______ minutes.Approach Use the graph of the density function in Figure 1 to find the
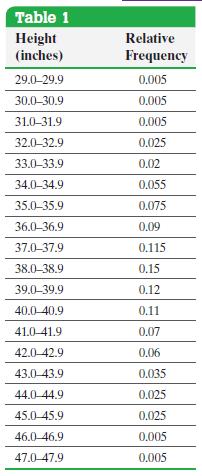
The relative frequency distribution given in Table 1 represents the heights of a pediatrician’s three-year-old female patients. The raw data indicate that the mean height of the patients is μ = 38.72 inches with standard deviation σ = 3.17 inches.(a) Draw a relative frequency histogram of the
The serum total cholesterol for males 20–29 years old is approximately normally distributed with mean μ = 180 and σ = 36.2, based on data obtained from the National Health and Nutrition Examination Survey.(a) Draw a normal curve with the parameters labeled.(b) An individual with total
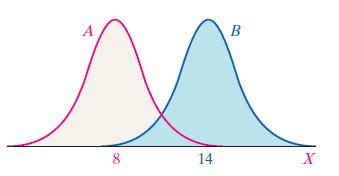
One graph in the figure below represents a normal distribution with mean μ = 8 and standard deviation σ = 2. The other graph represents a normal distribution with mean μ = 14 and standard deviation σ = 2.Determine which graph is which and explain how you know. A B 8 14 X
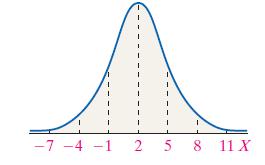
The graph of a normal curve is given. Use the graph to identify the values of μ and σ. -7-4-1 2 5 8 11 X
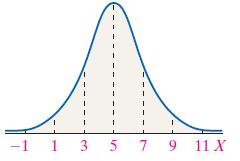
The graph of a normal curve is given. Use the graph to identify the values of μ and σ. -1 1 3 5 7 9 11 X
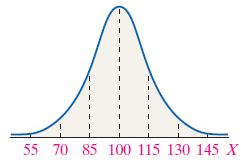
The graph of a normal curve is given. Use the graph to identify the values of μ and σ. 55 70 85 100 115 130 145 X
Showing 4800 - 4900
of 5564
First
42
43
44
45
46
47
48
49
50
51
52
53
54
55
56
Step by Step Answers