New Semester
Started
Get
50% OFF
Study Help!
--h --m --s
Claim Now
Question Answers
Textbooks
Find textbooks, questions and answers
Oops, something went wrong!
Change your search query and then try again
S
Books
FREE
Study Help
Expert Questions
Accounting
General Management
Mathematics
Finance
Organizational Behaviour
Law
Physics
Operating System
Management Leadership
Sociology
Programming
Marketing
Database
Computer Network
Economics
Textbooks Solutions
Accounting
Managerial Accounting
Management Leadership
Cost Accounting
Statistics
Business Law
Corporate Finance
Finance
Economics
Auditing
Tutors
Online Tutors
Find a Tutor
Hire a Tutor
Become a Tutor
AI Tutor
AI Study Planner
NEW
Sell Books
Search
Search
Sign In
Register
study help
mathematics
business statistics
Statistics For Business Decision Making And Analysis 3rd Edition Robert A. Stine, Dean Foster - Solutions
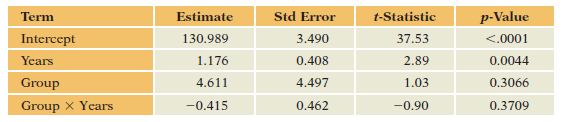
The multiple regression of Salary on Years, Group, and the Years * Group interaction (Table 25.5) reproduces the fits of the two simple regressions of Salary on Years for male and female managers. What€™s the relationship between the residuals of this multiple regression and those of the
Match each definition on the left with a mathematical expression or term on the right.Name given to the variable that specifies the treatments in an experiment(a) t = -4.6(b) t = 1.3(c) µ1 €“ µ2(d) (e) n - 1(f) xÌ…1 €“ xÌ…2(g)
Match each definition on the left with a mathematical expression or term on the right.Difference between the averages in two populations(a) t = -4.6(b) t = 1.3(c) µ1 €“ µ2(d) (e) n - 1(f) xÌ…1 €“ xÌ…2(g) Confounding(h) Randomization(i)
Match the description of each concept with the correct symbol or term.Maximum tolerance for incorrectly rejecting H0(a) t-statistic(b) µ0(c) p-value(d) p-value < α(e) Type I error(f) z-statistic(g) Type II error(h) α-level(i) H0: µ ≥ 0(j) Ha, H1
Match the description of each concept with the correct symbol or term.One-sided null hypothesis(a) t-statistic(b) µ0(c) p-value(d) p-value < α(e) Type I error(f) z-statistic(g) Type II error(h) α-level(i) H0: µ ≥ 0(j) Ha, H1
Match each term from an ANOVA regression on the left to its symbol on the right. These exercises use the abbreviations SS for sum of squares and MS for mean squares.Null hypothesis of F-test(a) b0(b) µ1 = µ2 = g = … µJ(c) yij(d) (Regression MS)>(Residual MS)(e) (Regression SS)>(Total
Match each term from an ANOVA regression on the left to its symbol on the right. These exercises use the abbreviations SS for sum of squares and MS for mean squares.F-statistic(a) b0(b) µ1 = µ2 = g = … µJ(c) yij(d) (Regression MS)>(Residual MS)(e) (Regression SS)>(Total SS)(f) nj(g) µ1
Match each term from an ANOVA regression on the left to its symbol on the right. These exercises use the abbreviations SS for sum of squares and MS for mean squares.R2 in disguise(a) b0(b) µ1 = µ2 = g = … µJ(c) yij(d) (Regression MS)>(Residual MS)(e) (Regression SS)>(Total SS)(f) nj(g)
The intercept in a regression of Y on a dummy variable X is the difference between the mean of Y for observations with x = 0 and the mean of Y for observations with x = 1.Mark each statement True or False. If you believe that a statement is false, briefly explain why you think it is false.
Suppose that the subjects in an experiment are reused. For example, each person in a taste test samples every product. Are these data suitable for a one-way ANOVA?
As part of the study underlying Example 26.1, each customer took a test that measures willingness to believe claims, producing a numerical score called Gullible. If the customers had not been randomly assigned, an analyst planned to fit the regression modelCredibility = β0 + β1D(Plausible) + β2
Investors are often tempted by rumors of calendar effects on financial markets. After all, the crashes in 1929 and 1987 both came in October. Maybe it is better to avoid the stock market in October. This exercise uses daily stock returns from 2010 through 2015 and divides the year by month. Use the
Match each definition on the left with its mathematical expression on the right.Change in the value of the response(a) Y10, Y11, Y12, Y13, Y14(b) b0 + b1 t(c) b0 + β1 Yt-1 + β 2 Yt-2 + β3 Yt-3(d) Yt - Yt-1(e) b0 + b1 Yt-1(f) 2{1 – corr(et, et-1)}(g) w St-1 + (1 – w) Yt(h) corr(et,
Match each definition on the left with its mathematical expression on the right.Value of the response in the previous time period(a) Y10, Y11, Y12, Y13, Y14(b) b0 + b1 t(c) b0 + β1 Yt-1 + β 2 Yt-2 + β3 Yt-3(d) Yt - Yt-1(e) b0 + b1 Yt-1(f) 2{1 – corr(et, et-1)}(g) w St-1 + (1 – w) Yt(h)
Match each definition on the left with its mathematical expression on the right.Values averaged in a five-term moving average(a) Y10, Y11, Y12, Y13, Y14(b) b0 + b1 t(c) b0 + β1 Yt-1 + β 2 Yt-2 + β3 Yt-3(d) Yt - Yt-1(e) b0 + b1 Yt-1(f) 2{1 – corr(et, et-1)}(g) w St-1 + (1 – w) Yt(h)
Match each definition on the left with its mathematical expression on the right.Exponentially weighted moving average(a) Y10, Y11, Y12, Y13, Y14(b) b0 + b1 t(c) b0 + β1 Yt-1 + β 2 Yt-2 + β3 Yt-3(d) Yt - Yt-1(e) b0 + b1 Yt-1(f) 2{1 – corr(et, et-1)}(g) w St-1 + (1 – w) Yt(h) corr(et,
Match each definition on the left with its mathematical expression on the right.Equation of a model that fits a linear trend(a) Y10, Y11, Y12, Y13, Y14(b) b0 + b1 t(c) b0 + β1 Yt-1 + β 2 Yt-2 + β3 Yt-3(d) Yt - Yt-1(e) b0 + b1 Yt-1(f) 2{1 – corr(et, et-1)}(g) w St-1 + (1 – w) Yt(h)
Match each definition on the left with its mathematical expression on the right.Equation of a fourth-degree polynomial model(a) Y10, Y11, Y12, Y13, Y14(b) b0 + b1 t(c) b0 + β1 Yt-1 + β 2 Yt-2 + β3 Yt-3(d) Yt - Yt-1(e) b0 + b1 Yt-1(f) 2{1 – corr(et, et-1)}(g) w St-1 + (1 – w) Yt(h)
Match each definition on the left with its mathematical expression on the right.Equation of a first-order autoregression(a) Y10, Y11, Y12, Y13, Y14(b) b0 + b1 t(c) b0 + β1 Yt-1 + β 2 Yt-2 + β3 Yt-3(d) Yt - Yt-1(e) b0 + b1 Yt-1(f) 2{1 – corr(et, et-1)}(g) w St-1 + (1 – w) Yt(h) corr(et,
Match each definition on the left with its mathematical expression on the right.Equation of an AR(3) model(a) Y10, Y11, Y12, Y13, Y14(b) b0 + b1 t(c) b0 + β1 Yt-1 + β 2 Yt-2 + β3 Yt-3(d) Yt - Yt-1(e) b0 + b1 Yt-1(f) 2{1 – corr(et, et-1)}(g) w St-1 + (1 – w) Yt(h) corr(et, et-1)(i)
Match each definition on the left with its mathematical expression on the right.Alternative equation for the Durbin-Watson statistic(a) Y10, Y11, Y12, Y13, Y14(b) b0 + b1 t(c) b0 + β1 Yt-1 + β 2 Yt-2 + β3 Yt-3(d) Yt - Yt-1(e) b0 + b1 Yt-1(f) 2{1 – corr(et, et-1)}(g) w St-1 + (1 – w)
Match each definition on the left with its mathematical expression on the right.Autocorrelation of adjacent residuals(a) Y10, Y11, Y12, Y13, Y14(b) b0 + b1 t(c) b0 + β1 Yt-1 + β 2 Yt-2 + β3 Yt-3(d) Yt - Yt-1(e) b0 + b1 Yt-1(f) 2{1 – corr(et, et-1)}(g) w St-1 + (1 – w) Yt(h) corr(et,
Unemployment The data for this exercise are the raw and seasonally adjusted civilian unemployment rate in the United States, monthly from January 1948 through March 2016.(a) Compare the time series by graphing both in one timeplot.(b) Subtract the seasonally adjusted series from the raw series.
Arctic Ice These data give the extent of area covered by ice in arctic regions near the North Pole from September 1979 to 2015. The reduction in the amount of arctic ice is related to global climate and rising sea levels.(a) Use a linear equation to estimate the annual average reduction in the
Mobile Africa These data give the annual number of mobile phone subscribers in sub-Saharan Africa in 2000–2015.(a) Fit a polynomial trend model to the number of phone subscribers. Use the variable Year in the data set as the time index in these models. Explain your choice of the best of these
Match each task or property of a regression model in the left-hand column with an expression in the right-hand column.Unique variance in X2(a) t-statistic for b1(b) 1 - R2(c) s2x2(d) VIF(X1)(e) 1(f) F-statistic(g) Scatterplot matrix(h) s2x2>VIF(X2)(i) b0(j) Correlation matrix
Match each task or property of a regression model in the left-hand column with an expression in the right-hand column.Variance in X2(a) t-statistic for b1(b) 1 - R2(c) s2x2(d) VIF(X1)(e) 1(f) F-statistic(g) Scatterplot matrix(h) s2x2>VIF(X2)(i) b0(j) Correlation matrix
Match each task or property of a regression model in the left-hand column with an expression in the right-hand column.Test whether adding X1 improves fit of model(a) t-statistic for b1(b) 1 - R2(c) s2x2(d) VIF(X1)(e) 1(f) F-statistic(g) Scatterplot matrix(h) s2x2>VIF(X2)(i) b0(j) Correlation
Match each task or property of a regression model in the left-hand column with an expression in the right-hand column.Percentage of variation in residuals(a) t-statistic for b1(b) 1 - R2(c) s2x2(d) VIF(X1)(e) 1(f) F-statistic(g) Scatterplot matrix(h) s2x2>VIF(X2)(i) b0(j) Correlation matrix
Match each task or property of a regression model in the left-hand column with an expression in the right-hand column.Scatterplots among variables(a) t-statistic for b1(b) 1 - R2(c) s2x2(d) VIF(X1)(e) 1(f) F-statistic(g) Scatterplot matrix(h) s2x2>VIF(X2)(i) b0(j) Correlation matrix
Match each task or property of a regression model in the left-hand column with an expression in the right-hand column.Correlations among variables(a) t-statistic for b1(b) 1 - R2(c) s2x2(d) VIF(X1)(e) 1(f) F-statistic(g) Scatterplot matrix(h) s2x2>VIF(X2)(i) b0(j) Correlation matrix
Match each task or property of a regression model in the left-hand column with an expression in the right-hand column.Effect of collinearity on se(b1)(a) t-statistic for b1(b) 1 - R2(c) s2x2(d) VIF(X1)(e) 1(f) F-statistic(g) Scatterplot matrix(h) s2x2>VIF(X2)(i) b0(j) Correlation matrix
Match each task or property of a regression model in the left-hand column with an expression in the right-hand column.Regression estimate without VIF(a) t-statistic for b1(b) 1 - R2(c) s2x2(d) VIF(X1)(e) 1(f) F-statistic(g) Scatterplot matrix(h) s2x2>VIF(X2)(i) b0(j) Correlation matrix
Match each task or property of a regression model in the left-hand column with an expression in the right-hand column.Minimum value of VIF(a) t-statistic for b1(b) 1 - R2(c) s2x2(d) VIF(X1)(e) 1(f) F-statistic(g) Scatterplot matrix(h) s2x2>VIF(X2)(i) b0(j) Correlation matrix
Weather News broadcasts use weather forecasts to attract viewers to their station. These data give the observed daily high temperature for 137 consecutive days in Philadelphia along with the broadcast forecasts of high temperature produced one day before, two days before and three days before.(a)
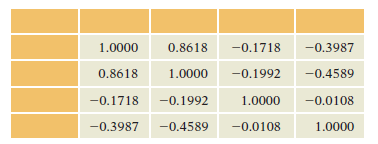
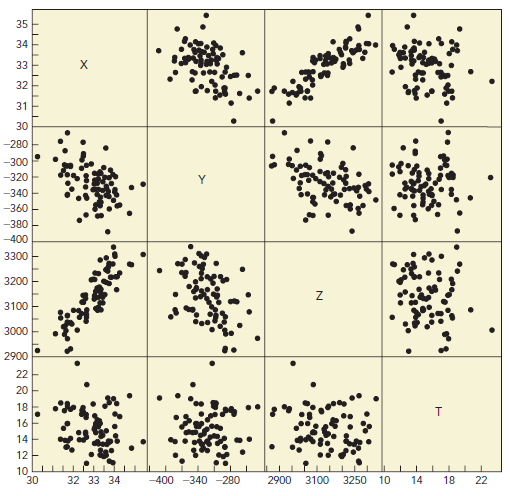
The following correlation matrix and the scatterplot matrix shown below summarize the same data, only we scrambled the order of the variables in the two views. If the labels X, Y, Z, and T are as given in the scatterplot matrix, label the rows and columns in the correlation matrix. 0.8618 0.8618
Match the item in the first column with the concept that can be observed, test statistic, or estimate from the second column.Test H0: β2 = 0(a) Similar variances(b) F-statistic(c) Collinearity(d) Nearly normal errors(e) Nonlinear effect(f) Product of marginal slopes(g) Partial slope for X2(h)
Match the item in the first column with the concept that can be observed, test statistic, or estimate from the second column.Test H0: β1 = β2 = 0(a) Similar variances(b) F-statistic(c) Collinearity(d) Nearly normal errors(e) Nonlinear effect(f) Product of marginal slopes(g) Partial slope for
Match the item in the first column with the concept that can be observed, test statistic, or estimate from the second column.Normal quantile plot(a) Similar variances(b) F-statistic(c) Collinearity(d) Nearly normal errors(e) Nonlinear effect(f) Product of marginal slopes(g) Partial slope for X2(h)
Match the item in the first column with the concept that can be observed, test statistic, or estimate from the second column.Scatterplot of e on Ŷ(a) Similar variances(b) F-statistic(c) Collinearity(d) Nearly normal errors(e) Nonlinear effect(f) Product of marginal slopes(g) Partial slope for
Match the item in the first column with the concept that can be observed, test statistic, or estimate from the second column.Scatterplot of Y on Ŷ(a) Similar variances(b) F-statistic(c) Collinearity(d) Nearly normal errors(e) Nonlinear effect(f) Product of marginal slopes(g) Partial slope for
Match the item in the first column with the concept that can be observed, test statistic, or estimate from the second column.Indirect effect of X2(a) Similar variances(b) F-statistic(c) Collinearity(d) Nearly normal errors(e) Nonlinear effect(f) Product of marginal slopes(g) Partial slope for X2(h)
Match the item in the first column with the concept that can be observed, test statistic, or estimate from the second column.Direct effect of X2(a) Similar variances(b) F-statistic(c) Collinearity(d) Nearly normal errors(e) Nonlinear effect(f) Product of marginal slopes(g) Partial slope for X2(h)
Match the item in the first column with the concept that can be observed, test statistic, or estimate from the second column.Scatterplot of X2 on X1(a) Similar variances(b) F-statistic(c) Collinearity(d) Nearly normal errors(e) Nonlinear effect(f) Product of marginal slopes(g) Partial slope for
Match the item in the first column with the concept that can be observed, test statistic, or estimate from the second column.Scatterplot of Y on X2(a) Similar variances(b) F-statistic(c) Collinearity(d) Nearly normal errors(e) Nonlinear effect(f) Product of marginal slopes(g) Partial slope for
Match the item in the first column with the concept that can be observed, test statistic, or estimate from the second column.Scatterplot of Y on X1(a) Similar variances(b) F-statistic(c) Collinearity(d) Nearly normal errors(e) Nonlinear effect(f) Product of marginal slopes(g) Partial slope for
Television news programs attempt to attract viewers in local markets by claiming to offer the “best” local weather forecasts. The particular station in this exercise claims to offer more accurate predictions of the next day’s weather. In particular, it claims to predict rainfall and
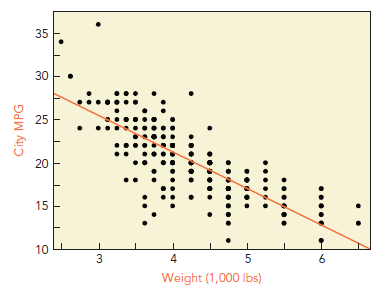
The 311 cases that make up this data set are types of cars sold in the 2016 model year in the United States. The variables include the weights (in thousands of pounds) and urban driving mileage (in miles per gallon). For this analysis, the response is 100 divided by the miles per gallon, and the
R&D Expenses This table contains accounting and financial data that describe 409 companies operating in the semiconductor industry in 2014. One column gives the expenses on research and development (R&D), and another gives the total assets of the companies. Both columns are reported in
In the examples of autocorrelation in regression in this chapter, the Durbin Watson statistic D was less than 2. What would it mean about the data if one found a significant value of D > 2? Does this explain why D is typically less than 2 when the errors are dependent?
Management of a retail chain has been tracking the growth of sales, regressing the company’s sales versus the number of outlets. Their data are weekly, spanning the last 65 weeks, since the chain opened its first outlets. What lurking variable might introduce dependence into the errors of
For each data table, before answering the questions, determine whether the simple regression model is a reasonable description of the association between the two indicated variables. In particular, consider the conditions needed for the reliable use of the SRM. Then answer the listed questions. The
For each data table, before answering the questions, determine whether the simple regression model is a reasonable description of the association between the two indicated variables. In particular, consider the conditions needed for the reliable use of the SRM. Then answer the listed questions. The
Referring to the previous scenario, suppose that during the first 12 weeks, this company was the only clothing retailer in a busy mall. During the second 12 weeks, a rival company opened. Then, during the third period, a second rival opened. Would the SRM be a useful description of the relationship
A company tracks the level of sales at retail outlets weekly for 36 weeks. During the first 12 weeks, a fixed level of advertising was used each week to draw in customers. During the second 12 weeks, the level of advertising changed. During the last 12 weeks, a third level of advertising was used.
Suppose that large diamonds (more than 1.5 carats) sold at retail tend to be of very mixed quality, whereas small diamonds have consistent quality (more uniform color, clarity, and attractive cut). If this is the case, can we use the SRM to describe the relationship between price and weight among
You suspect that the pattern relating sales (Y) to levels of advertising (X) is not linear (perhaps a log transformation is needed to represent diminishing marginal returns). Explain how you can still use the SRM as a framework for modeling the variation in the data.
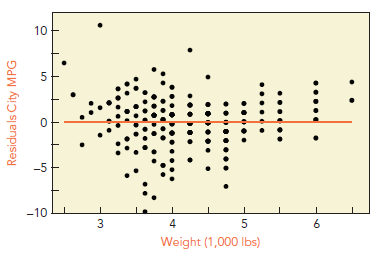
The mileage data in Figure 20.2 excludes hybrid cars. If these were added to the data, would they produce positive or negative residuals in Figure 20.3?Figure 20.2Figure 20.3 35 30 25 15 10 3 4 5 Weight (1,000 lbs) City MPG 10 -5 -10 4 5 Weight (1,000 lbs) Residua ls City MPG 3.
If an equation uses the log of the explanatory variable, as in ŷ = b0 + b1 log x, then what does the intercept b0 tell you?
If an equation uses the reciprocal of the explanatory variable, as in ŷ = b0 + b11/x, then what does the intercept b0 tell you?
The section Behind the Math: Different Logs shows that, because logs to different bases are proportional, we can use either base-10 logs or natural logs in regression when estimating elasticity. The estimated elasticity is the same. Are the r2 and se the same as well?
The section Behind the Math: Different Logs shows that logs to different bases are proportional to one another. For example, loge x = (loge 10) log10 x < 2.303 log10 x. If Sales is the variable response in the example of market pricing in this chapter, then what is the correlation between loge
If quantity sold increases with price, would the elasticity be positive, negative, or zero?
If the elasticity of quantity with respect to price is close to zero, how are the price and quantity related?
Can you think of any lurking factors behind the relationship between weight and fuel consumption among car models?
If diamonds have a linear relationship with essentially no fixed costs, which costs more: a single 1-carat diamond or two 1/2 -carat diamonds? Does that make sense to you?
If the correlation between X and Y is 0.8 and the slope in the regression of Y on X is 1.5, then which of X or Y has larger variation?
If the standard deviation of X matches the standard deviation of Y, then what is the relationship between the slope in a least squares regression of Y on X and the correlation between X and Y?
A customized milling operation uses the equation $200 plus $150 per hour to give price estimates to customers. If it pays a fixed fee to ship these orders, how should it change this equation if the cost of shipping goes up?
A package delivery service uses a regression equation to estimate the fuel costs of its trucks based on the number of miles driven. The equation is of the form Estimated Dollars = b0 + b1 Miles. If gasoline prices go up, how would you expect the fit of this equation to change?
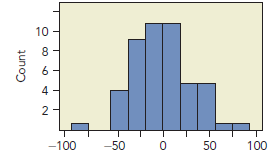
This histogram summarizes residuals from a fit that regresses the number of items produced by 50 employees during a shift on the number of years with the company. Estimate se from this plot. 10 - 8- 4 -50 0 50 100 -100 Count 2.
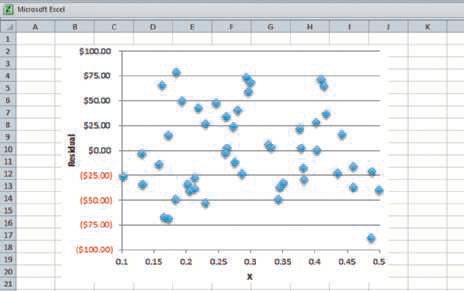
From looking at this plot of the residuals from a linear equation, estimate the value of se. Micrasan Eicei $100.00 $75.00 4. $sa.00 $25.00 10 50.00 11 12 (525.00) 13 14 15 16 17 (550.00) (S75.00) 18 (S100.00) 19 015 0.1 02 0.25 0.3 0.35 04 0. 0.45 20 21 Residual
In general, is the linear least squares regression equation of Y on X the same as the equation for regressing X on Y?
On a sheet of paper, write the numerals 1, 2, 3, and 4 in large print. Ask several friends to pick a number “at random.” (Don’t let anyone see what others pick. We want independent choices.)(a) Describe the choices if your friends pick the numbers randomly.(b) Do your friends pick the numbers
Where should the control limits for an X-bar chart be placed if the design of the process sets a = 0.0027 with the following parameters (assume that the sample size condition for control charts has been verified)?(a) µ = 10, σ = 5, and n = 18 cases per batch(b) µ = -4, σ = 2, and n = 12 cases
Where should the control limits in an X-bar chart be placed if the design of the process sets a = 0.01 with the following parameters (assume that the sample size condition for control charts has been verified)?(a) µ = 100, σ = 20, and n = 25 cases per batch(b) µ = 2000, σ = 2000 and n = 100
An X-bar control chart monitors the mean of a process by checking that the average stays between µ - 3σ/√n and µ + 3σ/√n. When the process is under control,(a) What is the probability that five consecutive sample means of n cases stay within these limits?(b) What is the probability that all
Match each item on the left with its correct description on the right.p̂ ± se(p̂)(a) Sampling distribution of X̅(b) Margin of error(c) 100% confidence interval for p(d) Estimated standard error of Y̅(e) Estimated standard error of p̂(f) An interval with about 95% coverage(g) Actual standard
Match each item on the left with its correct description on the right.2se(X̅)(a) Sampling distribution of X̅(b) Margin of error(c) 100% confidence interval for p(d) Estimated standard error of Y̅(e) Estimated standard error of p̂(f) An interval with about 95% coverage(g) Actual standard error
Match each item on the left with its correct description on the right.N(µ, σ2/n)(a) Sampling distribution of X̅(b) Margin of error(c) 100% confidence interval for p(d) Estimated standard error of Y̅(e) Estimated standard error of p̂(f) An interval with about 95% coverage(g) Actual standard
Match each item on the left with its correct description on the right.s/√n(a) Sampling distribution of X̅(b) Margin of error(c) 100% confidence interval for p(d) Estimated standard error of Y̅(e) Estimated standard error of p̂(f) An interval with about 95% coverage(g) Actual standard error of
Match each item on the left with its correct description on the right.σ/√n(a) Sampling distribution of X̅(b) Margin of error(c) 100% confidence interval for p(d) Estimated standard error of Y̅(e) Estimated standard error of p̂(f) An interval with about 95% coverage(g) Actual standard error of
Match each item on the left with its correct description on the right.1/(0.05)2(a) Sampling distribution of X̅(b) Margin of error(c) 100% confidence interval for p(d) Estimated standard error of Y̅(e) Estimated standard error of p̂(f) An interval with about 95% coverage(g) Actual standard error
Match each item on the left with its correct description on the right.[0, 1](a) Sampling distribution of X̅(b) Margin of error(c) 100% confidence interval for p(d) Estimated standard error of Y̅(e) Estimated standard error of p̂(f) An interval with about 95% coverage(g) Actual standard error of
Match each item on the left with its correct description on the right.√p̂(1 – p̂)/n(a) Sampling distribution of X̅(b) Margin of error(c) 100% confidence interval for p(d) Estimated standard error of Y̅(e) Estimated standard error of p̂(f) An interval with about 95% coverage(g) Actual
Match each item on the left with its correct description on the right.t0.025,n-1(a) Sampling distribution of X̅(b) Margin of error(c) 100% confidence interval for p(d) Estimated standard error of Y̅(e) Estimated standard error of p̂(f) An interval with about 95% coverage(g) Actual standard error
Mark each statement True or False. If you believe that a statement is false, briefly explain why you think it is false.To guarantee a margin of error of 0.05 for the population proportion p, a survey needs to have at least 500 respondents.
Mark each statement True or False. If you believe that a statement is false, briefly explain why you think it is false.The 95% t-interval for m works best if the sample data are normally distributed.
What are the chances that X̅ > µ?
What is the coverage of the confidence interval [p̂ to 1]?
A summary of sales of a department store says that the average retail purchase was $125 with a margin of error equal to $15. What does the margin of error mean in this context?
A news report summarizes a poll of voters and then adds that the margin of error is plus or minus 4%. Explain what that means.
In a survey of employees, Watson-Wyatt reported that 51% had confidence in the actions of senior management. 17 To be 95% confident that at least half of all employees have confidence in senior management, how many would have to be in the survey sample?
Match the description of each concept with the correct symbol or term.Identifies the alternative hypothesis(a) t-statistic(b) µ0(c) p-value(d) p-value < α(e) Type I error(f) z-statistic(g) Type II error(h) α-level(i) H0: µ ≥ 0(j) Ha, H1
Match the description of each concept with the correct symbol or term.Largest α-level for which a test rejects the null hypothesis(a) t-statistic(b) µ0(c) p-value(d) p-value < α(e) Type I error(f) z-statistic(g) Type II error(h) α-level(i) H0: µ ≥ 0(j) Ha, H1
Match the description of each concept with the correct symbol or term.Occurs if the p-value is larger than a when H0 is false(a) t-statistic(b) µ0(c) p-value(d) p-value < α(e) Type I error(f) z-statistic(g) Type II error(h) α-level(i) H0: µ ≥ 0(j) Ha, H1
The biostatistician who designed a study for investigating the efficacy of a new medication was fired after the study. The tested null hypothesis states that the drug is no better than a placebo. The t-statistic that was obtained in the study of 400 subjects was t = 20, rejecting the null
Suppose that 2% of the modifications proposed to improve browsing on a Web site actually do improve customers’ experience. The other 98% have no effect. Now imagine testing 100 newly proposed modifications. It is quick and easy to measure the shopping behavior of hundreds of customers on a busy
Match each definition on the left with a mathematical expression or term on the right.Difference between the averages in two samples(a) t = -4.6(b) t = 1.3(c) µ1 €“ µ2(d) (e) n - 1(f) xÌ…1 €“ xÌ…2(g) Confounding(h) Randomization(i)
Match each definition on the left with a mathematical expression or term on the right.Estimate of the standard error of the difference between two sample means(a) t = -4.6(b) t = 1.3(c) µ1 €“ µ2(d) (e) n - 1(f) xÌ…1 €“ xÌ…2(g)
Showing 2200 - 2300
of 4119
First
16
17
18
19
20
21
22
23
24
25
26
27
28
29
30
Last
Step by Step Answers