New Semester
Started
Get
50% OFF
Study Help!
--h --m --s
Claim Now
Question Answers
Textbooks
Find textbooks, questions and answers
Oops, something went wrong!
Change your search query and then try again
S
Books
FREE
Study Help
Expert Questions
Accounting
General Management
Mathematics
Finance
Organizational Behaviour
Law
Physics
Operating System
Management Leadership
Sociology
Programming
Marketing
Database
Computer Network
Economics
Textbooks Solutions
Accounting
Managerial Accounting
Management Leadership
Cost Accounting
Statistics
Business Law
Corporate Finance
Finance
Economics
Auditing
Tutors
Online Tutors
Find a Tutor
Hire a Tutor
Become a Tutor
AI Tutor
AI Study Planner
NEW
Sell Books
Search
Search
Sign In
Register
study help
mathematics
business statistics
Business Statistics 3rd Canadian Edition Norean D. Sharpe, Richard D. De Veaux, Paul F. Velleman, David Wright - Solutions
According to the Pew Research Center, 53% of U.S. adults owned a tablet in January 2018. Use the normal approximation to the binomial distribution to calculate the probability that, from a sample of 24 U.S. adults,a. Fewer than 10 adults own a tablet.b. 6, 7, 8, 9, or 10 adults own a tablet.c. 11,
According to eMarketer, adults in the United States spent an average of 92 minutes per day on social media platforms Facebook, Snapchat, and Instagram in 2017. Assume that minutes per day on these platforms follow a normal distribution with a standard deviation of 27 minutes.a. What is the
A credit score measures a person’s creditworthiness. According to the credit-scoring company Experian, the average credit score for Americans in March 2018 was 675. Assume the scores are normally distributed with a standard deviation of 35. Determine the interval of credit scores that area. One
According to the Internal Revenue Service, the average income tax refund for the 2018 tax year was $2,780. Assume the refund per person follows the normal probability distribution with a standard deviation of $950.a. What is the probability that a randomly selected tax return refund from the 2018
According to hybridcars.com, the market share of hybrid cars in the United States in September 2017 is 2.5%. Consider a random sample of 20 cars in the United States.a. Use the binomial distribution to determine the probability that there are no hybrid cars from this sample.b. Use the binomial
According to Experian, 2.4% of car-loan payments were 30 days past due in 2016. Lenders prefer auto loans to home mortgages because when borrowers get into financial trouble they tend to pay the auto loan first because cars are more easily seized by banks. A random sample of 24 car loans was
According to the Department of Transportation, United Airlines lost an average of 2.01 bags per 1,000 passengers during October 2017. Assume the number of lost bags follows the Poisson distribution.a. What is the probability that, of the next 1,000 United passengers, nobody will lose their bag?b.
According to the Graduate Management Admission Council, applications to two-year MBA programs have been on the decline during the past few years. A survey during 2016 reported that 43% of U.S. schools experienced fewer applications when compared to 2015. A random sample of eight U.S. schools with a
According to the American Marketing Association, in December 2015 20% of Facebook users were between 25 and 34 years old. If a random sample of nine adults was selected.a. What is the probability that exactly two adults from this sample were between 25 and 34 years old?b. What is the probability
According to the University Business Officers, in 2014–2015, 89% of first-time, full-time freshmen at private colleges were the recipients of some form of financial aid. If a random sample of six freshmen was selected for the academic year 2014–2015:a. What is the probability that all six
In 2017, 80% of Southwest Airlines flights arrived at their destinations on time. Suppose a random sample of 12 Southwest Airlines flights was selected.a. What is the probability that all 12 flights were on time?b. What is the probability that more than 9 flights were on time?c. What is the
According to the IDC, in the fourth quarter of 2015 only 1.2% of cellphones in the world used a Windows based operating system. If a random sample of 25 mobile devices was selected:a. Use the binomial distribution to determine the probability that fewer than three devices from this sample use the
According to IDC, 87% of smartphones in the world use Google’s Android operating system in the third quarter of 2016. Answer the following questions based on a random sample of 14 smartphone users.a. What is the probability that exactly nine people from this sample have a smartphone using the
According to Fortune, as of January 2018, 5% of chief executive officers were women. Answer the following questions based on a random sample of 12 CEOs:a. What is the probability that one corporate officer was female?b. What is the probability that fewer than four corporate officers were female?c.
According to a survey by Statista from February 2016, about 35% of Snapchat users are 18 to 24 years old. Consider a random sample of nine Snapchat users.a. What is the probability that exactly three users are 18 to 24 years old?b. What is the probability that fewer than four users are 18 to 24
A graduate class has 12 students with A grades and 16 students with B grades. Calculate the number of ways in which 4 A students and 5 B students can be uniquely selected.
Consider the following experiment—a card is chosen randomly from a 52-card deck, observed, and not replaced. A second card is drawn and observed. Consider the following events:A = The first card is the jack of diamondsB = The second card is the jack of diamondsa. Are these two events mutually
Consider the following experiment—a card is chosen randomly from a 52-card deck, observed, and then replaced. After shuffling the deck, a second card is drawn and observed. Consider the following events:A = The first card is the jack of diamondsB = The second card is the jack of diamondsa. Are
Consider an experiment with the following two events:A = A statistics test is scheduled for 8:00 a.m.B = Every student arrives to class on time for the testa. Are these two events mutually exclusive?b. Are these two events independent?
Determine the number of ways in which a jury of 6 men and 6 women can be selected from a group of 13 men and 15 women.
A research study needs to select three people to participate from a group of nine. Calculate the total number of unique groups that can be formed.
An event planner needs to decide a seating arrangement for eight people at a table. Calculate the total number of possible arrangements from which to choose.
There are four teams in the NFL’s NFC North Division. How many different ways can the four teams finish at the end of the season in the standings?
A panel of 12 jurors needs to be selected from a group of 50 people. How many different juries can be selected?
In a race with eight swimmers, how many ways can the swimmers finish first, second, and third?
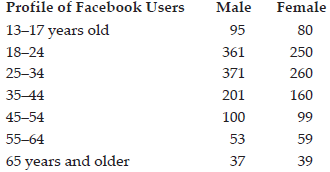
The following table shows the breakdown of Facebook?s global users by age and gender, in millions: Determine the probability that a randomly selected person a. Was a female b. Was 18 to 24 years old c. Was a woman who was 35 years old or older d. Was either a women or 25 to 34 years old e. Was a
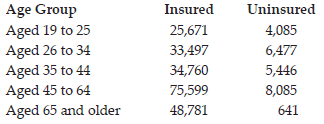
The following table shows the number of people, in thousands, in the United States with and without health insurance in 2016, according to the U.S. Census Bureau: a. What percentage of the U.S. population in 2016 did not have health insurance and was between the ages of 19 to 25 years? b. What
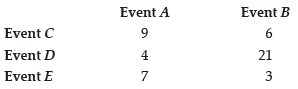
Determine the following probabilities:a. P(A | C)b. P(C | A)c. P(B | E)d. P(E | B) Event B 6 Event A Event C Event D Event E 21 3
Determine the following probabilities: a. P(A) b. P(B) c. P(C) d. P(D) e. P(E) Event B 6 Event A Event C Event D Event E 21 3
The following table shows the 2016 carbon emissions, in metric tons, for 20 countries emitting the most carbon emissions. These data can also be found in the Excel file titled emissions.xlsx.Country
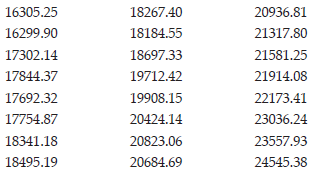
The following table lists monthly average values for the Dow Jones Industrial Index for January 2016 until December 2017. These data can also be found in the Excel file titled Dow Jones.xls. a. Calculate the mean. b. Calculate the median. c. Determine the mode. d. Describe the shape of this
The following table lists the combined number of viewers for late-night news for ABC, CBS, FOX, and NBC affiliates.Year Viewers (in
The following data represent the number of days homes were on the market before being sold in New Castle County, Delaware, in 2017: a. Calculate the mean. b. Calculate the median. 55 56 64 44 13 13 98 87 45 142 8 47 79 80 74 62 79 74
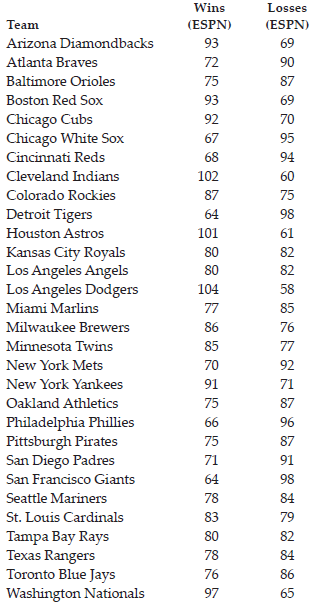
The following table shows data you are already familiar with from Chapter 2, the number of wins and losses in the Major League for 2017. These data can also be found in the Excel file titled MLB payroll wins and losses.xls. a. Find the percentile rank for the wins by the Mets. b. Find the
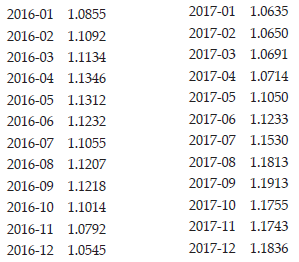
The following data show the monthly exchange rates for U.S. dollars in terms of 1 euro from January 2016 to December 2017. The data can also be found in the Excel file Euro Dollar Exchange Rate.xls. a. Calculate the mean. b. Calculate the median. c. Determine the mode. d. Which of these three
The following table shows the monthly seasonally adjusted U.S. civilian unemployment rate (bls.gov) from January 2016 until December 2017. You can find the data in the file titled US unemployment.xlsx.4.9 4.9 5.0 5.0 4.7 4.9 4.9 4.9 5.0 4.9 4.6 4.74.8 4.7 4.5 4.4 4.3 4.3 4.3 4.4 4.2 4.1 4.1 4.1a.
The Excel file titled US Housing Starts.xlsx lists the number of housing starts in the United States each year from 1959 to 2017 provided by the U.S. Department of Commerce. Construct a display that best describes these data.
The Excel file titled gasoline prices.xlsx lists the average monthly price per gallon of regular gasoline in the United States from September 1990 to April 2018 from the U.S. Energy Information Administration. Construct a line chart using these data and describe the trend.
The Excel file MLB payroll.xlsx provides the payroll and number of wins for all the Major League Baseball teams during the 2017 season. Construct a scatter plot using these data. Describe the relationship between payroll and number of wins.
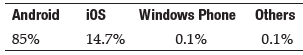
The following table lists market share for cell phone operating systems for Q1 2017. Construct a display that best describes these data Windows Phone Others Android ios 85% 14.7% 0.1% 0.1%
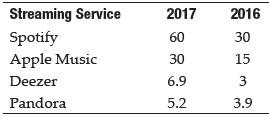
The following table shows the number (in millions) of worldwide paid subscribers for four music-streaming services. Construct a display that best describes these data. Streaming Service 2017 2016 Spotify 60 Apple Music 30 15 Deezer 6.9 3 Pandora 5.2 3.9
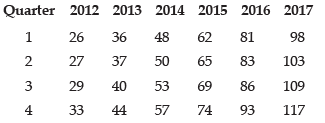
The following table shows the numbers of worldwide Netflix subscribers in millions, each quarter from 2012 to 2017. Construct a line chart using these data. Describe the relationship between time and number of subscribers. Quarter 2012 2013 2014 2015 2016 2017 98 48 36 81 62 26 37 27 50 65 83 103
The following table shows the number of events (golf tournaments) played by the top 25 golfers on the PGA tour. These data can also be found in the Excel file PGA money list.xlsx. a. Construct a stem and leaf display for these data. b. Construct a stem and leaf display, splitting the stems from
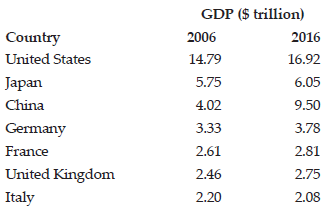
The following table shows real gross domestic product (GDP) for various countries in 2006 and 2016: Construct a display that best describes these data. GDP ($ trillion) Country 2006 2016 United States 14.79 16.92 5.75 6.05 Japan China 4.02 9.50 Germany 3.33 3.78 France 2.61 2.81 United Kingdom
A study has concluded that the average credit card debt of college graduates has increased from 2016 to 2017.
The education level of survey respondentsLevel Number of RespondentsHigh school..........................................................168Bachelor’s
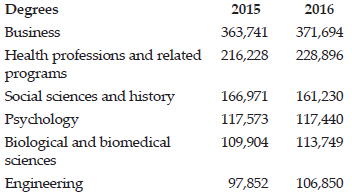
The following table shows the number of students of the six most popular bachelor?s degrees conferred in the United States in 2015 and 2016. With the goal of comparing the number of graduating students from 2015 to 2016 for each major, construct a bar chart that summarizes these data. Degrees
Seventy-eight percent of customers at the Holiday Inn hotel in Dover, Delaware, arrived before 6 PM last week.
The average American viewer watches 151 hours of TV per month.
The average Amazon.com rating of the book The Complete Idiot’s Guide to Statistics 2e, by 126 reviewers is 4.3 on a scale of 1 to 5.
Based on a random sample of hotels in Chicago and a random sample of hotels in Atlanta, it was concluded that the average cost of a hotel room in Chicago was greater than one in Atlanta.
The average salary of a random sample of 50 high school teachers in 2017 was $52,400.
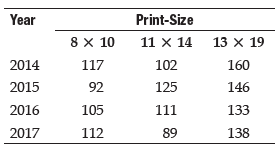
Identify the time series data in the table. Which shows the number of photographs sold at Island Art, a retail store in Stone Harbor, New Jersey, by print-size over a four-year period: Year Print-Size 8 x 10 11 x 14 13 x 19 2014 117 102 160 2015 92 125 146 2016 105 111 133 2017 112 89 138
Identify the cross-sectional data in the table. Which shows the number of photographs sold at Island Art, a retail store in Stone Harbor, New Jersey, by print-size over a four-year period: Year Print-Size 8 x 10 11 x 14 13 x 19 2014 117 102 160 2015 92 125 146 2016 105 111 133 2017 112 89 138
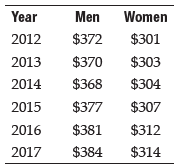
Identify the cross-sectional data in the table. Which show the median usual weekly real earnings of full-time workers by gender over a five-year period: Year Men Women $372 $301 2012 $370 $303 2013 $368 $304 2014 $377 $307 2015 $381 $312 2016 $384 $314 2017
Identify the time series data in the table. Which show the median usual weekly real earnings of full-time workers by gender over a five-year period: Year Men Women $372 $301 2012 $370 $303 2013 $368 $304 2014 $377 $307 2015 $381 $312 2016 $384 $314 2017
The following table shows the average values of the stock market as measured by the Dow Jones Industrial Average during the second half of 2017:Date Closing
The following table shows the closing price of the three major stock markets on March 29, 2018:Stock Market Closing PriceDow Jones
S&P provides ratings for the creditworthiness of countries around the world on a letter scale from AAA (highest) to D (lowest). The following table shows the S&P rating for various countries in April 2018.Country
In order to promote the development of electric cars, the government has proposed rating passenger vehicles on a letter scale of A–D based on fuel efficiency and emissions. The following five vehicles were given these ratings:Vehicle
Movie ratings: G, PG, PG-13, RIdentify the type of data (qualitative/quantitative) and the level of measurement
SAT scores for graduating high school studentsIdentify the type of data (qualitative/quantitative) and the level of measurement
The state in which the respondents in a survey resideIdentify the type of data (qualitative/quantitative) and the level of measurement
Final exam scores for your statistics class on a scale of 0 to 100Identify the type of data (qualitative/quantitative) and the level of measurement
A list of the graduating high school seniors by class rankIdentify the type of data (qualitative/quantitative) and the level of measurement
The uniform number of each member on a sports teamIdentify the type of data (qualitative/quantitative) and the level of measurement
The performance rating of employees classified as Above Expectations, Meets Expectations, or Below ExpectationsIdentify the type of data (qualitative/quantitative) and the level of measurement
The ethnicity of the respondents in a survey classified as White, African American, Asian, or OtherIdentify the type of data (qualitative/quantitative) and the level of measurement
The voting intentions of the respondents in a survey classified as Republican, Democrat, or UndecidedIdentify the type of data (qualitative/quantitative) and the level of measurement
The years in which the respondents to a survey were bornIdentify the type of data (qualitative/quantitative) and the level of measurement
The genders of the respondents in a surveyIdentify the type of data (qualitative/quantitative) and the level of measurement
The ages of the respondents in a surveyIdentify the type of data (qualitative/quantitative) and the level of measurement
The marital status of survey respondentsStatus Number of
The average monthly rainfall in inches for the city of Wilmington throughout the yearIdentify the type of data (qualitative/quantitative) and the level of measurement
The average monthly temperature in degrees Fahrenheit for the city of Wilmington, Delaware, throughout the yearIdentify the type of data (qualitative/quantitative) and the level of measurement
For which one of the situations described in Exercise 4 would Spearman’s rho be appropriate?In ExerciseFor which one of the following situations would a Wilcoxon signed-rank test be appropriate?a) The Mohs scale rates the hardness of minerals. If one mineral can scratch another, it’s judged to
A call centre receives calls from customers that are dealt with by agents. Records indicate that 4.2% of customers are not satisfied with the agent and ask to speak with a supervisor. The supervisor is able to resolve the issue 43% of the time so that the customer ends up satisfied. When the
Statistics Canada provides data on the number of cases in adult criminal court by type of sentence: “fine,” “restitution,” and “other.” In a recent year, the probability that property crime cases in Canada resulted in a sentence of “restitution” (as opposed to other sentences) was
When solar panels rated at 250 watts of power are manufactured, the power of the panels is not exactly 250 watts, but is Normally distributed with a mean of 250 watts and a standard deviation of 7.5 watts. When solar panels are connected together in series on a roof, the power generated is limited
A corner store stocks Maclean’s magazine and on average 4.5 customers purchase the magazine each month. The store owner orders six copies of the magazine each month. What is the probability of running out of stock?
For which one of the situations described in Exercise 4 would a Kruskal-Wallis test be appropriate?In Exercise 4For which one of the following situations would a Wilcoxon signed-rank test be appropriate?a) The Mohs scale rates the hardness of minerals. If one mineral can scratch another, it’s
For which one of the situations described in Exercise 3 would a Kendall’s tau be appropriate?In Exercise 3For which one of the following situations would a Wilcoxon signed-rank test be appropriate?a) Comparing the ratings of a new product on a five-point Likert scale by a panel of consumers with
It’s tough to find out how much people earn, but on September 3, 2011, The Economist reported that the average lawyer’s salary in Canada was $64,000. Suppose that today you interview a random sample of 35 lawyers in Canada and find that the average salary is $75,293 with a standard deviation of
For which one of the situations described in Exercise 4 would Kendall’s tau be appropriate?In ExerciseFor which one of the following situations would a Wilcoxon signed-rank test be appropriate?a) The Mohs scale rates the hardness of minerals. If one mineral can scratch another, it’s judged to
For which one of the situations described in Exercise 3 would Spearman’s rho be appropriate?In Exercise 3For which one of the following situations would a Wilcoxon signed-rank test be appropriate?a) Comparing the ratings of a new product on a five-point Likert scale by a panel of consumers with
A company offers vacations in the Caribbean including charter f lights from Toronto’s downtown airport at a range of prices per person assuming double occupancy. It plans to offer the same vacations at the same prices next year. Over the past year sales have been as follows:Selling Price per
Give examples of forecasting situations in which you would use (i) exponential smoothing, (ii) additive regression, and (iii) multiplicative regression. Describe whether these methods should be used for short- or long-term forecasts and the type of data to which they should be applied.
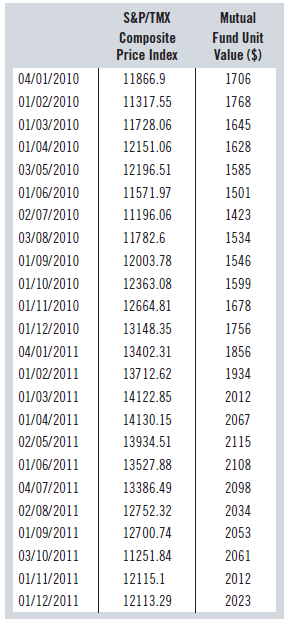
You’re working in the Marketing department of a financial institution and are preparing promotional materials for one of its mutual funds. Your boss has told you to prepare a graph showing how the past performance of the fund compares with the S&P TMX Composite Price Index during 2010 and
Many businesses are affected by the number of airline passengers, including the airlines themselves, plus hotels, restaurants, and the entertainment industry. It is therefore important to keep track of trends and make forecasts about the number of airline passengers. The data file contains the
Return to the oil price data of Exercise 46.a) Find a linear model for this series.b) Find an exponential model for this series.c) Use these methods to forecast the crude oil price for March 2007.d) The actual price for March 2007 was $58.70. Compute measures of forecast error (e.g., MAD and MAPE)
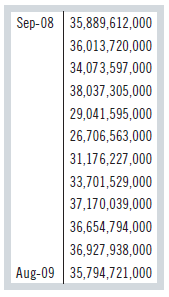
Natural gas is a major Canadian export and hence a major source of foreign exchange. The data file contains monthly Canadian exports of natural gas from April 2006 to March 2009 in millions of dollars.a) Fit an AR(2) model to the data. Which range of months do you use to fit the model? Give the
Trends in exports of industrial machinery are extremely important to Canada because of overseas competition from countries with lower wage rates. The data file contains monthly Canadian exports of industrial machinery from June 2006 to May 2009 in millions of dollars.a) Fit an AR(2) model to the
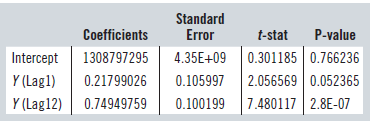
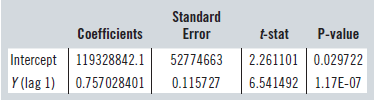
Canadian retail sales in dollars for September 2006 to August 2009 are shown in the graph for Exercise 33. An autoregressive model has been fitted with two independent variables at lags of 1 and 12, with the following result:Retail sales from September 2008 to August 2009 were:a) What feature in
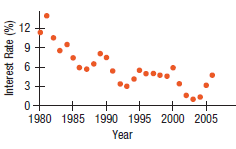
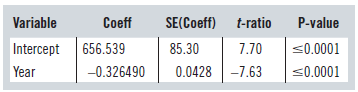
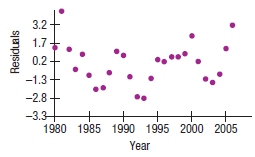
Average annual interest rates (banks, prime lending) in the United States from 1980 through 2006 are shown in the following time series graph:a) What components do you see in this series? Here’s a linear trend model fit to these data:Dependent variable is: Interest RateR-squared = 69.9% R-squared
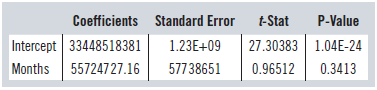
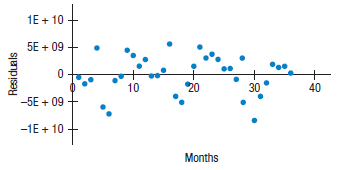
Canadian retail sales in dollars for September 2006–August 2009 are shown in the graph. The horizontal axis represents the number of months since August 2006.A linear regression analysis gives the following result:The residual graph is:a) What does the intercept represent?b) What does the
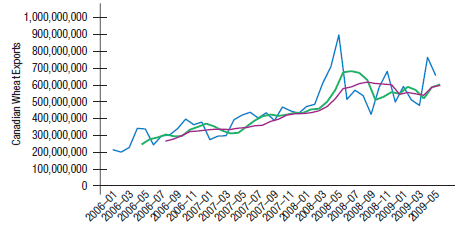
The graphs in Exercises 25 and 26 show Canadian wheat exports in dollars from January 2006 to May 2009. (Source: Based on Statistics Canada. [2011]. CANSIM Table 228-0001—Merchandise imports and exports, by major groups and principal trading areas for all countries, monthly [dollars].) The last
Suppose an autoregressive model is used for data in which quarterly sales in 2017 were 1.9, 1.7, 2.2, and 2.3 ($ billion).a) If a first-order autoregressive model is developed with estimated parameters of b0 = 0.100 and b1 = 1.12, compute the forecast for Q1 of 2018.b) Compare this forecast with
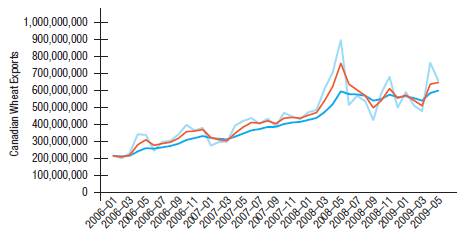
The graph shows Canadian wheat exports in dollars, from January 2006 to May 2009, in light blue, together with two exponential smoothings. One exponential smoothing has thesmoothing parameter α = 0.5, and the other has α = 0.2.CANSIMTable 228-0001—Merchandise imports and exports, by major
The graph shows Canadian wheat exports in dollars from January 2006 to May 2009 in blue, together with two moving averages. One moving average is averaged over four data points and the other over seven data points. a) Which moving average corresponds to the graph in green?b) Which moving
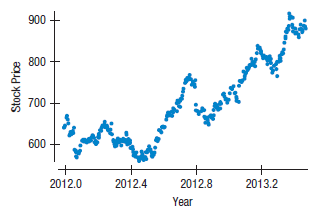
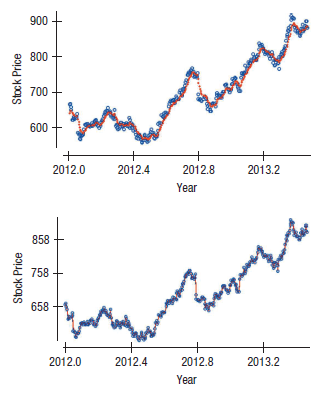
The following time series graph shows daily closing stock prices (adjusted for splits and dividends) for Google Inc. from January 1, 2008, through June 21, 2013.a) Which time series components are evident? Single exponential smoothing (SES) models were found for these data. Examine the following
Showing 1500 - 1600
of 4119
First
9
10
11
12
13
14
15
16
17
18
19
20
21
22
23
Last
Step by Step Answers