New Semester
Started
Get
50% OFF
Study Help!
--h --m --s
Claim Now
Question Answers
Textbooks
Find textbooks, questions and answers
Oops, something went wrong!
Change your search query and then try again
S
Books
FREE
Study Help
Expert Questions
Accounting
General Management
Mathematics
Finance
Organizational Behaviour
Law
Physics
Operating System
Management Leadership
Sociology
Programming
Marketing
Database
Computer Network
Economics
Textbooks Solutions
Accounting
Managerial Accounting
Management Leadership
Cost Accounting
Statistics
Business Law
Corporate Finance
Finance
Economics
Auditing
Tutors
Online Tutors
Find a Tutor
Hire a Tutor
Become a Tutor
AI Tutor
AI Study Planner
NEW
Sell Books
Search
Search
Sign In
Register
study help
mathematics
business statistics
Business Statistics 3rd Canadian Edition Norean D. Sharpe, Richard D. De Veaux, Paul F. Velleman, David Wright - Solutions
Many people believe that the crime rate declines with age.a) Take data from the data file to verify whether this is true using a scatterplot.b) Is the relationship between crime rate and age strong, medium, or weak?c) A statistician calculates the correlation coefficient for crime rate and age.
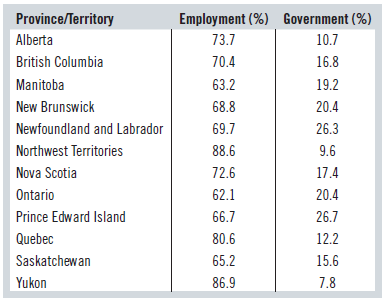
Canadians derive income from investment, employment, and government. Regions with high employment income would be expected to have less income from government sources.a) Draw a scatterplot and use it to verify whether this is true.b) Is the correlation coefficient an appropriate measure of the
Insurance companies carefully track claims histories so that they can assess risk and set rates appropriately. The National Insurance Crime Bureau reports that Honda Accords, Honda Civics, and Toyota Camrys are the cars most frequently reported stolen, while Ford Tauruses, Pontiac Vibes, and Buick
A CEO announces at the annual shareholders’ meeting that the new see-through packaging for the company’s f lagship product has been a success. In fact, he says, “There is a strong correlation between packaging and sales.” Criticize this statement on statistical grounds.
A chain of beauty salons has recently hired staff who appear to be overqualified for the job. The human resources department checks the average salary of staff with different levels of formal education ranging from 12 to 20 years (see the table on the next page).a) Draw a scatterplot of the data.b)
A biotechnology company wants to be sure that education level is rewarded by higher salary, and obtains the following table of average salary for number of years of formal education ranging from 12 to 20 years:Years of Education
A company that relies on internet-based advertising linked to key search terms wants to understand the relationship between the amount it spends on this advertising and revenue (in $).a) Which variable is the explanatory or predictor variable?b) Which variable is the response variable?c) Which
The human resources department at a large multinational corporation wants to be able to predict average salary for a given number of years of experience. Data on salary (in $1000s) and years of experience were collected for a sample of employees.a) Which variable is the explanatory or predictor
When asked this question in a survey, 70% (i.e., 21) of 30 people responded “yes”. Using a horizontal axis on which “driving ability” is rated on a scale from 1 (low) to 10 (high).a) Draw a histogram with 10 bins of a distribution of drivers in which 70% are above average.b) Identify the
We are experiencing longer than “usual” wait times. I got this message on 75% (i.e., 24) of 32 calls for customer service. For simplicity assume the maximum wait time is 11 minutes and use 11 bins in your histograms.a) Suppose “usual” means the mode of the wait time distribution. If
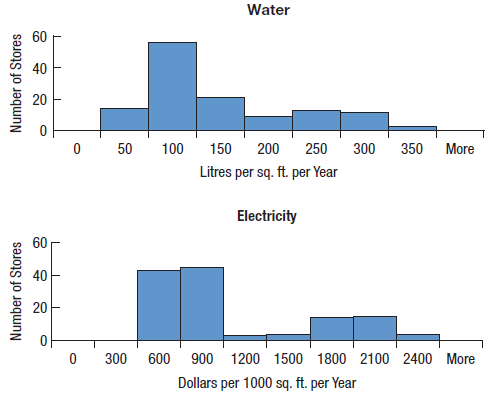
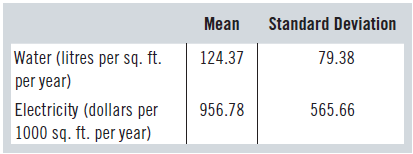
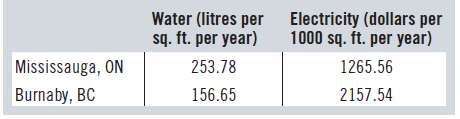
A major Canadian retailer with stores only in large cities includes food items in some stores but not in others. Selling food requires refrigeration equipment, which considerably increases the electricity bill. It also increases water usage for washing fresh food. The retailer is investigating ways
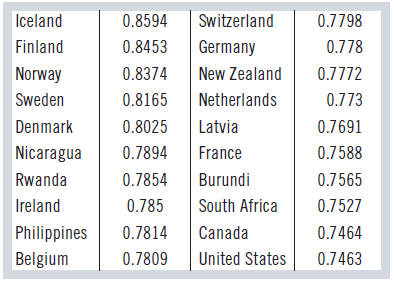
Each year, the World Economic Forum produces a Global Gender Gap Index which measures the differences between men and women with regard to four factors: (i) health and survival, (ii) educational attainment, (iii) economic participation and opportunity, and (iv) political empowerment. A higher score
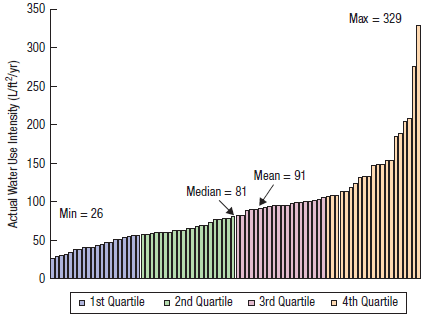
The Real Property Association of Canada surveyed 82 office buildings as to their water usage and graphed the number of litres of water used per square foot of office space per year (L/ft2/yr) for each building (actual data, not normalized for type of building).a) Construct a histogram of this data
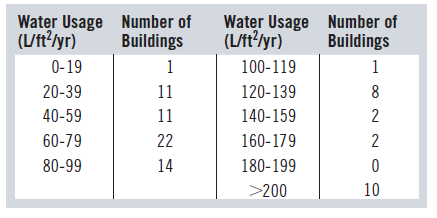
The Real Property Association of Canada surveyed 82 office buildings as to their water usage and obtained the following results in terms of the number of litres of water used per square foot of office space per year (L/ft2/yr) normalized for type of building:a) Taking into account the number of
A bank offers a guaranteed investment certificate (GIC) in which the interest rate is 0.5% in the first year, 1.2% in the second year, and 2.3% in the third year. Investors can withdraw their money at any time, but the increasing interest rate provides an incentive to keep the money invested. What
Production of copper from a mine in Quebec increased by 4% per year during the five years 2002-2006, by 7% per year during the three years 2007-2010, and by 21% per year during the 8 years 2010-2017. What is the average rate of increase per year during the 16 years 2002-2017?
Production of copper from a mine in Quebec increased by 4%, 7%, and 21% in the last three years, respectively. What is the average rate of increase over those three years?
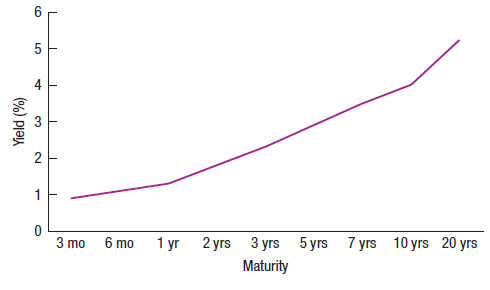
Alfredo Wagar, an analyst, produced the graph below showing how Canadian government bond yields depend on the amount of time left until the maturity of the bond. He recommends “buying bonds with three-month, six-month, and 20-year maturities, since their yields are above the general trend.”a)
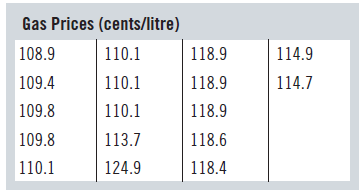
The actual prices at the 17 gas stations referred to in Exercise 35 were as follows:Construct a stem-and-leaf diagram of this data and point out any unusual features that are not evident from the histogram in Exercise 35. Gas Prices (cents/litre) 108.9 110.1 118.9 114.9 109.4 110.1 118.9 114.7
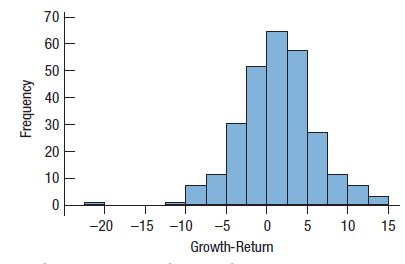
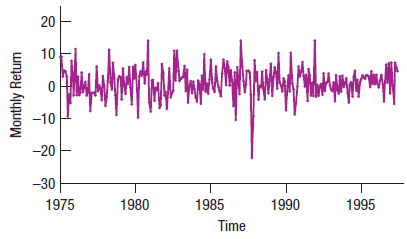
The following histogram displays the monthly returns for a group of mutual funds considered aggressive (or high-growth) over a period of 22 years, from 1975 to 1997:Here is the time series plot for the same data:a) What features of the data can you see in the histogram that aren’t clear from the
The GDP per capita for 2007 in selected eurozone countries is given in the table. Calculate the mean, median, and standard deviation of this
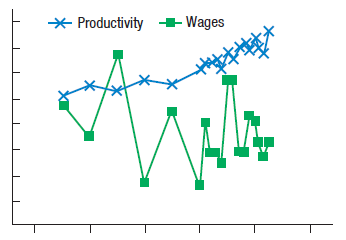
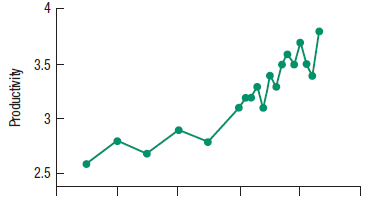
A second report by the research centre analyzed the relationship between productivity and wages. Comment on the graph it used. * Productivity +Wages
A national productivity research centre releases information on the efficiency of workers. In a recent report, it included the following graph showing a rapid rise in productivity. What questions do you have about this? 3.5 2.5 Productivity
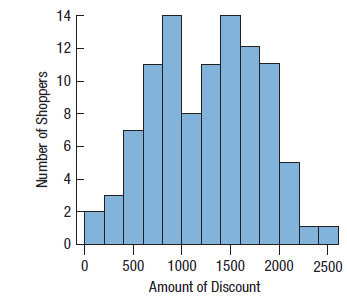
The discounts negotiated by the car buyers in Exercise 37 are classified by whether the buyer was male (code = 0) or female (code = 1). Compare the discounts of men and of women using an appropriate display and write a brief summary of the differences. 14 12 10 4 500 1000 1500 2000 2500 Amount of
A new hybrid car uses 3.8 litres of gasoline per 100 kilometres for city driving, according to websites advertising the car. Of course, not all of these cars are going to get the same fuel economy in all cities with all drivers. Would you expect the interquartile range (IQR) to be approximately
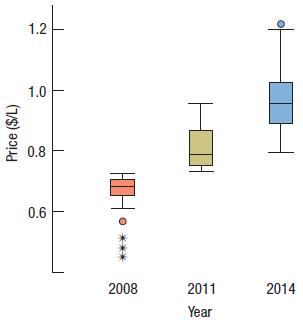
Here are boxplots of weekly gas prices at a service station in Alberta (in $/L):a) Compare the distribution of prices over the three years.b) In which year were the prices least stable (most volatile)? Explain. 1.2 1.0 0.8 0.6 2008 2011 2014 Year Price ($/L) • **
Statistics Canada’s National Housing Survey shows that, in 2013, median individual income was $27,600, 10% of individuals made more than $80,400, and the top 1% got more than $191,100. Why does Statistics Canada report the median earnings instead of the mean or mode of the earnings? What would be
Calculate the median, quartiles, mean, standard deviation, and coefficient of variation of the Consumer Price Indexes of Canadian provinces in 2013, from the data in the following table. Comment on whether the mean or median is higher. Is any province an outlier?Province
Canadian average weekly earnings (in $) classified by province and territory are given in the table on the next page for 2013.a) Calculate the median earnings.b) Calculate the interquartile range.c) Are any of the provinces or territories outliers with respect to average weekly earnings in
The weekly prices of one brand of frozen pizza over a three-year period in Montreal are provided in the data file. Use the price data to answer the following questions:a) Find the five-number summary for these data.b) Find the range and IQR for these data.c) Create a boxplot for these data.d)
The histogram that follows displays the 12-month returns (in percent) for a collection of mutual funds in 2017. Give a short summary of this distribution (shape, centre, spread, unusual features). 20 15 10 20 40 60 80 12-Month Return (in percent) kouanbey
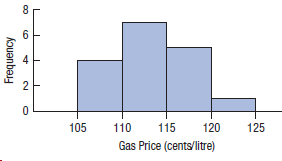
The histogram below shows the price of regular gas at 17 gas stations on a specific day in 2016. Describe the shape of the distribution and its centre and spread. 105 110 115 120 125 Gas Price (cents/litre) 8. 4) 2. Frequency
You wish to explain to your boss what effect taking the base-10 logarithm of the salary values in the company’s database will have on the data. As a simple example, you compare a salary of $10,000 earned by a part-time shipping clerk, a salary of $100,000 earned by a manager, and the CEO’s
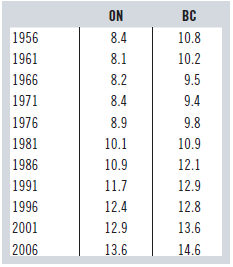
Draw a time series plot of the percentage of the British Columbia population aged 65 years and older from 1956 to 2006. Describe the trends that emerge.The table below gives the percentage of the Ontario and British Columbia population aged 65 years and older according to the Canadian Census from
Draw a time series plot of the percentage of the Ontario population aged 65 years and older from 1956 to 2006. Describe the trends that emerge.The table below gives the percentage of the Ontario and British Columbia population aged 65 years and older according to the Canadian Census from 1956 to
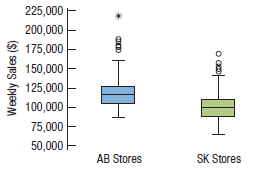
Recall the distributions of the weekly sales for the regional stores in Exercise 25. Following are boxplots of weekly sales for this same food store chain for stores of similar size and location in two different provinces: Alberta (AB) and Saskatchewan (SK). Compare the distribution of sales for
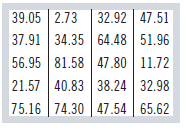
Calculate the 12th and 60th percentiles of the purchases of the customers in Exercise 2. Interpret the meaning of the 12th percentile. 39.05 2.73 32.92 47.51 37.91 34.35 64.48 51.96 56.95 81.58 47.80 11.72 21.57 40.83 38.24 32.98 75.16 74.30 47.54 65.62
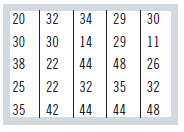
Calculate the 10th and 80th percentiles of the ages of the customers in Exercise 1. Interpret the meaning of the 80th percentile. 20 32 34 29 30 30 30 14 29 11 38 22 44 48 26 25 22 32 35 32 35 42 44 44 48
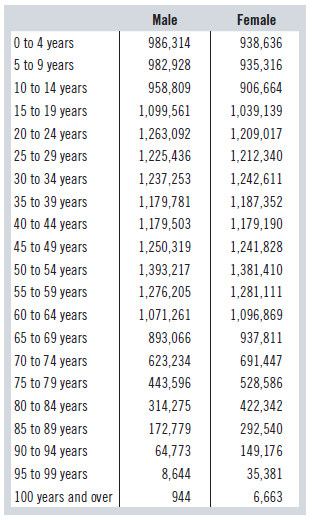
Calculate the average age of females in the Canadian population in 2014, assuming that the average (midpoint) age of people over 100 is 103.The table below gives the age distribution of the Canadian population in 2014: Male Female 0 to 4 years 986,314 938,636 5 to 9 years 935,316 982,928 10 to 14
Calculate the average age of males in the Canadian population in 2014, assuming that the average (midpoint) age of people over 100 is 103.The table below gives the age distribution of the Canadian population in 2014: Male Female 0 to 4 years 986,314 938,636 5 to 9 years 935,316 982,928 10 to 14
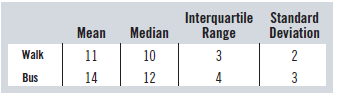
In order to get to campus, a student has to walk to the bus stop and then take a bus to the university. She monitors how much time this journey takes for 55 days. The time taken in minutes for each stage of her journey varies according to the information in the following table:If possible,
Data on the website traffic for KEEN Footwear, obtained from Google Analytics, are in the file ch04_MCSP_KEEN. Open the file using a statistics package and find data on Country of Origin, Top Keywords, Online Retailers, User Statistics, and Page Visits. Create frequency tables, bar charts, and pie
Loblaw has three types of stores: corporate, franchised, and affiliated. The store banners for the corporate stores include Atlantic Superstore, Cash & Carry, Extra Foods, Loblaws, Loblaw Superstore, Maxi, Maxi & Cie, Provigo, The Real Canadian Superstore, and Zehr. The trade names of the
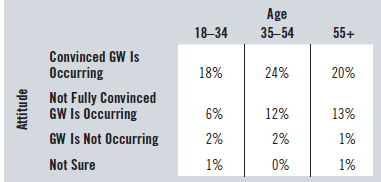
A study by Angus Reid Strategies shows different attitudes toward global warming (GW) (www.angus-reid.com/wp-content/uploads/archivedpdf/2008.06.25_GreenShift_1.pdf). The table that follows summarizes different attitudes according to different age groups. For instance, 20% of Canadian adults are
Boston Consulting Group forecasts the percentage of labour costs that can be saved by 2025 from the adoption of advanced robotics. It projects that 24% of the labour costs in Canada can be saved in this way. Graph the data in the following table to compare Canada with selected other countries,
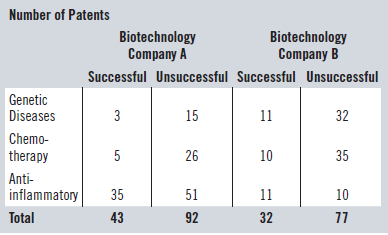
Small biotechnology companies are research intensive and develop chemical compounds that may prove to be useful drugs, but they typically do not have the funding or global reach to test the compounds for government approval or to market drugs worldwide. Instead, they sell the patents on the
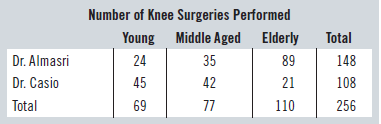
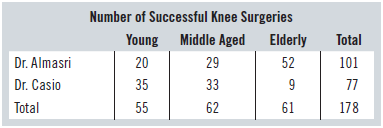
In a certain hospital, knee surgeries are performed by either Dr. Almasri or Dr. Casio. Last year’s number of surgeries performed and number that were successful are given in the following tables for three patient age groups.a) Draw a chart showing the number of successful and unsuccessful knee
This study captures the daily activities of Canadians to show marketers what opportunities they have to present their messages. It finds that, in an average day, adult Canadians divide their time as follows:Time Spent (hours)
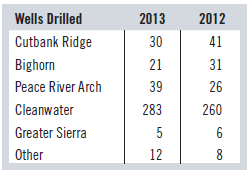
The name Encana combines the words ENergy, CANada, and Alberta. The numbers of oil and gas wells Encana drilled in five major fields during 2012 and 2013 are as follows:a) Draw bar graphs to compare the numbers of wells drilled during 2012 and 2013 with the names of the fields on the horizontal
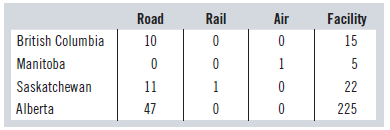
Accidents in Canada involving dangerous goods must be reported to the government and are recorded by Statistics Canada. Set out below is a summary of the number of such accidents in four selected provinces during 2012:a) Complete the table by calculating the marginal distributions for rows and
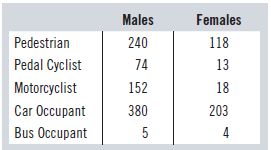
The table below shows the number of injuries in Canada from some forms of transport accidents by gender, in 2011:a) If possible, calculate the percentage of male injuries from transport accidents that are pedestrians. If this is not possible, state why not.b) If possible, calculate the percentage
Which countries are associated with the highest gambling rates? The table below shows gambling losses per person in selected nations in 2013 according to The Economist. Make a graphical comparison among these countries to show how they compare. Give the reason for your choice of graph.
The table below gives the 2015 unemployment rate according to stats.oecd.org for selected countries. Create a graphical representation of these data that facilitates comparison among the countries, and state your reason for your choice of graph compared with another type of graph.Country
The government net financial liabilities as a percentage of GDP is given in the table below for selected countries in 2015 according to stats.oecd.org. Present these data in a graph that allows you to compare the results among the countries. Give your reason for choosing this type of graph compared
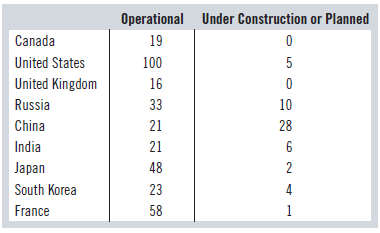
The number of nuclear reactors that were operational in selected countries in 2014 is given in the table below, together with the number of additional nuclear reactors under construction or planned as of the same date.a) Present these data on a graph that allows you to compare the results among the
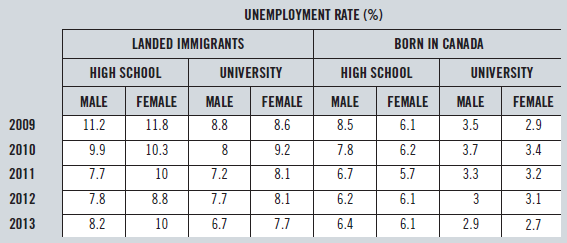
Most people have heard of the unemployment rate, but not so many know where it comes from. Does the rate simply represent the number of people claiming Employment Insurance (EI)? It turns out that that would be an underestimation of the number of people unemployed, since many people are unemployed
You are part of a marketing team that needs to research the potential of a new smartphone. Your team decides to email an interactive survey to a random sample of consumers. Write a short questionnaire that will generate the information you need about the new smartphone. Select a sample of 200 using
Harris Interactive conducts surveys online with panels of people who have volunteered to participate. One of these is the “Body Mass Index” panel consisting of people classified into four groups according to their Body Mass Index, BMI:15,000 underweight adults: BMI < 18.538,000 normal weight
The Canadian Census collects demographic data for specific groups such as lone-parent families, seniors, and those from specific language groups via what is commonly referred to as the “Short Form.” The Short Form questionnaire is issued to each household in Canada, and all Canadian residents
An opinion poll needs to assess the popularity of the Royal Family and is choosing among three questions:Question 1: Do you think the Canadian Head of State should be a member of the Royal Family or elected?Question 2: Do you think the Canadian Head of State should be a member of the Royal Family
Here are more proposed questions for the survey in exercise 13.Question 3: Many people in Japan have optical fibre connected to their homes. Should it be made available to you?Question 4: Since HDTV movies can be watched without downloading them, would you pay $50 a month for an HDTV download
Some people have been complaining that the children’s playground at a municipal park is too small and is in need of repair. Managers of the park decide to survey city residents to see if they believe the playground should be rebuilt. Park managers hand out questionnaires to parents who bring
Fisheries and Oceans Canada operates a laboratory in Sault Ste. Marie, Ontario, to study the abundance of species of fish that have invaded the Great Lakes from other ecosystems. Researchers have found 145 such “exotic” species and wish to get more details on each species present. Suppose they
A cable TV company is considering offering optical fibre to residences to improve the speed of its HDTV download service. Before launching the new service, however, the company wants to find out whether customers would pay the $50 per month that the company wants to charge. An intern has prepared
Consumers Union asked all subscribers whether they had used alternative medical treatments and, if so, whether they had benefited from them. For almost all the treatments, approximately 20% of those responding reported cures or substantial improvement in their condition.For the following reports
To estimate the impact of new technologies on fuel efficiency for motor vehicles, a consulting company requests the opinions of established researchers in the automobile industry, the clean-tech industry, government research labs, and universities.For the following reports about statistical
At its website (www.gallup.com), the Gallup Poll publishes results of a new survey each day. Scroll down to the end, and you’ll find a statement that includes an explanation such as this:Results are based on telephone interviews conducted April 1-30, 2017, with a random sample of 30,401 adults,
The Ontario Ministry of Natural Resources plans to study the fishing industry around Port Dover on Lake Erie. To do that, researchers decide to randomly select five fishing boats at the end of a randomly chosen fishing day and to count the numbers and types of all the fish on those boats.a) What
Here are more proposed survey questions for the survey mentioned in Exercise 13:Question 3: Do you find that the slow speed of dial-up internet access reduces your enjoyment of web services?Question 4: Given the growing importance of high-speed internet access for your children’s education, would
An intern for the consumer advocacy group in Exercise 3 has decided to make the survey process simpler by calling 150 of the members who attended the symposium on “Food Safety in the 21st Century” recently held in Toronto. The intern has the phone numbers of each attendee, so it will be easy to
The airline company from Exercise 4, which is interested in the opinions of its frequent f lyer customers about its proposed new routes, has decided that different types of customers might have different opinions. Of their customers, 50% are silver level, 30% are blue, and 20% are red. The
The consumer advocacy group from Exercise 3 that was interested in gauging perceptions about food safety among professionals in the food industry has decided to use a different method to generate a sample. Instead of randomly selecting members from a shuff led list, a representative listed the
GfK Roper Consulting conducts a global consumer survey to help multinational companies understand different consumer attitudes throughout the world. In India, the researchers interviewed 1000 people aged 13 to 65 (www.gfkamerica.com). Their sample is designed so that they attract 500 males and 500
A consumer advocacy group is interested in gauging perceptions about food safety among professionals in the food industry. Specifically, the analysts in the advocacy group wish to determine the percentage of professional food preparers in Canada who believe food safety has improved. The analysts
A Canadian immigrant, Anjali Gupta, and her Canadian-born friend, Bob Fisher, are celebrating at their high school graduation ceremony. They’ve both worked hard, achieved great grades, and been accepted into the Sauder School of Business at the University of British Columbia. Then Anjali draws
Like all credit and charge card companies, this company makes money on each of its cardholders’ transactions. Thus, its profitability is directly linked to card usage. To increase customer spending on its cards, the company sends many different offers to its cardholders, and market researchers
Canadians have been playing hockey since the 19th century. The National Hockey League (NHL) was founded in Montreal in 1917, with the Ottawa Senators as one of its founding members. Every fall, as the baseball season climaxes at the World Series, Canadians eagerly anticipate the start of hockey
For the data given in Mini Case Study: “Canadian Immigrants,”a) Identify the Five W’s and also How.b) Identify which data (if any) arei) Quantitative/categoricalii) Cross-sectional/time seriesiii) Primary/secondary
Attendance at the third World Series game, recording the age of each fan.Indicate whether the data are a time series or a cross-section.
Number of cars sold by each salesperson in a dealership in September.Indicate whether the data are a time series or a cross-section.
Data collected on investments in Broadway shows: number of investors, total invested (in $), name of the show, profit/loss (in $) after one year.Show how you would lay out the data. Indicate the headings of columns and what would be found in each row.
Data collected for financial planning: weekly sales (in $), week (week number of the year), sales predicted by last year’s plan (in $), difference between predicted sales and realized sales (in $).Show how you would lay out the data. Indicate the headings of columns and what would be found in
Data collected to determine performance-based bonuses: employee ID, amount of average contract closed (in $), supervisor’s rating (1–10), years with the company.Show how you would lay out the data. Indicate the headings of columns and what would be found in each row.
For a study of mortgage loan performance: amount of the loan (in $), the name of the borrower.Show how you would lay out the data. Indicate the headings of columns and what would be found in each row.
A study on the potential for developing theme parks in various locations throughout Europe in 2017 collects the following information: the country where the proposed site is located, the estimated cost to acquire the site (in euros), the size of population within a one-hour drive of the site, the
An online survey of students in a large MBA Statistics class in Toronto asked them to report their total personal investment in the stock market ($), the total number of different stocks currently held, the total invested in mutual funds ($), and the name of each mutual fund in which they have
In order to provide information for the tourism industry, Statistics Canada collects data on overnight visitors to Canada according to the visitor’s country of origin. Data is collected every year and includes the number of nights stayed in Canada and money spent while here.Identify the Five
Statistics Canada collects data on the value (in $) and volume (in m3) of crude oil, natural gas, and natural gas byproducts produced in Canada each year.Identify the Five W’s, name the variables, specify for each variable whether its use indicates it should be treated as categorical or
In order to investigate social trends, Statistics Canada collects data on family type (e.g., married-couple families, common-law-couple families, single-parent families) in the census every five years.Identify the Five W’s, name the variables, specify for each variable whether its use indicates
In order to project the future of the mobile phone business, market analysts collect data on sales of mobile phones by major manufacturer in each country for each quarter of each year.Identify the Five W’s, name the variables, specify for each variable whether its use indicates it should be
The Canadian Transportation Agency (CTA) monitors airlines for adherence to safety regulations and customer service. For each f light, the carrier must report the type of aircraft, number of passengers, whether the f light departed and arrived on schedule, and any mechanical problems.Identify the
The Gallup Poll conducted a representative telephone survey of 1180 Canadian voters. Among the reported results were the voter’s region (East, West, Prairie, etc.), age, political party affiliation, whether the respondent owned any shares of stock, and the voter’s attitude (on a scale of 1 to
As research for an ecology class, university students in Alberta collect data on streams each year to study the impact of pollution on the environment. They record a number of biological, chemical, and physical variables, including the stream name, the substrate of the stream (limestone, shale, or
A survey of autos parked in executive and staff lots at a large company recorded the make, country of origin, type of vehicle (car, van, SUV, etc.), and age.Identify the Five W’s, name the variables, specify for each variable whether its use indicates it should be treated as categorical or
A Canadian startup company is building a database of customers and sales information. For each customer, it records name, ID number, region of the country (1 = West, 2 = Prairies, 3 = North, 4 = Ontario, 5 = Quebec, 6 = Atlantic), date of last purchase, amount of purchase, and item
An internationally recognized MBA program in London intends to track the GPA of its MBA students and compares MBA performance with standardized test scores over the past five years.Identify the Five W’s, name the variables, specify for each variable whether its use indicates it should be treated
A listing posted by the Subway restaurant chain gives, for each of the sandwiches it sells, the type of meat in the sandwich, number of calories, and serving size in grams. The data might be used to assess the nutritional value of the different sandwiches.Identify the Five W’s, name the
The company in Exercise 11 is also interested in the impact of national indicators on its sales. It decides to obtain measurements for the unemployment rate (%) and inf lation rate (%) on a quarterly basis to compare with its quarterly sales ($ million) over the same time period.Identify the Five
A food retailer that specializes in selling organic food has decided to open a new store. To help determine the best location for the new store, researchers decide to examine data from existing stores, including weekly sales ($), town population (thousands), median age of town, median income of
A major Canadian company is interested in seeing how various promotional activities are related to domestic sales. Analysts decide to measure the money spent on different forms of advertising ($ thousand) and sales ($ million) on a monthly basis for the past three years.Identify the Five W’s,
Showing 2000 - 2100
of 4119
First
14
15
16
17
18
19
20
21
22
23
24
25
26
27
28
Last
Step by Step Answers