New Semester
Started
Get
50% OFF
Study Help!
--h --m --s
Claim Now
Question Answers
Textbooks
Find textbooks, questions and answers
Oops, something went wrong!
Change your search query and then try again
S
Books
FREE
Study Help
Expert Questions
Accounting
General Management
Mathematics
Finance
Organizational Behaviour
Law
Physics
Operating System
Management Leadership
Sociology
Programming
Marketing
Database
Computer Network
Economics
Textbooks Solutions
Accounting
Managerial Accounting
Management Leadership
Cost Accounting
Statistics
Business Law
Corporate Finance
Finance
Economics
Auditing
Tutors
Online Tutors
Find a Tutor
Hire a Tutor
Become a Tutor
AI Tutor
AI Study Planner
NEW
Sell Books
Search
Search
Sign In
Register
study help
mathematics
calculus with applications
Calculus For Business, Economics And The Social And Life Sciences 11th Brief Edition Laurence Hoffmann, Gerald Bradley, David Sobecki, Michael Price - Solutions
It is projected that t months from now, the population of a certain town will be P(t) = 3t + 5t3/2 + 6,000. At what percentage rate will the population be changing with respect to time 4 months from now?
In Exercises 35 through 40, find the equation of the line that is tangent to the graph of the given function at the point (c, f (c)) for the specified value of x = c.f(x) = x(√x − 1); x = 4
The output at a certain plant is Q = 0.08x2 + 0.12xy + 0.03y2 units per day, where x is the number of hours of skilled labor used and y is the number of hours of unskilled labor used. Currently, 80 hours of skilled labor and 200 hours of unskilled labor are used each day. Use calculus to estimate
Let f(x) = x(1 − 2x).a. Find the average rate of change of f(x) with respect to x as x changes from x = 0 to.b. Use calculus to find the instantaneous rate of change of f(x) at x = 0, and compare with the average rate found in part (a).
In Exercises 37 and 38, use implicit differentiation to find the second derivative d2y/dx2.xy + y2 = 1
A certain cell has the shape of a sphere. The formulas S = 4πr2 and and V = 4/3πr3 are used to compute the surface area and volume of the cell, respectively. Estimate the effect on S and V produced by a 1% increase in the radius r.
In Exercises 25 through 32, find the rate of change dy/dx where x = x0.y = 3; x0 = 2
After x weeks, the number of people using a new rapid transit system was approximately N(x) = 6x3 + 500x + 8,000.a. At what rate was the use of the system changing with respect to time after 8 weeks?b. By how much did the use of the system change during the eighth week?
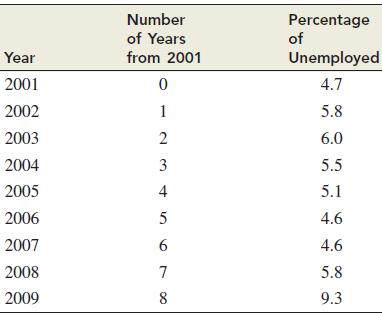
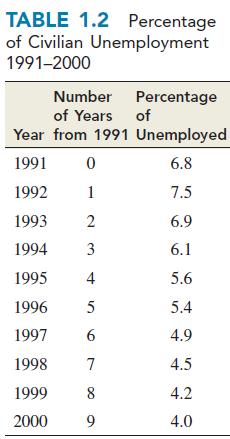
In the solution to Example 1.3.8, we noted that the line that best fits the unemployment data in the example in the sense of least-squares approximation has the equation y = −0.389x + 7.338. The data in the example stop at the year 2000. The accompanying table gives the unemployment data for the
The output at a certain factory is Q(L) = 600L2/3 units, where L is the size of the labor force. The manufacturer wishes to increase output by 1%. Use calculus to estimate the percentage increase in labor that will be required.
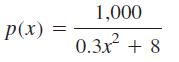
The manager of a company that produces graphing calculators determines that when x thousand calculators are produced, they will all be sold when the price isdollars per calculator.a. At what rate is demand p(x) changing with respect to the level of production x when 3,000 (x = 3) calculators are
In Exercises 47 through 50, find the relative rate of change of f (x) with respect to x for the prescribed value x = c.f(x) = 2x3 − 5x2 + 4; c = 1
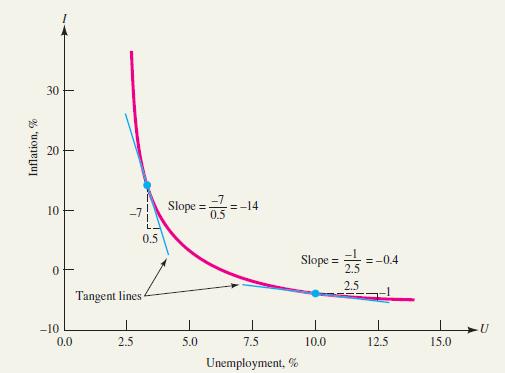
In economics, the inflation graph in Figure 2.2 is called the Phillips curve, after A. W. Phillips, a New Zealander associated with the London School of Economics. Until Phillips published his ideas in the 1950s, many economists believed that unemployment and inflation were linearly related. Read
In Exercises 42 through 47, find the second derivative of the given function. In each case, use the appropriate notation for the second derivative and simplify your answer. y = (x3 + 2x − 1)(3x + 5)
In Exercises 47 through 52, find all values of x = c so that the tangent line to the graph of f(x) at (c, f (c)) will be horizontal.f(x) = (x2 + x)2
A tiny spherical balloon is inserted into a clogged artery and is inflated at the rate of 0.002π mm3/min. How fast is the radius of the balloon growing when the radius is R = 0.005 mm?
In Exercises 47 through 50, find the relative rate of change of f (x) with respect to x for the prescribed value x = c.f(x) = x + 1/x; c = 1
In Exercises 47 through 52, find all values of x = c so that the tangent line to the graph of f(x) at (c, f (c)) will be horizontal.f(x) = x3(2x2 + x − 3)2
The demand for a particular commodity is given by D(x) = −35x + 200; that is, x units will be sold (demanded) at a price of p = D(x) dollars per unit.a. Consumer expenditure E(x) is the total amount of money consumers pay to buy x units. Express consumer expenditure E as a function of x.b. Find
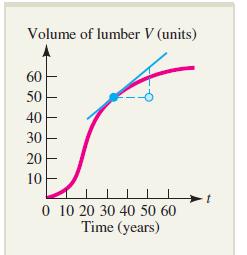
The accompanying graph shows how the volume of lumber V in a tree varies with time t (the age of the tree). Use the graph to estimate the rate at which V is changing with respect to time when t = 30 years. What seems to be happening to the rate of change of V as t increases without bound (that is,
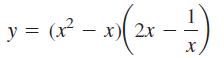
In Exercises 42 through 47, find the second derivative of the given function. In each case, use the appropriate notation for the second derivative and simplify your answer. (Don’t forget to simplify the first derivative as much as possible before computing the second derivative.) y = (x² − x)
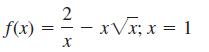
In Exercises 41 through 46, find the rate of change of the given function f (x) with respect to x for the prescribed value x = c. f(x) 2 X xVx; x = 1
In Exercises 39 through 46, find an equation of the line that is tangent to the graph of f for the given value of x. f(x) = x²√2x + 3; x = − 1 -
At a certain factory, it is determined that an output of Q units is to be expected when L worker-hours of labor are employed, wherea. Find the average rate of change of output as the labor employment changes from L = 3,025 worker-hours to 3,100 worker-hours.b. Use calculus to find the instantaneous
The population P of a bacterial colony t days after observation begins is modeled by the cubic function P(t) = 1.035t3 + 103.5t2 + 6,900t + 230,000a. Compute and interpret the derivative P'(t).b. At what rate is the population changing after 1 day? After 10 days?c. What is the initial population of
If f(x) and g(x) are continuous functions that both have an inflection point at x = c, is it true that the sum h(x) = f(x) + g(x) must also have an inflection point at x = c? Either explain why this must always be true or find functions f(x) and g(x) for which it is false.
In Exercises 1 and 2, use your calculator to find the indicated natural logarithms.Find ln 1, ln 2, ln e, ln 5, ln 1/5, and ln e2. What happens if you try to find ln 0 or ln(−2)? Why?
The formula D = 36 m−1.14 is sometimes used to determine the ideal population density D (individuals per square kilometer) for a large animal of mass m kilograms (kg).a. What is the ideal population density for humans, assuming that a typical human weighs about 70 kg?b. The area of the United
Malik, the business manager of a company that produces in-ground outdoor spas, determines that the cost of producing x spas is C thousand dollars, whereC(x) = 0.04x2 + 2.1x + 60a. If Malik decides to increase the level of production from x = 10 to x = 11 spas, what is the corresponding average rate
At a certain factory, output is given by Q = 60K1/3L2/3 units, where K is the capital investment (in thousands of dollars) and L is the size of the labor force, measured in worker-hours. If output is kept constant, at what rate is capital investment changing at a time when K = 8, L = 1,000, and L
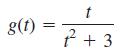
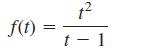
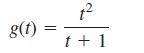
In Exercises 35 through 44, use calculus to sketch the graph of the given function. g(t) = 1 + 3
Assume that total national consumption is given by a function C(x), where x is the total national income. The derivative C'(x) is called the marginal propensity to consume. Then S = x − C represents total national savings, and S'(x) is called marginal propensity to save. Suppose the consumption
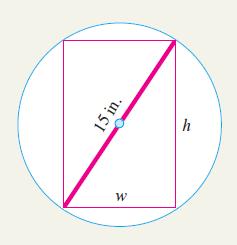
The stiffness of a rectangular beam is proportional to the product of its width w and the cube of its depth h. Find the dimensions of the stiffest beam that can be cut from a wooden log of diameter 15 inches. 15 in. W h
Austin needs $10,000 spending money each year, which he takes from his savings account by making N equal withdrawals. Each withdrawal incurs a transaction fee of $8, and money in his account earns interest at the simple interest rate of 4%.a. The total cost C of managing the account is the
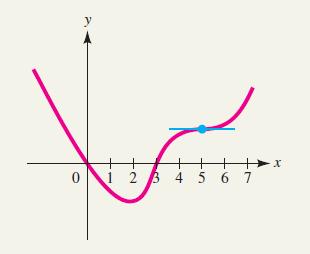
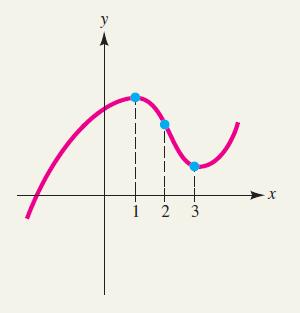
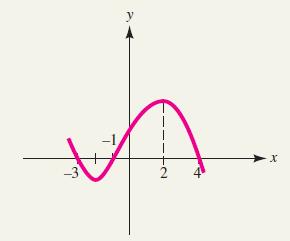
In Exercises 49 through 52, the graph of a function f is given. In each case, sketch a possible graph for f'. y 0 1 2 3 4 4 5 6 7 X
The cost of producing x units of a commodity per week is C(x) = 0.3x3 − 5x2 + 28x + 200a. Find the marginal cost C(x), and sketch its graph along with the graph of C(x) on the same coordinate plane.b. Find all values of x where C"(x) = 0. How are these levels of production related to the graph of
A company estimates that if x thousand dollars are spent on the marketing of a certain product, then Q(x) thousand units of the product will be sold, wherea. Sketch the graph of the sales function Q(x).b. For what marketing expenditure x are sales maximized? What is the maximum sales level? Q(x)
Poiseuille’s law asserts that the speed of blood that is r centimeters from the central axis of an artery of radius R is S(r) = c(R2 − r2), where c is a positive constant. Where is the speed of the blood greatest?
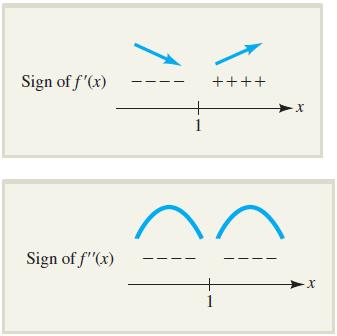
In Exercises 33 through 38, diagrams indicating intervals of increase or decrease and concavity are given. Sketch a possible graph for a function with these characteristics. Sign of f'(x) Sign of f'(x) 1 ++++ 1 X -X
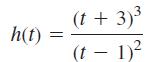
In Exercises 27 through 38, use the second derivative test to find the relative maxima and minima of the given function. h(t) = (t + 3)³ (t-1)²
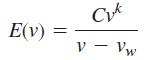
When a fish swims upstream at a speed v against a constant current vw, the energy it expends in traveling to a point upstream is given by a function of the formwhere C > 0 and k > 2 is a number that depends on the species of fish involved.†a. Show that E(v) has exactly one critical number.
In Exercises 35 through 44, use calculus to sketch the graph of the given function.g(x) = 3 − (x + 1)3
Determine where the graph of each of these functions is concave upward and concave downward. Find the x (or t) coordinate of each point of inflection.a. f (x) = 3x5 − 10x4 + 2x − 5b. f (x) = 3x5 + 20x4 − 50x3c.d.
In Exercises 53 and 54, differentiate the given function f(x) by two different methods, first by using the general power rule and then by using the product rule. Show that the two answers are the same.f(x) = (3x + 5)2
In Exercises 55 through 60, find the second derivative of the given function.f(x) = (3x + 1)5
When the price of a certain commodity is p dollars per unit, consumers demand x hundred units of the commodity, whereHow fast is the demand x changing with respect to time when the price is $7 and is decreasing at the rate of 75 cents per months? (That is dp/dt = −0.75. 75x² + 17p² = 5,300
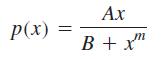
A biological model† measures the production of a certain type of white blood cell (granulocytes) by the functionwhere A and B are positive constants, the exponent m is positive, and x is the number of cells present.a. Find the rate of production p'(x).b. Find p"(x), and determine all values of x
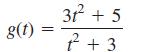
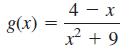
Find intervals of increase and decrease for each of these functions, and determine whether each critical number corresponds to a relative maximum, a relative minimum, or neither.a. f(x) = −x4 + 4x3 + 5b. f(t) = 2t3 − 9t2 + 12t + 5c.d. g(t) t f+9
Estimate the largest percentage error you can allow in the measurement of the radius of a sphere if you want the error in the calculation of its surface area using the formula S = 4πr2 to be no greater than 8%.
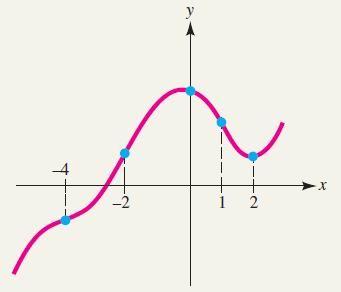
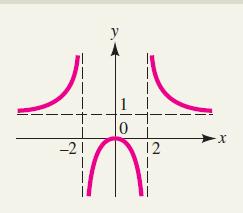
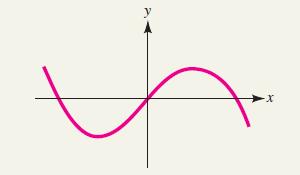
In Exercises 1 through 4, specify the intervals on which the derivative of the given function is positive and those on which it is negative. -2 y 0 X
In Exercises 1 through 16, find the absolute maximum and absolute minimum (if any) of the given function on the specified interval.f(x) = x3 + 3x2 + 1; −3 ≤ x ≤ 2
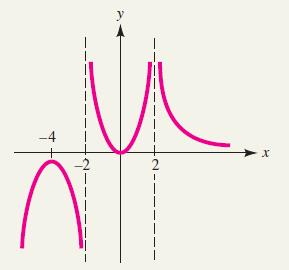
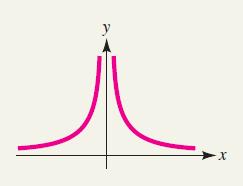
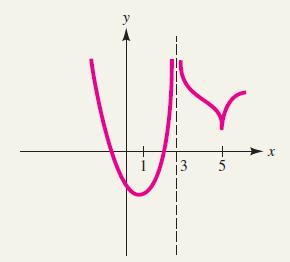
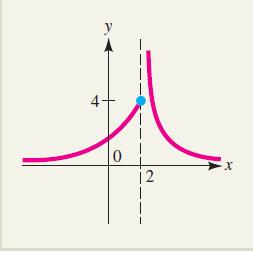
In Exercises 1 through 8, determine the vertical and horizontal asymptotes of the given graph. y 2 X
In Exercises 1 through 10, determine intervals of increase and decrease and intervals of concavity for the given function. Then sketch the graph of the function. Be sure to show all key features such as intercepts, asymptotes, high and low points, points of inflection, cusps, and vertical
In Exercises 1 through 4, determine where the second derivative of the function is positive and where it is negative. پیرا 2 X
In Exercises 1 through 4, specify the intervals on which the derivative of the given function is positive and those on which it is negative. ů 2 I n x
In Exercises 1 through 4, determine where the second derivative of the function is positive and where it is negative. 4 -2 y 12 X
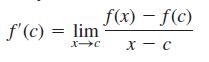
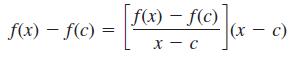
Let f be a function that is differentiable at x = c.a. Explain whyb. Use the result of part (a) together with the fact thatto show thatc. Explain why the result obtained in part (b) shows that f is continuous at x = c. f'(c) lim X-C = f(x) - f(c) X - C
In Exercises 1 through 4, determine where the second derivative of the function is positive and where it is negative. y 1 2 3 X
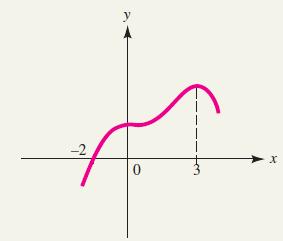
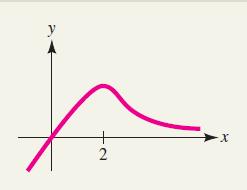
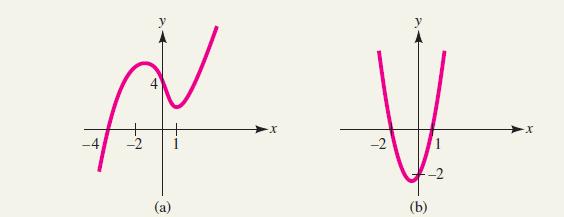
Of the two curves shown here, one is the graph of a function f(x) and the other is the graph of its derivative f'(x). Determine which graph is the derivative, and give reasons for your decision. Ň V -2 -2 -2 (a) (b)
In Exercises 1 through 4, specify the intervals on which the derivative of the given function is positive and those on which it is negative. 2 X
In Exercises 1 through 16, find the absolute maximum and absolute minimum (if any) of the given function on the specified interval.f(x) = x2 + 4x + 5; −3 ≤ x ≤ 1
In Exercises 1 through 8, determine the vertical and horizontal asymptotes of the given graph. -X
In Exercises 1 through 10, determine intervals of increase and decrease and intervals of concavity for the given function. Then sketch the graph of the function. Be sure to show all key features such as intercepts, asymptotes, high and low points, points of inflection, cusps, and vertical
It is estimated that the monthly cost of producing x units of a particular commodity is C(x) = 0.06x + 3x1/2 + 20 hundred dollars. Suppose production is decreasing at the rate of 11 units per month when the monthly production is 2,500 units. At what rate is the cost changing at this level of
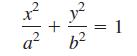
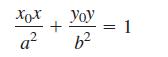
Show that the tangent line to the curveat the point (x0, y0) is + h? || = 1
You measure the radius r of a circle to be 12 cm with an error no greater than 3%. Use calculus to estimate the error incurred by using this approximate value of r in the formula A = πr2 to compute the area of the circle.
An environmental study for a certain community indicates that there will be Q( p) = p2 + 4p + 900 units of a harmful pollutant in the air when the population is p thousand people. If the population is currently 50,000 and is increasing at the rate of 1,500 per year, at what rate is the level of
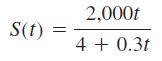
The manager of the Many Facets jewelry store models total sales by the functionwhere t is the time (years) since the year 2010 and S is measured in thousands of dollars.a. At what rate were sales changing in the year 2012?b. What happens to sales in the long run (that is, as t → +∞)?
In Exercises 47 through 50, find the relative rate of change of f (x) with respect to x for the prescribed value x = c.f(x) = x√x + x2; c = 4
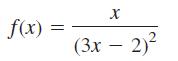
In Exercises 47 through 52, find all values of x = c so that the tangent line to the graph of f(x) at (c, f (c)) will be horizontal. f(x) = X (3x - 2)²
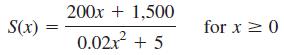
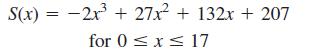
Answer the questions in Exercise 57 for the sales functionData from Exercises 57A company determines that if x thousand dollars are spent on advertising a certain product, then S(x) units of the product will be sold, wherea. Sketch the graph of S(x).b. How many units will be sold if nothing is
In Exercises 1 through 10, determine intervals of increase and decrease and intervals of concavity for the given function. Then sketch the graph of the function. Be sure to show all key features such as intercepts, asymptotes, high and low points, points of inflection, cusps, and vertical tangents.
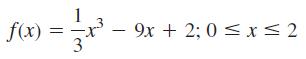
In Exercises 1 through 16, find the absolute maximum and absolute minimum (if any) of the given function on the specified interval. f(x) = = = x³ 3 9x + 2; 0≤x≤2
Find two positive numbers x and y whose sum is 30 and are such that xy2 is as large as possible.
In Exercises 1 through 4, specify the intervals on which the derivative of the given function is positive and those on which it is negative. y 5 X
In Exercises 1 through 8, determine the vertical and horizontal asymptotes of the given graph. -21 0 12
In Exercises 1 through 16, find the absolute maximum and absolute minimum (if any) of the given function on the specified interval.f(x) = x5 − 5x4 + 1; 0 ≤ x ≤ 5
In Exercises 1 through 10, determine intervals of increase and decrease and intervals of concavity for the given function. Then sketch the graph of the function. Be sure to show all key features such as intercepts, asymptotes, high and low points, points of inflection, cusps, and vertical
In Exercises 5 through 12, determine where the graph of the given function is concave upward and concave downward. Find the coordinates of all inflection points.f(x) = x3 + 3x2 + x + 1
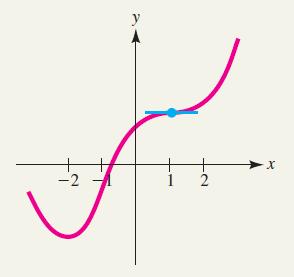
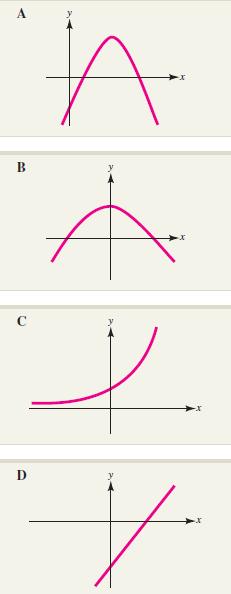
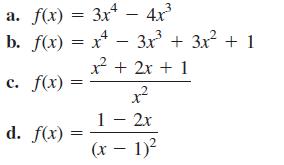
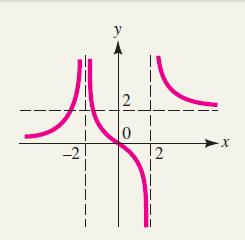
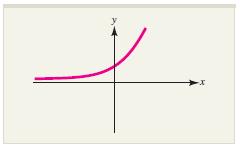
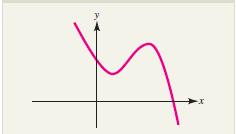
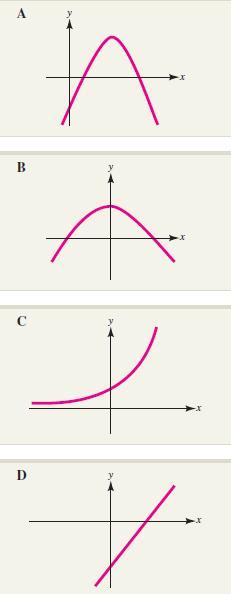
In each of Exercises 5 through 8, match the graph of the derivative of the given function with one of the graphs A, B, C, D shown in the right column. y -X
Sketch the graph of each of the following functions. Be sure to show all key features such as intercepts, asymptotes, high and low points, points of inflection, cusps, and vertical tangents. a. f(x) = 3x b. f(x) = x² c. f(x) d. f(x) - 4x³ 3x² + 3x² + 1 x² + 2x + 1 x² 2 1 - 2x 1)² (x -
In Exercises 1 through 10, determine intervals of increase and decrease and intervals of concavity for the given function. Then sketch the graph of the function. Be sure to show all key features such as intercepts, asymptotes, high and low points, points of inflection, cusps, and vertical
In Exercises 1 through 8, determine the vertical and horizontal asymptotes of the given graph. 2 -X
In each of Exercises 5 through 8, match the graph of the derivative of the given function with one of the graphs A, B, C, D shown in the right column.
In Exercises 1 through 10, determine intervals of increase and decrease and intervals of concavity for the given function. Then sketch the graph of the function. Be sure to show all key features such as intercepts, asymptotes, high and low points, points of inflection, cusps, and vertical tangents.
In Exercises 1 through 16, find the absolute maximum and absolute minimum (if any) of the given function on the specified interval.f(t) = 3t5 − 5t3; −2 ≤ t ≤ 0
In each of the following cases, find the largest and smallest values of the given function on the specified interval.a. f(x) = x3 − 3x2 − 9x + 1 on −2 ≤ x ≤ 4 b. g(t) = −4t3 +9t2 + 12t − 5 on −1 ≤ t ≤ 4 c. h(u) = 8√u − u + 3 on 0 ≤ u ≤ 25
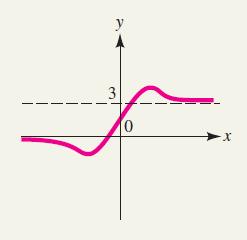
In Exercises 1 through 8, determine the vertical and horizontal asymptotes of the given graph. y 3 0 X
In Exercises 1 through 16, find the absolute maximum and absolute minimum (if any) of the given function on the specified interval.f(x) = 10x6 + 24x5 + 15x4 + 3; −1 ≤ x ≤ 1
There are 320 yards of fencing available to enclose a rectangular field. How should this fencing be used so that the enclosed area is as large as possible?
In each of Exercises 5 through 8, match the graph of the derivative of the given function with one of the graphs A, B, C, D shown in the right column. N.
In Exercises 5 through 12, determine where the graph of the given function is concave upward and concave downward. Find the coordinates of all inflection points.f(x) = x4 − 4x3 + 10x − 9
Sketch the graph of a function f (x) with all these properties:a. f'(x) > 0 for x < 0 and for 0 < x < 2b. f'(x) < 0 for x > 2c. f'(0) = f'(2) = 0d. f"(x) < 0 for x < 0 and for x > 1e. f"(x) > 0 for 0 < x < 1f. f(−1) = f(4) = 0; f(0) = 1, f(1) = 2, f(2) = 3
In Exercises 5 through 12, determine where the graph of the given function is concave upward and concave downward. Find the coordinates of all inflection points.f(x) = x(2x + 1)2
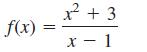
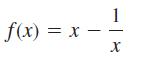
In Exercises 17 through 32, sketch the graph of the given function. f(x) = x T 1 X
In Exercises 1 through 8, determine the vertical and horizontal asymptotes of the given graph. 0 12
In each of Exercises 5 through 8, match the graph of the derivative of the given function with one of the graphs A, B, C, D shown in the right column.
In Exercises 1 through 16, find the absolute maximum and absolute minimum (if any) of the given function on the specified interval.f(x) = (x2 − 4)5; −3 ≤ x ≤ 2
In Exercises 5 through 12, determine where the graph of the given function is concave upward and concave downward. Find the coordinates of all inflection points.f(s) = s(s + 3)2
In Exercises 13 through 16, the derivative f'(x) of a function is given. Use this information to classify each critical number of f(x) as a relative maximum, a relative minimum, or neither.f'(x) = 3√x(3 − x)(x + 1)2
Showing 2900 - 3000
of 8662
First
23
24
25
26
27
28
29
30
31
32
33
34
35
36
37
Last
Step by Step Answers