New Semester
Started
Get
50% OFF
Study Help!
--h --m --s
Claim Now
Question Answers
Textbooks
Find textbooks, questions and answers
Oops, something went wrong!
Change your search query and then try again
S
Books
FREE
Study Help
Expert Questions
Accounting
General Management
Mathematics
Finance
Organizational Behaviour
Law
Physics
Operating System
Management Leadership
Sociology
Programming
Marketing
Database
Computer Network
Economics
Textbooks Solutions
Accounting
Managerial Accounting
Management Leadership
Cost Accounting
Statistics
Business Law
Corporate Finance
Finance
Economics
Auditing
Tutors
Online Tutors
Find a Tutor
Hire a Tutor
Become a Tutor
AI Tutor
AI Study Planner
NEW
Sell Books
Search
Search
Sign In
Register
study help
mathematics
college algebra graphs and models
College Algebra 7th Edition Robert F Blitzer - Solutions
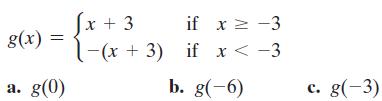
In Exercises 53–58, evaluate each piecewise function at the given values of the independent variable. g(x) a. g(0) = √x + 3 if x = -3 1-(x + 3) if x < -3 b. g(-6) c. g(-3)
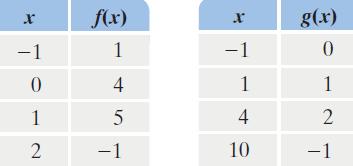
In Exercises 53–58, f and g are defined by the following tables. Use the tables to evaluate each composite function.(g ° f )(-1) X -1 0 1 2 f(x) 1 4 5 -1 X -1 1 4 10 g(x) 0 1 2 -1
In Exercises 51–66, finda. (f ° g)(x)b. (g ° f)(x)c. (f ° g)(2)f(x) = 4x - 3, g(x) = 5x2 - 2
In Exercises 67–80, begin by graphing the square root function, f(x) = √x. Then use transformations of this graph to graph the given function. g(x)=√x + 2
In Exercises 65–70, use the graph of f to find each indicated function value.f(4) -5-4 30 T y y = f(x) 12 2.H HII A V DIDYFIZIID X
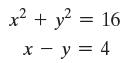
In Exercises 67–70, graph both equations in the same rectangular coordinate system and find all points of intersection. Then show that these ordered pairs satisfy the equations. x² + y² = 16 x - y = 4
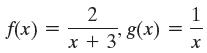
In Exercises 67–74, finda. (f ° g)(x)b. the domain of f ° g. f(x) = 2 x + 3,8(x) 1
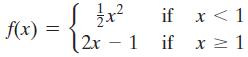
In Exercises 59–70, the domain of each piecewise function is (- ∞, ∞).a. Graph each function.b. Use your graph to determine the function’s range. f(x) x² 2x 1 - if if x < 1 x ≥ 1
In Exercises 59–66,a. Rewrite the given equation in slope-intercept form.b. Give the slope and y-intercept.c. Use the slope and y-intercept to graph the linear function.4y + 28 = 0
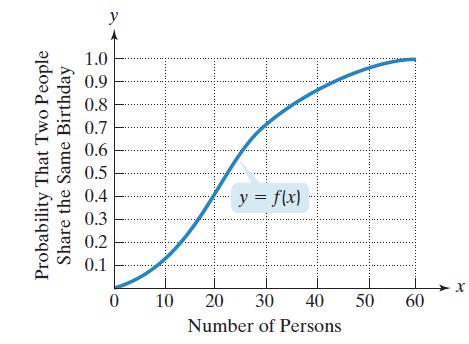
The graph represents the probability of two people in the same room sharing a birthday as a function of the number of people in the room. Call the function f.a. Explain why f has an inverse that is a function.b. Describe in practical terms the meaning of f -1(0.25), f -1(0.5), and f -1(0.7).
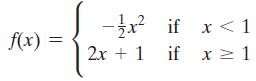
In Exercises 59–70, the domain of each piecewise function is (- ∞, ∞).a. Graph each function.b. Use your graph to determine the function’s range. f(x) = -x² if x
In Exercises 65–70, use the graph of f to find each indicated function value.f(-4) -5-4 30 T y y = f(x) 12 2.H HII A V DIDYFIZIID X
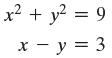
In Exercises 67–70, graph both equations in the same rectangular coordinate system and find all points of intersection. Then show that these ordered pairs satisfy the equations. 6 = z + zx x - y = 3
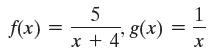
In Exercises 67–74, finda. (f ° g)(x)b. the domain of f ° g. f(x): 5 x + 4' 8(x) 1 X
In Exercises 67–80, begin by graphing the square root function, f(x) = √x. Then use transformations of this graph to graph the given function. g(x) = √x + 1
In Exercises 67–69, begin by graphing the absolute value function, f(x) =|x|. Then use transformations of this graph to graph the given function.g(x) =|x|+ 2 - 3
In Exercises 67–72, use intercepts to graph each equation.6x - 2y - 12 = 0
In Exercises 67–69, begin by graphing the absolute value function, f(x) =|x|. Then use transformations of this graph to graph the given function. r(x) = x + 2|
In Exercises 65–70, use the graph of f to find each indicated function value.f(-3) -5-4 30 T y y = f(x) 12 2.H HII A V DIDYFIZIID X
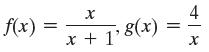
In Exercises 67–74, finda. (f ° g)(x)b. The domain of f ° g. f(x) = X x + 1'8(x) = 4 X
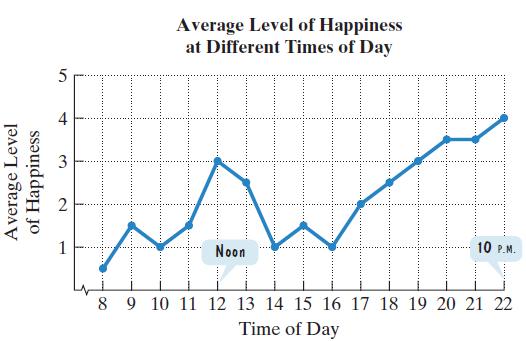
A study of 900 working women in Texas showed that their feelings changed throughout the day. As the graph indicates, the women felt better as time passed, except for a blip (that’s slang for relative maximum) at lunchtime.a. Does the graph have an inverse that is a function? Explain your
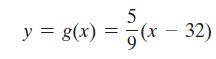
The formula is used to convert from x degrees Celsius to y degrees Fahrenheit. The formulais used to convert from x degrees Fahrenheit to y degrees Celsius. Show that f and g are inverse functions. 9 y = f(x) = 5x + 32
In Exercises 67–80, begin by graphing the square root function, f(x) = √x. Then use transformations of this graph to graph the given function. g(x) = √x + 2
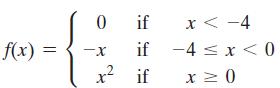
In Exercises 59–70, the domain of each piecewise function is (- ∞, ∞).a. Graph each function.b. Use your graph to determine the function’s range. if if x² if 0 f(x) = -X 42 x < -4 -4 ≤ x < 0 x ≥ 0
In Exercises 67–69, begin by graphing the absolute value function, f(x) =|x|. Then use transformations of this graph to graph the given function.h(x) = -|x - 1|+ 1
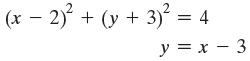
In Exercises 67–70, graph both equations in the same rectangular coordinate system and find all points of intersection. Then show that these ordered pairs satisfy the equations. (x - 2)² + (y + 3)² = 4 y = x - 3
In Exercises 67–80, begin by graphing the square root function, f(x) = √x. Then use transformations of this graph to graph the given function. g(x)=√x + 1
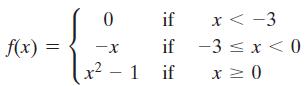
In Exercises 59–70, the domain of each piecewise function is (- ∞, ∞).a. Graph each function.b. Use your graph to determine the function’s range. f(x) = if -X if x² - 1 if 0 x
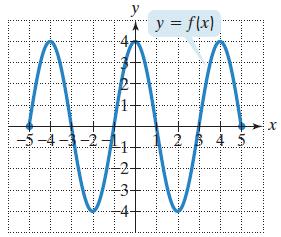
In Exercises 65–70, use the graph of f to find each indicated function value.f(-1) -5-4 30 T y y = f(x) 12 2.H HII A V DIDYFIZIID X
In Exercises 67–72, use intercepts to graph each equation.6x - 9y - 18 = 0
In Exercises 70–72, begin by graphing the standard cubic function, f(x) = x3. Then use transformations of this graph to graph the given function. h(x) = -(x + 1)³
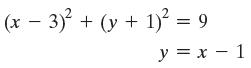
In Exercises 67–70, graph both equations in the same rectangular coordinate system and find all points of intersection. Then show that these ordered pairs satisfy the equations. (x − 3)² + (y + 1)² = 9 y = x - 1
In Exercises 67–80, begin by graphing the square root function, f(x) = √x. Then use transformations of this graph to graph the given function. h(x) = -√x + 2
In Exercises 67–72, use intercepts to graph each equation.2x + 3y + 6 = 0
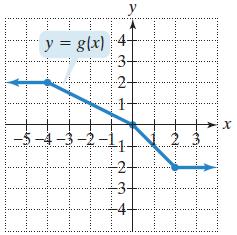
Use the graph of g to solve Exercises 71–76.Find g(-4). H y = g(x) 77 -5-4-3-2-1 # 32 31 TI y -3- بنا DIIIIIIII x
Explain how to determine if two functions are inverses of each other.
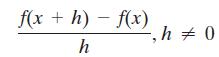
In Exercises 71–92, find and simplify the difference quotient f(x +h)-f(x) h -, h = 0
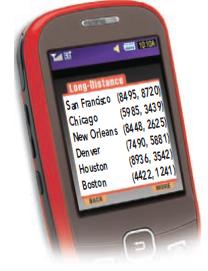
The cellphone screen shows coordinates of six cities from a rectangular coordinate system placed on North America by long-distance telephone companies. Each unit in this system represents √0.1 mile.In Exercises 71–72, use this information to find the distance, to the nearest mile, between each
In Exercises 67–74, finda. (f ° g)(x)b. The domain of f ° g. f(x)=√x, g(x) = x − 2 -
In Exercises 70–72, begin by graphing the standard cubic function, f(x) = x3. Then use transformations of this graph to graph the given function. r(x) = x³ - 1
In Exercises 67–72, use intercepts to graph each equation.8x - 2y + 12 = 0
In Exercises 67–80, begin by graphing the square root function, f(x) = √x. Then use transformations of this graph to graph the given function. h(x) -√x + 1
Use the graph of g to solve Exercises 71–76.Find g(2). H y = g(x) 77 -5-4-3-2-1 # 32 31 TI y -3- بنا DIIIIIIII x
In Exercises 71–92, find and simplify the difference quotient f(x +h)-f(x) h -, h = 0
In Exercises 67–74, finda. (f ° g)(x)b. The domain of f ° g. f(x) = √x, g(x) = x - 3
The cellphone screen shows coordinates of six cities from a rectangular coordinate system placed on North America by long-distance telephone companies. Each unit in this system represents √0.1 mile.In Exercises 71–72, use this information to find the distance, to the nearest mile, between each
In Exercises 67–72, use intercepts to graph each equation.6x - 3y + 15 = 0
In Exercises 73–75, begin by graphing the cube root function, Then use transformations of this graph to graph the given function. f(x) = √x.
What is the horizontal line test and what does it indicate?
In Exercises 71–92, find and simplify the difference quotient f(x +h)-f(x) h -, h = 0
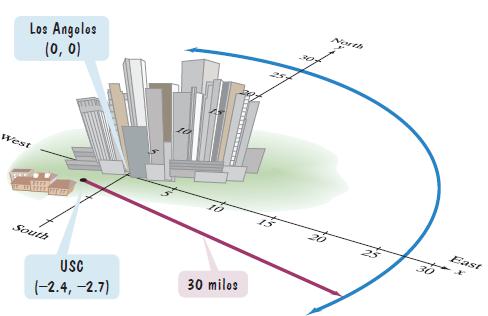
A rectangular coordinate system with coordinates in miles is placed with the origin at the center of Los Angeles. The figure indicates that the University of Southern California is located 2.4 miles west and 2.7 miles south of central Los Angeles. A seismograph on the campus shows that a small
In Exercises 67–80, begin by graphing the square root function, f(x) = √x. Then use transformations of this graph to graph the given function. h(x) = V-x + 2
Use the graph of g to solve Exercises 71–76.Find g(-10). H y = g(x) 77 -5-4-3-2-1 # 32 31 TI y -3- بنا DIIIIIIII x
In Exercises 67–74, finda. (f ° g)(x)b. The domain of f ° g. f(x) = x² + 1, g(x) = √2 - x
In Exercises 73–75, begin by graphing the cube root function, Then use transformations of this graph to graph the given function. f(x) = √x.
In Exercises 71–92, find and simplify the difference quotient f(x +h)-f(x) h -, h = 0
In Exercises 71–92, find and simplify the difference quotient f(x +h)-f(x) h -, h = 0
In Exercises 67–80, begin by graphing the square root function, f(x) = √x. Then use transformations of this graph to graph the given function. h(x) = V-x + 1
Use the graph of g to solve Exercises 71–76.Find g(10). H y = g(x) 77 -5-4-3-2-1 # 32 31 TI y -3- بنا DIIIIIIII x
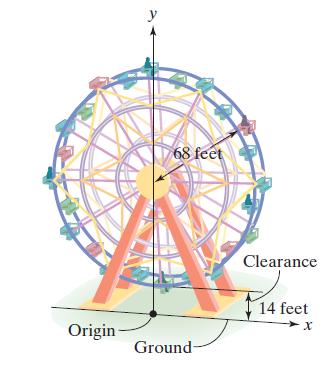
The Ferris wheel in the figure has a radius of 68 feet. The clearance between the wheel and the ground is 14 feet. The rectangular coordinate system shown has its origin on the ground directly below the center of the wheel. Use the coordinate system to write the equation of the circular wheel.
In Exercises 73–76, find the slope of the line passing through each pair of points or state that the slope is undefined. Assume that all variables represent positive real numbers. Then indicate whether the line through the points rises, falls, is horizontal, or is vertical.(0, a) and (b, 0)
Use the graph of g to solve Exercises 71–76.For what value of x is g(x) = 1? H y = g(x) 77 -5-4-3-2-1 # 32 31 TI y -3- بنا DIIIIIIII x
Use the graph of g to solve Exercises 71–76.For what value of x is g(x) = -1? H y = g(x) 77 -5-4-3-2-1 # 32 31 TI y -3- بنا DIIIIIIII x
In Exercises 71–92, find and simplify the difference quotient f(x +h)-f(x) h -, h = 0
In Exercises 75–82, express the given function h as a composition of two functions f and g so that h(x) = (f ° g)(x). h(x) = (3x - 1)*
Describe how to use the graph of a one-to-one function to draw the graph of its inverse function.
In Exercises 76–81, find the domain of each function. f(x) = x² + 6x - 3
In Exercises 67–80, begin by graphing the square root function, f(x) = √x. Then use transformations of this graph to graph the given function. g(x) = 2√x + 1
How can a graphing utility be used to visually determine if two functions are inverses of each other?
In Exercises 73–76, find the slope of the line passing through each pair of points or state that the slope is undefined. Assume that all variables represent positive real numbers. Then indicate whether the line through the points rises, falls, is horizontal, or is vertical.(-a, 0) and (0, -b)
In Exercises 76–83, use a graphing utility to graph the function. Use the graph to determine whether the function has an inverse that is a function (that is, whether the function is one-to-one). f(x) X 4
In Exercises 73–76, find the slope of the line passing through each pair of points or state that the slope is undefined. Assume that all variables represent positive real numbers. Then indicate whether the line through the points rises, falls, is horizontal, or is vertical.(a - b, c) and (a, a +
In Exercises 73–76, find the slope of the line passing through each pair of points or state that the slope is undefined. Assume that all variables represent positive real numbers. Then indicate whether the line through the points rises, falls, is horizontal, or is vertical.(a, b) and (a, b + c)
In Exercises 76–83, use a graphing utility to graph the function. Use the graph to determine whether the function has an inverse that is a function (that is, whether the function is one-to-one).f(x) = x2 - 1
In your own words, describe how to find the distance between two points in the rectangular coordinate system.
In Exercises 75–82, express the given function h as a composition of two functions f and g so that h(x) = (f ° g)(x). h(x) = (2x - 5)³
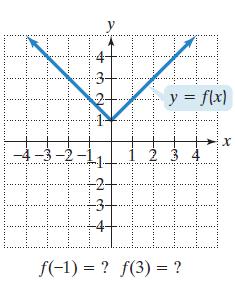
In Exercises 77–92, use the graph to determinea. The function’s domain;b. The function’s range;c. The x-intercepts, if any;d. The y-intercept, if any;e. The missing function values, indicated by question marks, below each graph. -4-3-2- H H y A y = f(x) 2 3 4 CCCCB f(-1) = ? f(3) = ? X
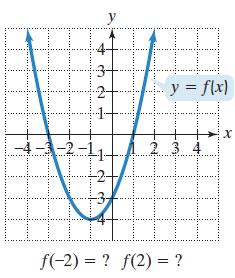
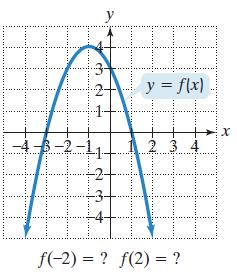
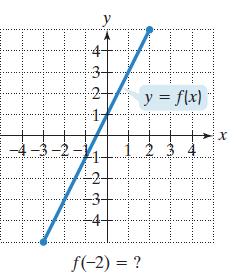
In Exercises 77–92, use the graph to determinea. The function’s domain;b. The function’s range;c. The x-intercepts, if any;d. The y-intercept, if any;e. The missing function values, indicated by question marks, below each graph. प्रै का y y = flx) 2 3 4 H # f(-2) = ? f(2) = ? X
In Exercises 77–92, use the graph to determinea. The function’s domain;b. The function’s range;c. The x-intercepts, if any;d. The y-intercept, if any;e. The missing function values, indicated by question marks, below each graph. -4-3-2 y 8:08 y = f(x) 23 H +4+ f(-2) = ? f(2)= ? X
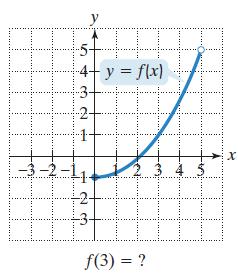
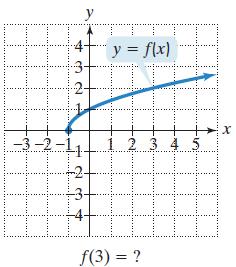
In Exercises 77–92, use the graph to determinea. The function’s domain;b. The function’s range;c. The x-intercepts, if any;d. The y-intercept, if any;e. The missing function values, indicated by question marks, below each graph. II -4+ y = f(x) -3- 27 2- -3-2- y 57 -2- 3³1 f(3) = ? X
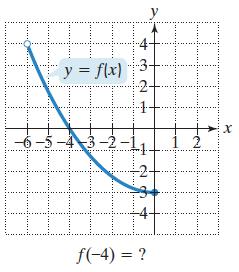
In Exercises 77–92, use the graph to determinea. The function’s domain;b. The function’s range;c. The x-intercepts, if any;d. The y-intercept, if any;e. The missing function values, indicated by question marks, below each graph. y = f(x) C 32 1 -6-5-4-3-2-1 1 2 3+ [IIIII+HID f(-4) = ? X
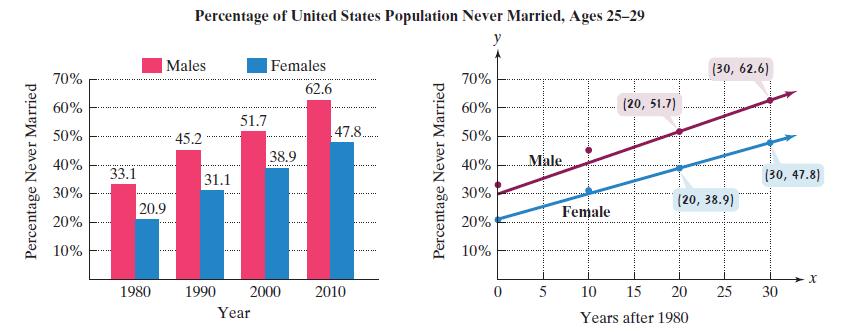
Americans are getting married later in life, or not getting married at all. In 2010, more than half of Americans ages 25 through 29 were unmarried. The bar graph shows the percentage of never-married men and women in this age group for four selected years. The data are displayed as two sets of four
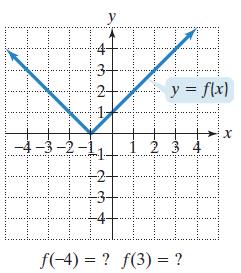
In Exercises 77–92, use the graph to determinea. The function’s domain;b. The function’s range;c. The x-intercepts, if any;d. The y-intercept, if any;e. The missing function values, indicated by question marks, below each graph. -4-3-2- 432 개 y = f(x) 1 2 3 CO f(-4) = ? f(3) = ? X
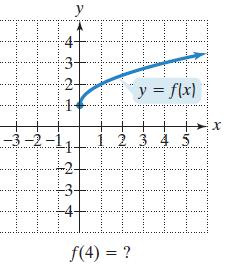
In Exercises 77–92, use the graph to determinea. The function’s domain;b. The function’s range;c. The x-intercepts, if any;d. The y-intercept, if any;e. The missing function values, indicated by question marks, below each graph. -3-2 H y D y = f(x) 2345 -3- Inªto ƒ(4) = ? HO X
In Exercises 77–78, give the slope and y-intercept of each line whose equation is given. Assume that B ≠ 0.Ax + By = C
In Exercises 87–88, finda. (f ° g)(x);b. The domain of (f ° g). f(x) = √x -1, g(x) = x + 3
In Exercises 83–85, use a graphing utility to graph each circle whose equation is given. Use a square setting for the viewing window. (y + 1) = 36 - (x − 3) -
Americans are getting married later in life, or not getting married at all. In 2010, more than half of Americans ages 25 through 29 were unmarried. The bar graph shows the percentage of never-married men and women in this age group for four selected years. The data are displayed as two sets of four
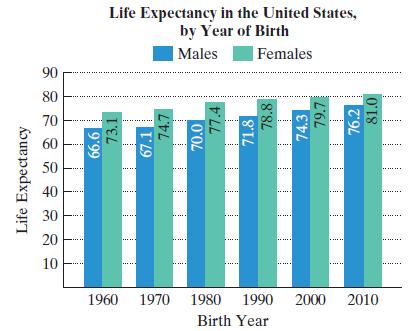
The bar graph gives the life expectancy for American men and women born in six selected years. In Exercises 89–90, you will use the data to obtain models for life expectancy and make predictions about how long American men and women will live in the future.Use the data for males shown in the bar
In Exercises 77–92, use the graph to determinea. The function’s domain;b. The function’s range;c. The x-intercepts, if any;d. The y-intercept, if any;e. The missing function values, indicated by question marks, below each graph. -4-3-2 14 H f(-2) = ? y = f(x) HO X
In your own words, describe how to find the midpoint of a line segment if its endpoints are known.
In Exercises 77–92, use the graph to determinea. The function’s domain;b. The function’s range;c. The x-intercepts, if any;d. The y-intercept, if any;e. The missing function values, indicated by question marks, below each graph. D -3-2 # y y = f(x) 23 CIOCCIO f(3) = ? X
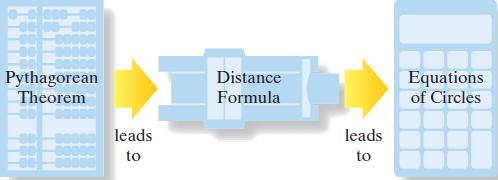
In Exercises 86–89, determine whether each statement makes sense or does not make sense, and explain your reasoning.I’ve noticed that in mathematics, one topic often leads logically to a new topic: Pythagorean Theorem leads to Distance Formula leads to Equations of Circles
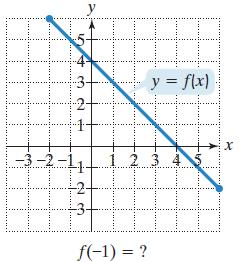
In Exercises 77–92, use the graph to determinea. The function’s domain;b. The function’s range;c. The x-intercepts, if any;d. The y-intercept, if any;e. The missing function values, indicated by question marks, below each graph. -3-2 32 y = f(x) TH 2 3 CIPTI f(-1) = ? x
In Exercises 81–94, begin by graphing the absolute value function, f(x) = |x|. Then use transformations of this graph to graph the given function. h(x) = -x + 3|
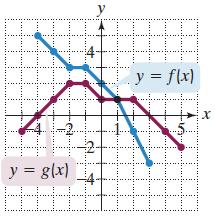
Use the graphs of f and g to solve Exercises 83–90. Find the domain of f/g. y = g(x) HH y .y = f(x) # X
In Exercises 71–92, find and simplify the difference quotient f(x +h)-f(x) h -, h = 0
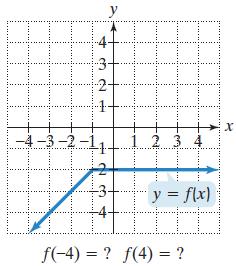
In Exercises 77–92, use the graph to determinea. The function’s domain;b. The function’s range;c. The x-intercepts, if any;d. The y-intercept, if any;e. The missing function values, indicated by question marks, below each graph. 10 -4-3-2 432+ y 2 3 4 F y = f(x) DIXHITID f(-4)= ? f(4) = ? X
The bar graph gives the life expectancy for American men and women born in six selected years. In Exercises 89–90, you will use the data to obtain models for life expectancy and make predictions about how long American men and women will live in the future.Use the data for females shown in the
Use the graphs of f and g to solve Exercises 83–90. Graph f + g. y = g(x) HH y .y = f(x) # X
Showing 7900 - 8000
of 13634
First
73
74
75
76
77
78
79
80
81
82
83
84
85
86
87
Last
Step by Step Answers