New Semester
Started
Get
50% OFF
Study Help!
--h --m --s
Claim Now
Question Answers
Textbooks
Find textbooks, questions and answers
Oops, something went wrong!
Change your search query and then try again
S
Books
FREE
Study Help
Expert Questions
Accounting
General Management
Mathematics
Finance
Organizational Behaviour
Law
Physics
Operating System
Management Leadership
Sociology
Programming
Marketing
Database
Computer Network
Economics
Textbooks Solutions
Accounting
Managerial Accounting
Management Leadership
Cost Accounting
Statistics
Business Law
Corporate Finance
Finance
Economics
Auditing
Tutors
Online Tutors
Find a Tutor
Hire a Tutor
Become a Tutor
AI Tutor
AI Study Planner
NEW
Sell Books
Search
Search
Sign In
Register
study help
mathematics
college algebra graphs and models
College Algebra 7th Edition Robert F Blitzer - Solutions
In Exercises 41–64,a. Use the Leading Coefficient Test to determine the graph’s end behavior.b. Find the x-intercepts. State whether the graph crosses the x-axis, or touches the x-axis and turns around, at each intercept.c. Find the y-intercept.d. Determine whether the graph has y-axis
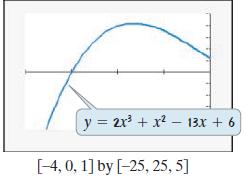
In Exercises 47–50, use the graph or the table to determine asolution of each equation. Use synthetic division to verify that this number is a solution of the equation. Then solve the polynomial equation.2x3 + x2 - 13x + 6 = 0 y = 2x³ + x² 13x + 6 [-4, 0, 1] by [-25, 25, 5]
In Exercises 39–52, find all zeros of the polynomial function or solve the given polynomial equation. Use the Rational Zero Theorem, Descartes’s Rule of Signs, and possibly the graph of the polynomial function shown by a graphing utility as an aid in obtaining the first zero or the first root.
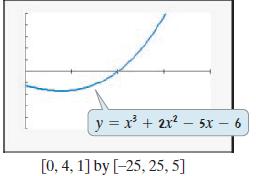
In Exercises 47–50, use the graph or the table to determine a solution of each equation. Use synthetic division to verify that this number is a solution of the equation. Then solve the polynomial equation.x3 + 2x2 - 5x - 6 = 0 y = x³ + 2x²5x - 6 [0, 4, 1] by [-25, 25, 5]
In Exercises 45–56, use transformations of f(x) = 1/x or f(x) = 1/x2 to graph each rational function. h(x) || 1 - +1 X
Solve each rational inequality in Exercises 43–60 and graph the solution set on a real number line. Express each solution set in interval notation. -x + 2 x - 4 ≥ 0
In Exercises 41–64,a. Use the Leading Coefficient Test to determine the graph’s end behavior.b. Find the x-intercepts. State whether the graph crosses the x-axis, or touches the x-axis and turns around, at each intercept.c. Find the y-intercept.d. Determine whether the graph has y-axis
In Exercises 49–52, write an equation in standard form of the parabola that has the same shape as the graph of f(x) = 2x2, but with the given point as the vertex.(5, 3)
In Exercises 47–48, find an nth-degree polynomial function with real coefficients satisfying the given conditions. If you are using a graphing utility, graph the function and verify the real zeros and the given function value.n = 4; i is a zero; -3 is a zero of multiplicity 2; f(-1) = 16
In Exercises 47–48, find an nth-degree polynomial function with real coefficients satisfying the given conditions. If you are using a graphing utility, graph the function and verify the real zeros and the given function value.n = 3; 2 and 2 - 3i are zeros; f(1) = -10
In Exercises 45–48, give the domain and the range of each quadratic function whose graph is described.Minimum = 18 at x = -6
We have seen that the daily number of phone calls between two cities varies jointly as their populations and inversely as the square of the distance between them. This model, used by telecommunication companies to estimate the line capacities needed among various cities, is called the gravity
In Exercises 49–52, write an equation in standard form of the parabola that has the same shape as the graph of f(x) = 2x2, but with the given point as the vertex.(-8, -6)
Solve each rational inequality in Exercises 43–60 and graph the solution set on a real number line. Express each solution set in interval notation. x + 4 X V 0
In Exercises 41–64,a. Use the Leading Coefficient Test to determine the graph’s end behavior.b. Find the x-intercepts. State whether the graph crosses the x-axis, or touches the x-axis and turns around, at each intercept.c. Find the y-intercept.d. Determine whether the graph has y-axis
In Exercises 49–52, determine whether each statement makes sense or does not make sense, and explain your reasoning.Using the language of variation, I can now state the formula for the area of a trapezoid, A = 1/2 h(b1 + b2), as, “A trapezoid’s area varies jointly with its height and the sum
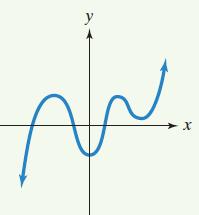
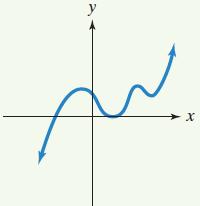
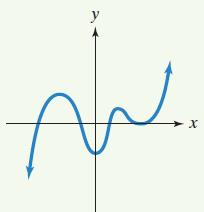
In Exercises 51–54, graphs of fifth-degree polynomial functions are shown. In each case, specify the number of real zeros and the number of imaginary zeros. Indicate whether there are any real zeros with multiplicity other than 1. У X
In Exercises 39–52, find all zeros of the polynomial function or solve the given polynomial equation. Use the Rational Zero Theorem, Descartes’s Rule of Signs, and possibly the graph of the polynomial function shown by a graphing utility as an aid in obtaining the first zero or the first root.
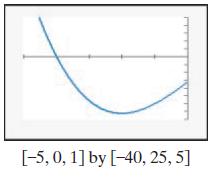
Exercises 53–60 show incomplete graphs of given polynomial functions.a. Find all the zeros of each function.b. Without using a graphing utility, draw a complete graph of the function.f(x) = -x3 + x2 + 16x - 16 [-5, 0, 1] by [-40, 25, 5]
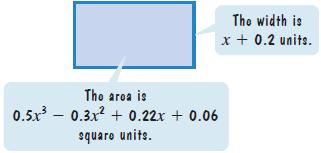
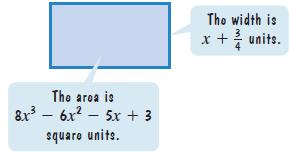
In Exercises 53–54, write a polynomial that represents the length of each rectangle. The area is 0.5x³ 0.3x² + 0.22x + 0.06 squaro units. - The width is x + 0.2 units.
In Exercises 45–56, use transformations of f(x) = 1/x or f(x) = 1/x2 to graph each rational function. h(x) 1 2 X 4
In Exercises 41–64,a. Use the Leading Coefficient Test to determine the graph’s end behavior.b. Find the x-intercepts. State whether the graph crosses the x-axis, or touches the x-axis and turns around, at each intercept.c. Find the y-intercept.d. Determine whether the graph has y-axis
In Exercises 53–56, write an equation in standard form of the parabola that has the same shape as the graph of f(x) = 3x2 or g(x) = -3x2, but with the given maximum or minimum.Maximum = 4 at x = -2
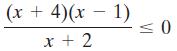
Solve each rational inequality in Exercises 43–60 and graph the solution set on a real number line. Express each solution set in interval notation. (x + 4)(x - 1) x + 2 ≤0
In Exercises 51–54, graphs of fifth-degree polynomial functions are shown. In each case, specify the number of real zeros and the number of imaginary zeros. Indicate whether there are any real zeros with multiplicity other than 1. y Xx
In a hurricane, the wind pressure varies directly as the square of the wind velocity. If wind pressure is a measure of a hurricane’s destructive capacity, what happens to this destructive power when the wind speed doubles?
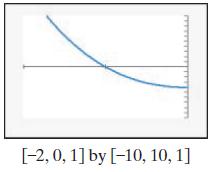
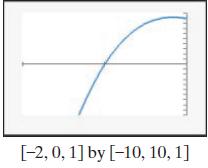
Exercises 53–60 show incomplete graphs of given polynomial functions.a. Find all the zeros of each function.b. Without using a graphing utility, draw a complete graph of the function.f(x) = -x3 + 3x2 - 4 3 [-2, 0, 1] by [-10, 10, 1]
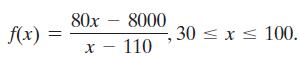
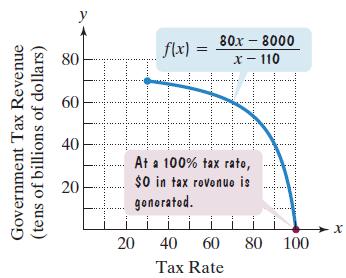
In Exercises 53–54, write a polynomial that represents the length of each rectangle.During the 1980s, the controversial economist Arthur Laffer promoted the idea that tax increases lead to a reduction in government revenue. Called supply-side economics, the theory uses functions such asThis
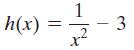
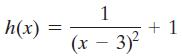
In Exercises 45–56, use transformations of f(x) = 1/x or f(x) = 1/x2 to graph each rational function. h(x) = 1 X - 3
In Exercises 41–64,a. Use the Leading Coefficient Test to determine the graph’s end behavior.b. Find the x-intercepts. State whether the graph crosses the x-axis, or touches the x-axis and turns around, at each intercept.c. Find the y-intercept.d. Determine whether the graph has y-axis
In Exercises 53–56, write an equation in standard form of the parabola that has the same shape as the graph of f(x) = 3x2 or g(x) = -3x2, but with the given maximum or minimum.Maximum = -7 at x = 5
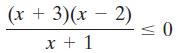
Solve each rational inequality in Exercises 43–60 and graph the solution set on a real number line. Express each solution set in interval notation. (x+3)(x - 2) x + 1 ≤0
The illumination from a light source varies inversely as the square of the distance from the light source. If you raise a lamp from 15 inches to 30 inches over your desk, what happens to the illumination?
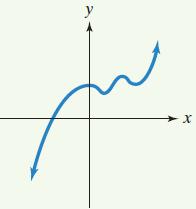
In Exercises 51–54, graphs of fifth-degree polynomial functions are shown. In each case, specify the number of real zeros and the number of imaginary zeros. Indicate whether there are any real zeros with multiplicity other than 1. у x=
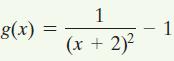
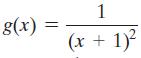
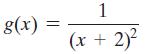
In Exercises 55–56, use transformations of f(x) = 1/x or f(x) = 1/x2 to graph each rational function. g(x) = 1 (x + 2)² 1
Exercises 53–60 show incomplete graphs of given polynomial functions.a. Find all the zeros of each function.b. Without using a graphing utility, draw a complete graph of the function.f(x) = 4x3 - 8x2 - 3x + 9 [-2,0, 1] by [-10, 10, 1]
In Exercises 51–54, graphs of fifth-degree polynomial functions are shown. In each case, specify the number of real zeros and the number of imaginary zeros. Indicate whether there are any real zeros with multiplicity other than 1. y X
In Exercises 45–56, use transformations of f(x) = 1/x or f(x) = 1/x2 to graph each rational function. g(x) 1 (x + 1)²
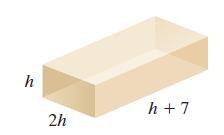
a. Use synthetic division to show that 2 is a solution of the polynomial equation 2h3 + 14h2 - 72 = 0.b. Use the solution from part (a) to solve this problem. The width of a rectangular box is twice the height and the length is 7 inches more than the height. If the volume is 72 cubic inches, find
In Exercises 39–52, find all zeros of the polynomial function or solve the given polynomial equation. Use the Rational Zero Theorem, Descartes’s Rule of Signs, and possibly the graph of the polynomial function shown by a graphing utility as an aid in obtaining the first zero or the first root.
In Exercises 39–52, find all zeros of the polynomial function or solve the given polynomial equation. Use the Rational Zero Theorem, Descartes’s Rule of Signs, and possibly the graph of the polynomial function shown by a graphing utility as an aid in obtaining the first zero or the first root.
In Exercises 41–64,a. Use the Leading Coefficient Test to determine the graph’s end behavior.b. Find the x-intercepts. State whether the graph crosses the x-axis, or touches the x-axis and turns around, at each intercept.c. Find the y-intercept.d. Determine whether the graph has y-axis
Solve each rational inequality in Exercises 43–60 and graph the solution set on a real number line. Express each solution set in interval notation. X x - 3 0<
In Exercises 45–56, use transformations of f(x) = 1/x or f(x) = 1/x2 to graph each rational function. g(x) = 1 (x + 2)²
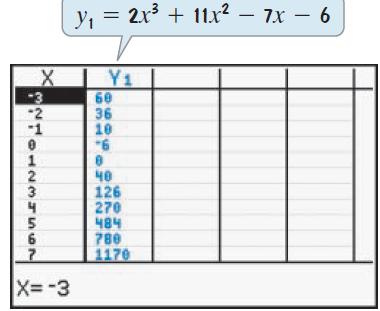
In Exercises 47–50, use the graph or the table to determine a solution of each equation. Use synthetic division to verify that this number is a solution of the equation. Then solve the polynomial equation.2x3 + 11x2 - 7x - 6 = 0 X X NOVEWNTOHNW -3 -2 -1 X=-3 y₁ = 2x³ + 11x² − 7x −
Solve each rational inequality in Exercises 43–60 and graph the solution set on a real number line. Express each solution set in interval notation. 3x + 5 6 - 2x ≥ 0
a. Use synthetic division to show that 3 is a solution of the polynomial equation 14x3 - 17x2 - 16x - 177 = 0.b. Use the solution from part (a) to solve this problem. The number of eggs, f(x), in a female moth is a function of her abdominal width, x, in millimeters, modeled by f(x) = 14x3 - 17x2 -
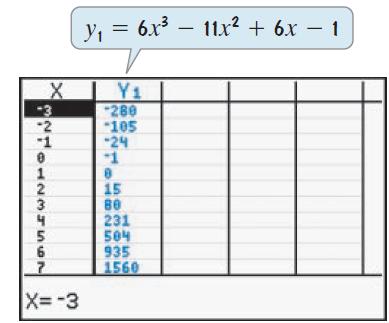
In Exercises 47–50, use the graph or the table to determine a solution of each equation. Use synthetic division to verify that this number is a solution of the equation. Then solve the polynomial equation.6x3 - 11x2 + 6x - 1 = 0 X NAVEENHOHNE 7 X=-3 Y₁ = 6x³ — 11x² + 6x −
In Exercises 41–64,a. Use the Leading Coefficient Test to determine the graph’s end behavior.b. Find the x-intercepts. State whether the graph crosses the x-axis, or touches the x-axis and turns around, at each intercept.c. Find the y-intercept.d. Determine whether the graph has y-axis
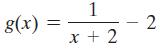
In Exercises 45–56, use transformations of f(x) = 1/x or f(x) = 1/x2 to graph each rational function. g(x) = 1 x + 2 2
In Exercises 39–52, find all zeros of the polynomial function or solve the given polynomial equation. Use the Rational Zero Theorem, Descartes’s Rule of Signs, and possibly the graph of the polynomial function shown by a graphing utility as an aid in obtaining the first zero or the first root.
In Exercises 49–52, write an equation in standard form of the parabola that has the same shape as the graph of f(x) = 2x2, but with the given point as the vertex.(-10, -5)
In Exercises 49–52, determine whether each statement makes sense or does not make sense, and explain your reasoning.When all is said and done, it seems to me that direct variation equations are special kinds of linear functions and inverse variation equations are special kinds of rational
In Exercises 49–50, find all the zeros of each polynomial function and write the polynomial as a product of linear factors.g(x) = x4 - 6x3 + x2 + 24x + 16
In Exercises 49–52, write an equation in standard form of the parabola that has the same shape as the graph of f(x) = 2x2, but with the given point as the vertex.(7, 4)
In Exercises 49–52, determine whether each statement makes sense or does not make sense, and explain your reasoning.The graph of this direct variation equation that has a positive constant of variation shows one variable increasing as the other variable decreases.
In Exercises 49–50, find all the zeros of each polynomial function and write the polynomial as a product of linear factors.f(x) = 2x4 + 3x3 + 3x - 2
In Exercises 49–52, determine whether each statement makes sense or does not make sense, and explain your reasoning.I’m using an inverse variation equation and I need to determine the value of the dependent variable when the independent variable is zero.
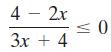
Solve each rational inequality in Exercises 43–60 and graph the solution set on a real number line. Express each solution set in interval notation. 4 - 2x 3x + 4 ≤ 0
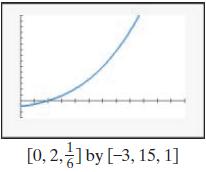
Exercises 53–60 show incomplete graphs of given polynomial functions.a. Find all the zeros of each function.b. Without using a graphing utility, draw a complete graph of the function.f(x) = 3x3 + 2x2 + 2x - 1 [0, 2,] by [-3, 15, 1]
Use function f and its graph to solve Exercises 55–56.a. Find and interpret f(40). Identify the solution as a point on the graph of the function.b. Rewrite the function by using long division to performThen use this new form of the function to find f(40). Do you obtain the same answer as you did
In Exercises 41–64,a. Use the Leading Coefficient Test to determine the graph’s end behavior.b. Find the x-intercepts. State whether the graph crosses the x-axis, or touches the x-axis and turns around, at each intercept.c. Find the y-intercept.d. Determine whether the graph has y-axis
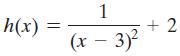
In Exercises 45–56, use transformations of f(x) = 1/x or f(x) = 1/x2 to graph each rational function. h(x) 1 (x - 3)² +2
In Exercises 53–56, write an equation in standard form of the parabola that has the same shape as the graph of f(x) = 3x2 or g(x) = -3x2, but with the given maximum or minimum.Minimum = 0 at x = 9
Use function f and its graph to solve Exercises 55–56.a. Find and interpret f(30). Identify the solution as a point on the graph of the function.b. Rewrite the function by using long division to performThen use this new form of the function to find f(30). Do you obtain the same answer as you did
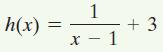
In Exercises 55–56, use transformations of f(x) = 1/x or f(x) = 1/x2 to graph each rational function. h(x) = || 1 x - 1 +3
In Exercises 41–64,a. Use the Leading Coefficient Test to determine the graph’s end behavior.b. Find the x-intercepts. State whether the graph crosses the x-axis, or touches the x-axis and turns around, at each intercept.c. Find the y-intercept.d. Determine whether the graph has y-axis
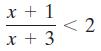
Solve each rational inequality in Exercises 43–60 and graph the solution set on a real number line. Express each solution set in interval notation. x + 1 x + 3
In Exercises 45–56, use transformations of f(x) = 1/x or f(x) = 1/x2 to graph each rational function. h(x) || 1 (x - 3)² + 1
The heat generated by a stove element varies directly as the square of the voltage and inversely as the resistance. If the voltage remains constant, what needs to be done to triple the amount of heat generated?
In Exercises 53–56, write an equation in standard form of the parabola that has the same shape as the graph of f(x) = 3x2 or g(x) = -3x2, but with the given maximum or minimum.Minimum = 0 at x = 11
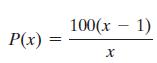
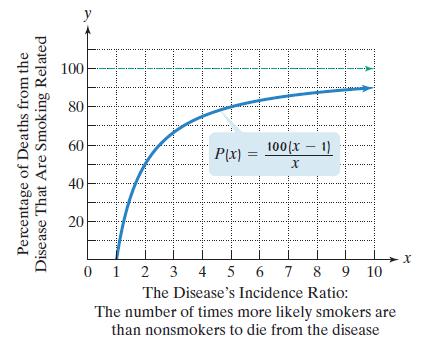
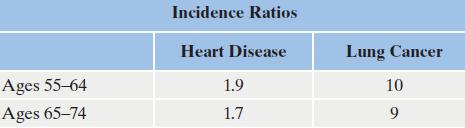
Among all deaths from a particular disease, the percentage that is smoking related (21–39 cigarettes per day) is a function of the disease’s incidence ratio. The incidence ratio describes the number of times more likely smokers are than nonsmokers to die from the disease. The following table
Exercises 101–103 will help you prepare for the material covered in the next section. Use the graph of function f to solve each exercise.Write the equation of the horizontal asymptote, or the horizontal line that the graph of f approaches but does not touch. CA -5-4-3 T ان نن ن
In Exercises 104–107, determine whether each statement is true or false. If the statement is false, make the necessary change(s) to produce a true statement.If f(x) = -x3 + 4x, then the graph of f falls to the left and falls to the right.
Among all deaths from a particular disease, the percentage that is smoking related (21–39 cigarettes per day) is a function of the disease’s incidence ratio. The incidence ratio describes the number of times more likely smokers are than nonsmokers to die from the disease. The following table
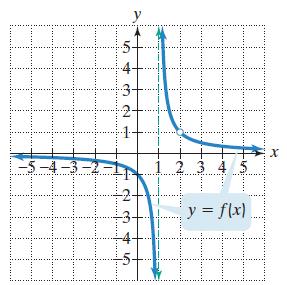
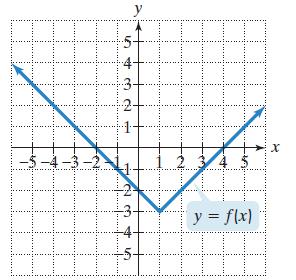
Use the following graph to solve this exercise.a. Determine the function’s domain.b. Determine the function’s range.c. What are the x-intercepts?d. What is the y-intercept?e. Determine f(-4). 543 ا نا نا y 2+ 1 H -5-4-3-3 XH IIIIPI X y = f(x) 10000
Write a rational inequality whose solution set is (-∞, -4) ∪ [3,∞).
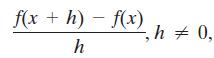
If f(x) = 4x2 - 2x + 7, find f(x +h)-f(x) h -, h = 0,
In Exercises 104–107, use inspection to describe each inequality’s solution set. Do not solve any of the inequalities. (x - 2)² > 0
Among all deaths from a particular disease, the percentage that is smoking related (21–39 cigarettes per day) is a function of the disease’s incidence ratio. The incidence ratio describes the number of times more likely smokers are than nonsmokers to die from the disease. The following table
In Exercises 104–107, determine whether each statement is true or false. If the statement is false, make the necessary change(s) to produce a true statement.A mathematical model that is a polynomial of degree n whose leading term is anxn, n odd and an < 0, is ideally suited to describe
In Exercises 104–107, use inspection to describe each inequality’s solution set. Do not solve any of the inequalities. (x - 2)² ≤ 0
Exercises 105–107 will help you prepare for the material covered in the next section.Factor: x3 + 3x2 - x - 3.
In Exercises 104–107, determine whether each statement is true or false. If the statement is false, make the necessary change(s) to produce a true statement.There is more than one third-degree polynomial function with the same three x-intercepts.
Exercises 105–107 will help you prepare for the material covered in the next section.If f(x) = x3 - 2x - 5, find f(2) and f(3). Then explain why the continuous graph of f must cross the x-axis between 2 and 3.
Among all deaths from a particular disease, the percentage that is smoking related (21–39 cigarettes per day) is a function of the disease’s incidence ratio. The incidence ratio describes the number of times more likely smokers are than nonsmokers to die from the disease. The following table
In Exercises 104–107, use inspection to describe each inequality’s solution set. Do not solve any of the inequalities. (x - 2)² < -1
In Exercises 104–107, determine whether each statement is true or false. If the statement is false, make the necessary change(s) to produce a true statement.The graph of a function with origin symmetry can rise to the left and rise to the right.
Determine whether f(x) = x4 - 2x2 + 1 is even, odd, or neither. Describe the symmetry, if any, for the graph of f.
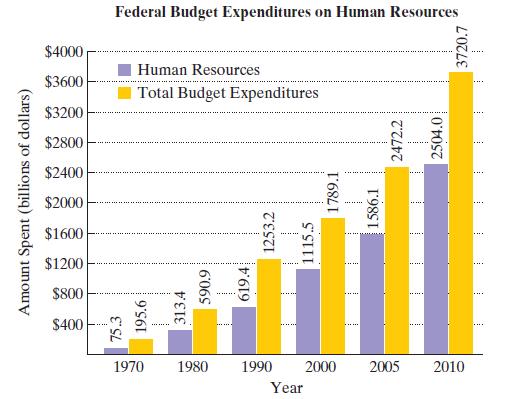
The bar graph shows the amount, in billions of dollars, that the United States government spent on human resources and total budget outlays for six selected years. (Human resources include education, health, Medicare, Social Security, and veterans benefits and services.)The function p(x) = 1.75x2 -
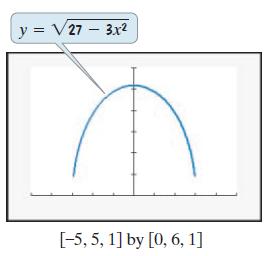
The graphing utility screen shows the graph ofWrite and solve a quadratic inequality that explains why the graph only appears for -3 ≤ x ≤ 3. y = √273x².
Use everyday language to describe the behavior of a graph near its vertical asymptote if f(x) → ∞ as x→ -2- and f(x) → ∞ as x → -2+.
In 1995, there were 315 death sentences rendered by American juries. For the period from 1995 through 2014, the number of death sentences rendered by juries decreased by approximately 13 per year. If this trend continues, by which year will American juries render 29 death sentences?
Use everyday language to describe the graph of a rational function f such that as x → - ∞, f(x) → 3.
Use the descriptions in Exercises 108–109 to write an equation of a polynomial function with the given characteristics. Use a graphing utility to graph your function to see if you are correct. If not, modify the function’s equation and repeat this process.Touches the x-axis at 0 and crosses the
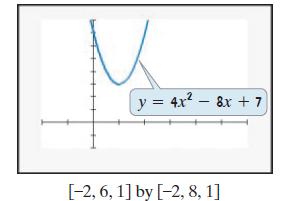
The graphing utility screen shows the graph of y = 4x2 - 8x + 7.a. Use the graph to describe the solution set of 4x2 - 8x + 7 7 0.b. Use the graph to describe the solution set of 4x2 - 8x + 7 6 0.c. Use an algebraic approach to verify each of your descriptions in parts (a) and (b). M y = 4x² - 8x
What is a rational function?
Use the descriptions in Exercises 108–109 to write an equation of a polynomial function with the given characteristics. Use a graphing utility to graph your function to see if you are correct. If not, modify the function’s equation and repeat this process.Crosses the x-axis at -4, 0, and 3;
In Exercises 104–107, use inspection to describe each inequality’s solution set. Do not solve any of the inequalities. 1 (x - 2)² 0
The size of a television screen refers to the length of its diagonal. If the length of an HDTV screen is 28 inches and its width is 15.7 inches, what is the size of the screen, to the nearest inch?
Showing 8300 - 8400
of 13634
First
77
78
79
80
81
82
83
84
85
86
87
88
89
90
91
Last
Step by Step Answers