New Semester
Started
Get
50% OFF
Study Help!
--h --m --s
Claim Now
Question Answers
Textbooks
Find textbooks, questions and answers
Oops, something went wrong!
Change your search query and then try again
S
Books
FREE
Study Help
Expert Questions
Accounting
General Management
Mathematics
Finance
Organizational Behaviour
Law
Physics
Operating System
Management Leadership
Sociology
Programming
Marketing
Database
Computer Network
Economics
Textbooks Solutions
Accounting
Managerial Accounting
Management Leadership
Cost Accounting
Statistics
Business Law
Corporate Finance
Finance
Economics
Auditing
Tutors
Online Tutors
Find a Tutor
Hire a Tutor
Become a Tutor
AI Tutor
AI Study Planner
NEW
Sell Books
Search
Search
Sign In
Register
study help
mathematics
introduction to business statistics
Introduction To Statistical Investigations 1st Edition Beth L.Chance, George W.Cobb, Allan J.Rossman Nathan Tintle, Todd Swanson Soma Roy - Solutions
In March 2012, an article titled “Eating Red Meat Regularly ‘Dramatically Increases Th e Risk Of Death From Heart Disease,’” appeared in the Daily Mail (www.dailymail.co.uk). Th e article was based on the findings of a study that followed over 120,000 men and women for almost 30 years, the
The Million Women study in England followed more than 1,000,000 women aged 50–64 years beginning in 1996, tracking their living habits and maintaining records on their medical and social factors as well as cancer data. Th e researchers found that aft er around 12 years, 3.7% (217/5,877) of the
A randomized experiment allows for the possibility of drawing a cause-and-effect conclusion between _________ and ________.A. The subjects and the treatmentsB. The observational units and the variablesC. The explanatory variable and the response variableD. Statistical significance and statistical
Which of the following is the primary purpose of randomly assigning subjects to treatments in an experiment?A. To produce similar (experimental) groups so any differences in the response variable can be attributed to the explanatory variableB. To give each subject a 50–50 chance of obtaining a
Which of the following must happen in a study to allow us to determine cause and effect?A. Taking a random sample from a populationB. Randomly assigning the observational units to different treatment groupsC. Simulation-based inference techniquesD. Theory-based inference techniques
Is random sampling or random assignment the more important consideration if the research question is whether members of one political party tend to donate more to charities than members of another political party?
Is random sampling or random assignment the more important consideration if the research question is whether a waitress generates higher tips by giving her name when she first greets customers?
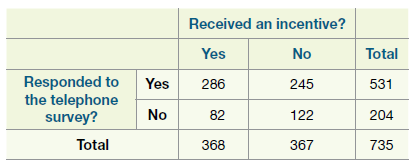
A team of researchers (Singer et al., 2000) used the Survey of Consumer Attitudes to investigate whether incentives would improve the response rates on telephone surveys. A national sample of 735 households was randomly selected, and all 735 of the households were sent an €œadvance
Reconsider Exercises 4.2.5–4.2.9. Notice that the phrase “tend to” appears in many of the research questions. Explain what this phrase means and why it is important in these questions.
Can a study have both random sampling and random assignment? If so, explain what can be determined from such a study if statistical significance is found.
Researchers could design an experiment where there is a balance with respect to the sex of the subjects between two experimental groups by putting half the females in one group and half in the other and do the same for the males. Why don’t researchers always just force variables to be balanced
Does random assignment always equally balance all the variables (except for the explanatory variable) between experimental groups? Is there a tendency for there to be a balance? Explain.
From which of the following studies can cause-and effect conclusions potentially be drawn? If cause and effect can be determined, explain what may cause what.a. From a random sample of city residents, it was found that those with higher incomes utilize the recycling services significantly more than
From which of the following studies can cause and- effect conclusions potentially be drawn? If cause and effect can be determined, explain what may cause what.a. Subjects were randomly assigned to watch one of two videos, one that was about a sad situation and one that was about a happy situation.
What is the difference between random sampling and random assignment and what types of conclusions can be drawn from each?
Many studies have shown that babies born to women who smoked while pregnant tended to weigh less at birth than babies born to mothers who did not smoke while pregnant.a. Are these studies observational studies or experiments?b. Will a cause-and-effect conclusion be possible?c. Identify the
Refer to the information provided in the previous question. While it’s possible in principle to conduct a randomized experiment to investigate this issue, it would be unethical to do so. Explain why, as if to someone who has never studied statistics.Data from previous questionMany studies have
Many studies have surveyed mothers and fathers about their behaviors (diet, health, etc.) at or immediately before the time of the conception of their baby in an attempt to find connections between these behaviors and the sex of the baby.a. Are these studies observational studies or experiments?b.
Many studies have found that children who listen to classical music while in the womb or when younger tend to have higher IQs later in life. These studies are typically done by surveying parents of older children about whether or not they played classical music when the child was younger and
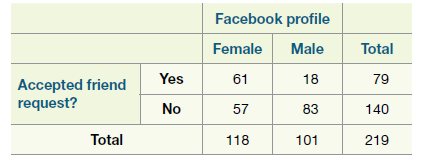
Is the sex of a person making a friend request on Facebook to someone they do not know associated with whether or not the request is accepted? To answer this question, student researchers at Hope College made up fake Facebook profiles, one representing a Hope College female student and one
Are cuteness and aggression related? A study done at Yale University tested this by showing people pictures of cute animals (like kittens and puppies) or pictures of older more serious looking animals. They tested the aggression of the subjects by giving them bubble wrap and letting them pop the
A research article, “Power Posing: Brief Nonverbal Displays Aff ect Neuroendocrine Levels and Risk Tolerance,” published in Psychological Science, September 2010, describes a study involving 42 volunteer participants (male and female), where participants were randomly assigned to hold either
Students recruited at the cafeteria at Hope College were blindly given a single Skittles® candy to put in their mouth. They were told the five possible flavors and then were asked which flavor they had. Of the 154 healthy students tested, 78 gave the correct answer. Of the 118 students tested who
Read FAQ 4.2.1 that discusses randomness and its implications and answer the following.a. The FAQ discusses how the determination that smoking causes cancer was obtained from studies that did not involve random assignment. How was that possible? Was it easy to do?b. The FAQ discusses that without
When can you legitimately draw a cause-and effect conclusion from a randomized experiment?A. When the p-value is smallB. When the p-value is largeC. Always, regardless of the p-valueD. Never, regardless of the p-value
Answer the following questions about explanatory and response variables.a. Must an explanatory variable always be categorical?b. Must a response variable always be quantitative?
In a recent study of animal-assisted therapy (Cole et al., 2007), researchers investigated whether patients hospitalized with heart failure could be helped by a visit from a dog. Th e 76 patients in the study were randomly assigned to one of three groups: one group received a 12-minute visit from a
In a study conducted in New Zealand, researchers Parkin et al. randomly assigned volunteers to wear either socks over their shoes (intervention) or their usual footwear (control) as they walked downhill on an inclined icy path. Researchers standing at the bottom of the inclined path would then rate
In a randomized, double-blind study reported in the Journal of American Medical Association, researchers Waber et al. (2008) administered a pill to each of 82 healthy paid volunteers from Boston, Massachusetts, but told half of them that the drug had a regular price of $2.50 per pill, whereas the
Narrower confidence intervals are better than wider confidence intervals. One way to achieve a narrower confidence interval is to use a smaller confidence level. So, why do statisticians not always use a confidence level of 70%?
Narrower confidence intervals are better than wider confidence intervals. One way to achieve a narrower confidence interval is to use a larger sample size. So, why do statisticians interested in estimating a parameter value for the population of all adult Americans not always use a sample size of
Higher confidence is better than lower confidence. So, why do statisticians not always use 99.99% confidence intervals?
A national survey of 47,000 American households in 2006 found that 32.4% of the households included a pet cat. Th is survey result was reported in the 2011 Statistical Abstract of the United States, which listed the American Veterinary Medical Association as the source. No information was provided
The Harris polling organization conducted a national survey in 2008, finding that 14% of the sample of 2,302 American adults had a tattoo.a. Use the Theory-Based Inference applet to determine a 99% confidence interval for the population proportion of adult Americans who had a tattoo in 2008.b.
Use the data described in the previous exercise to answer the following questions:a. Investigate your answer to 3.CE.8, part (b), by using the Theory-Based Inference applet to test the following (null) values for the parameter: 0.76, 0.78, 0.80, 0.82, and 0.84. Report the z-statistic and
Do Americans believe that the United States has a unique character that makes it the greatest country in the world? Th is belief has been called “American exceptionalism.” A Gallup poll conducted on December 10–12, 2010, asked this question of a sample of 1,019 adult Americans, with 80%
Suppose that researchers in three different countries collect sample data on whether or not a person has donated blood within the past year, with the following sample results:A. 200 blood donors in a sample of 600 peopleB. 50 blood donors in a sample of 300 peopleC. 250 blood donors in a sample of
Suppose that researchers in three different countries collect sample data on whether or not a person has donated blood within the past year, with the following sample results:A. 200 blood donors in a sample of 600 peopleB. 50 blood donors in a sample of 300 peopleC. 250 blood donors in a sample of
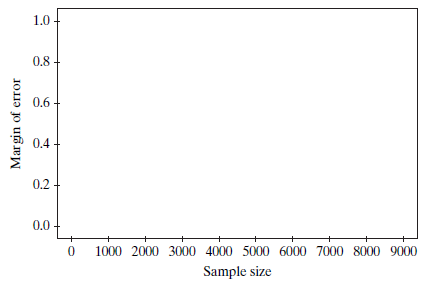
Recall that a margin of error for a 95% confidence interval for process probability can be approximated by the expression 1/ˆšn.a. Evaluate this expression (to three decimal places) for the following sample sizes: 100, 400, 1,000, 2,000, 8,000, 9,000.b. Based on your answers in part (a),
If the standard deviation were 1.25 hours instead of 1.05, the width of a 95% confidence interval would (increase/decrease).
If the standard deviation were 0.78 hours instead of 1.05, the width of a 95% confidence interval would (increase/decrease).
Which confidence interval would be the narrowest?A. 99% B. 95%C. 90% D. 85%
A confidence interval is constructed for the population mean hours studied. Which confidence interval would be the widest?A. 99% B. 95%C. 90% D. 85%
You have a coin that you think is fair, with π = probability of heads = 1/2.a. Rodgers has done 25 flips and plans to do another 25 flips. Hammerstein has done 100 flips and plans to do another 25 flips. Whose SD will go down more, Rodgers’ or Hammerstein’s? Explain.b. Rodgers has done 25
Ordinary dice have six equally likely sides. You can buy dice online with (A) 4 sides, (B) 6 sides, (C) 8 sides, or (D) 10 sides. Suppose you want to estimate the probability of rolling a 1 for each of dice (A)–(D).a. Which die (A)–(D) will give an estimate for the probability of rolling a 1
You have an ordinary six-sided die, but you suspect it may be loaded. If the die is fair, then the probability of rolling a 6 equals 1/6.a. Let π = the probability of rolling a 6. To estimate π to within 0.01 at the 95% confidence level, you need a sample size of ____________.b. The SD for p̂ is
As n increases, the SD for p̂ ________________ (increases, decreases) more and more ______________ (slowly, quickly).
Gilbert uses a sample size of 25. Sullivan uses a sample size of 100. Gilbert’s estimated SD for p̂ will be ________ times as large as Sullivan’s.
Looking at the formula to calculate the SD of p̂, the “root n relationship” means that to cut the SD of p̂ in half, you need to:A. Multiply the sample size by 1/2B. Multiply the sample size by 2C. Multiply the sample size by √2D. Multiply the sample size by 1/4E. Multiply the sample size by
A Gallup survey of 1001 randomly selected U.S. adults conducted May 2011 asked, “In your opinion, which one of the following is the main reason why students get education beyond high school?” Fifty-three percent chose “to earn more money.” Based on these data, we found the 95% confidence
Refer to the previous exercise to answer the following questions:a. If the sample size had been 2,000, how would the widths of the 90%, 95%, and 99% confidence intervals be affected?b. If the sample size had been 100, how would the widths of the 90%, 95%, and 99% confidence intervals be affected?
The 2011 Statistical Abstract of the United States includes a table reporting that a national survey in the fall of 2009 found that 11.6% of American adults had played a Sudoku puzzle in the past year. Suppose that these data are based on a sample of 1,000 randomly selected American adults.a. Use
Name three things that affect the margin of error in a theory-based confidence interval for a population mean, μ. Which of these three things is the hardest for an investigator to control?
Name three things that affect the margin of error in a theory-based confidence interval for a population proportion, π. Which of these three things is the hardest for an investigator to control?
Recall the form of a theory-based confidence interval for a population proportion π isp̂ ± multiplier × √p̂ (1 − p̂ / na. Increasing the confidence level has what effect, if any, on the midpoint of this interval?b. Increasing the confidence level has what effect, if any, on the margin of
Recall the form of a theory-based confidence interval for a population proportion π is p̂ ± multiplier × √p̂ (1 − p̂) / n.a. Remind me: What’s the difference between p̂ and π?b. The midpoint of this interval is always equal to what?c. What is √p̂ (1 − p̂ / n called?d. What
Which method can only construct a 95% confidence interval?A. Range of plausible valuesB. 2 SDC. Theory-based one-proportion z-interval
Describe three different methods for constructing a confidence interval for a population proportion.
One of the questions asked of a random sample of adult Americans on the 2004 General Social Survey (GSS) was:From time to time, most people discuss important matters with other people. Looking back over the last six months— who are the people with whom you discussed matters important to you? Just
How much do you typically pay, including tips, for a haircut? In a survey of 50 students in her class, one of the authors found the average amount paid for haircuts to be $45.68 and the standard deviation to be $39.95. Th e data are not strongly skewed.a. Explain how you know from the sample
Data were collected on random specimens of Yellow fin tuna from 1991 and 2010. For the sample of 231 specimens of Yellowfi n tuna, the average mercury level was found to be 0.354 ppm and the standard deviation of mercury level to be 0.231 ppm. Th e data are not strongly skewed.a. In the context of
Data were collected on random specimens of tuna from 1991 and 2010. The mercury level for each fish specimen was recorded. For the sample of 43 specimens of Albacore tuna, the average mercury level was found to be 0.358 parts per million (ppm) and the standard deviation of mercury level to be 0.138
Two Cal Poly freshmen gathered data on the prices for a random sample of 30 textbooks from the campus bookstore. They found the average price was $65.02, and the standard deviation of prices was $51.42. Th e data are not strongly skewed.a. Identify the observational unit for this study.b. Identify
Reconsider the previous question about number of Facebook friends. Using the data from the sample of 49 students, a 99% confidence interval for the average number of Facebook friends is found to be (425.0, 653.4). For each of the following statements, say whether VALID or INVALID.a. We are 99%
In a survey of her introductory statistics class, an instructor found the average number of Facebook friends the 49 respondents had was 539.2 and the standard deviation was 298. The data on number of Facebook friends are not strongly skewed.a. Identify the observational unit for this study.b.
Reconsider the investigation of the manufacturing process that is producing hypodermic needles. Using the data from the most recent sample of needles, a 90% confidence interval for the average diameter of needles is found to be (1.62 mm, 1.66 mm). For each of the following statements, say whether
Reconsider the investigation of the manufacturing process that is producing hypodermic needles. Recall that the most recent random sample of 35 needles have an average diameter of 1.64 mm and a standard deviation of 0.07 mm.a. Use the Theory-Based Inference applet to find and report a 98%
Reconsider the investigation of the manufacturing process that is producing hypodermic needles. Recall that the most recent random sample of 35 needles have an average diameter of 1.64 mm and a standard deviation of 0.07 mm.a. In the context of this study, explain why it is valid to use the
Consider a manufacturing process that is producing hypodermic needles that will be used for blood donations. These needles need to have a diameter of 1.65 mm—too big and they would hurt the donor (even more than usual), too small and they would rupture the red blood cells, rendering the donated
Reconsider the previous exercises about the average number of states all students at the author’s school have visited. Using the data from the author’s sample, a 99% confidence interval for the average number of states all students at the author’s school have visited is found to be (6.78,
Reconsider the previous exercises about the average number of states all students at the author’s school have visited. Recall that in the author’s sample of 50 students the average number of states the students had visited was 9.48 and the standard deviation was 7.13.a. Use the Theory-Based
Reconsider the previous question about the average number of states all students at the author’s school have visited. Recall that in the author’s sample of 50 students the average number of states the students had visited was 9.48 and the standard deviation was 7.13.a. Use the Theory-Based
In a pre course, anonymous survey of students in her introductory statistics course, one of the authors asked her students how many hours per week they expected to spend studying statistics outside of class. Forty-nine students responded to that question, with an average of 8.2 hours and a SD of
One of the authors came across an article (USA Today, 2008) that said that on average Americans have visited 16 states in the United States. In a survey of 50 students in her introductory statistics class, she found the average number of states the students had visited to be 9.48 and the standard
As was explained in the previous question, the normal (or average) body temperature of humans is oft en thought to be 98.6° F. Is that number really the average? To test this, we will use a data set obtained from 65 healthy male volunteers aged 18 to 40 that were participating in vaccine trials.
Normal (or average) body temperature of humans is often thought to be 98.6° F. Is that number really the average? To test this, we will use a data set obtained from 65 healthy female volunteers aged 18 to 40 that were participating in vaccine trials. We will assume this sample is representative of
Most dermatologists recommend using sunscreens that have a Sun Protection Factor (SPF) of at least 30. One of the authors wanted to find out whether the SPF of sunscreens used by students at her school exceeds this value on average? To collect data, the author surveyed students in her introductory
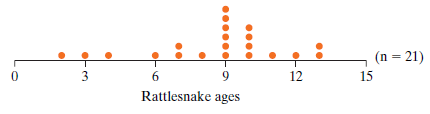
Here is a dotplot for the ages of 21 male rattlesnakes captured at a single site. Assume that these 21 snakes can be regarded as a random sample of all male rattlesnakes at that site. Th e average age is 8.571 years, with a standard deviation of 2.942 years. An approximate 95% confidence interval
Reconsider the previous question about hours spent watching TV every day. Suppose that the data had actually been collected from a sample of 150 students, and not 100, but everything else (mean and SD) was the same as reported earlier. How, if at all, would the new 95% confidence interval based on
According to a 2011 report by the United States Department of Labor, civilian Americans spend 2.75 hours per day watching television. A faculty researcher, Dr.Sameer, at California Polytechnic State University (Cal Poly) conducts a study to see whether a different average applies to Cal Poly
True or false? If you are concerned that the validity conditions aren’t met, use a theory-based approach to compute a confidence interval for the mean.
True or false? In general, there will be more variability in the sample means across samples than in the variability in the quantitative variable across observational units.
True or false? When using the 2SD method to find a 95% confidence interval for the mean, multiply the standard deviation of the quantitative variable by 2 to obtain the margin of error.
True or False? For 95% confidence intervals constructed from repeated samples from the same population, 95% of the intervals contain the parameter.
True or False? There is a 95% chance that the parameter is contained in a 95% confidence interval.
Match confidence interval terminology to the game of horseshoes.A. ParameterB. Confidence intervalC. Coverage probability1. horseshoe2. proportion of times horseshoe is around stake3. Stake
Using the simplified version for the margin of error from the previous exercise, 1/√n, determine the smallest sample size needed so the margin of error is:a. 0.06b. 0.03c. 0.01
Show that the margin-of-error formula 1.96√p̂ (1 − p̂)/n} simplifies to approximately 1/√n when p̂ = 0.5.
Based on the null distribution generated using the 1,000 simulated values of the statistic, what values would you consider typical values and what would you consider atypical values of the statistic?
How do the actual study results compare to the null distribution obtained when simulating assuming 0.10 of the population faked cell phone calls? Do you believe the study results provide convincing evidence against the “1 in 10 cell phone users fake cell phone calls” null hypothesis and in
Determine the approximate p-value from your simulation analysis. Also interpret what this p-value represents (i.e., the probability of what, assuming what?).
Now, let’s step back a bit and think about the scope of our inference. What are the wider implications? Do you think that your conclusion holds true for people in general? What is the broader population we are able to generalize to? It is important to remember how we gathered our data to answer
Summarize your findings. If you were to repeat this study, would you gather your sample in a different way? Are there things about the study you would change? What further research might you follow up with from what you have learned in this study?
Let π denote some population proportion of interest and suppose a 95% confidence interval for π is calculated to be (0.6, 0.7). Also, suppose that we want to testH0: π = 0.63 vs. Ha: π ≠ 0.63What can you say about the corresponding p-value?A. The corresponding p-value will be smaller than
Let π denote some population proportion of interest and suppose a 99% confidence interval for π is calculated to be (0.60, 0.70). Also, suppose that we want to testH0: π = 0.74 vs.Ha: π ≠ 0.74What can you say about the corresponding p-value?A. The corresponding p-value will be smaller than
Let π denote some population proportion of interest and suppose a 95% confidence interval for π is calculated to be (0.63, 0.73) and a 99% confidence interval for π is calculated to be (0.61, 0.75). Also, suppose that we want to testH0: π = 0.74 vs. Ha: π ≠ 0.74What can you say about the
Suppose I am conducting a test of significance where the null hypothesis is my cat Cayle will pick the correct cancer specimen 25% of the time and the alternative hypothesis is that she will pick the cancer specimen at a rate different than 25%. I end up with a p-value of 0.002. I also construct
Suppose I am conducting a test of significance where the null hypothesis is my cat Grayce will pick the correct cancer specimen 25% of the time and the alternative hypothesis is that she will pick the cancer specimen at a rate different than 25%. I end up with a p-value of 0.02. I also construct
Suppose I am conducting a test of significance where the null hypothesis is my cat Cayce will pick the correct cancer specimen 25% of the time and the alternative hypothesis is that he will pick the cancer specimen at a rate different than 25%. I end up with a p-value of 0.07. I also construct 95%
Tennis players oft en spin a racquet to decide who serves first. Th e spun racquet can land with the manufacturer’s label facing up or down. A reasonable question to investigate is whether a spun tennis racquet is equally likely to land with the label facing up or down. (If the spun racquet is
Showing 1200 - 1300
of 2042
First
6
7
8
9
10
11
12
13
14
15
16
17
18
19
20
Last
Step by Step Answers