New Semester
Started
Get
50% OFF
Study Help!
--h --m --s
Claim Now
Question Answers
Textbooks
Find textbooks, questions and answers
Oops, something went wrong!
Change your search query and then try again
S
Books
FREE
Study Help
Expert Questions
Accounting
General Management
Mathematics
Finance
Organizational Behaviour
Law
Physics
Operating System
Management Leadership
Sociology
Programming
Marketing
Database
Computer Network
Economics
Textbooks Solutions
Accounting
Managerial Accounting
Management Leadership
Cost Accounting
Statistics
Business Law
Corporate Finance
Finance
Economics
Auditing
Tutors
Online Tutors
Find a Tutor
Hire a Tutor
Become a Tutor
AI Tutor
AI Study Planner
NEW
Sell Books
Search
Search
Sign In
Register
study help
mathematics
introduction to business statistics
Introduction To Statistical Investigations 1st Edition Beth L.Chance, George W.Cobb, Allan J.Rossman Nathan Tintle, Todd Swanson Soma Roy - Solutions
When conducting a two-sided test of significance, the value of the parameter under the null hypothesis is plausible and will be contained in a 95% confidence interval when:A. The p-value is less than or equal to 0.05.B. The p-value is greater than 0.05.C. There is no relationship between the
When conducting a two-sided test of significance, the value of the parameter under the null hypothesis is not plausible and will not be contained in a 95% confidence interval when:A. The p-value is less than or equal to 0.05.B. The p-value is greater than 0.05.C. There is no relationship between
We use confidence intervals to estimate the value of:A. The population proportionB. The sample proportionC. The p-valueD. The standard deviation
When we say that 0.50 is a plausible value for the population proportion, plausible means 0.50 will:A. Be in the 95% confidence intervalB. Not be in the 95% confidence interval
Suppose a 95% confidence interval is constructed from a sample proportion and 0.50 is contained in the interval. Which of the following are true?A. A 90% confidence interval constructed from the same sample proportion will definitely contain 0.50.B. A 90% confidence interval constructed from the
To determine a 95% confidence interval using the interval of plausible values method, what significance level should be used on the two-sided tests?
To determine a 99% confidence interval using the interval of plausible values method, what significance level should be used on the two-sided tests?
Based on an October 2013 Gallup poll, a 95% confidence interval for the proportion of American adults that think a degree from a well-respected university is more important for a young person to succeed than obtaining knowledge or skills to do a specific job is 0.43 to 0.51. Explain exactly what
Based on an August 2013 Gallup poll, a 95% confidence interval for the proportion of American adults that thought math was the most valuable subject they studied in school is 0.31 to 0.37. Explain exactly what the confidence interval is estimating.
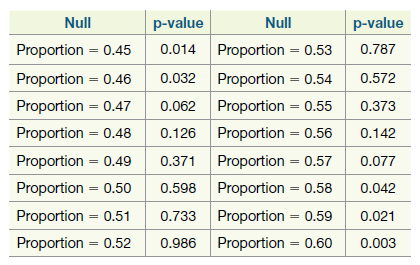
Suppose we are constructing a confidence interval using repeated tests of significance to develop an interval of plausible values. Using two-sided tests each time with the following null hypotheses, we obtain the resulting p-values.a. Using the results from the table, give a 90% confidence
Suppose we are constructing a confidence interval using repeated tests of significance to develop an interval of plausible values. Using two-sided tests each time with the following null hypotheses, we obtain the resulting p-values.a. Using the results from the table, give a 95% confidence
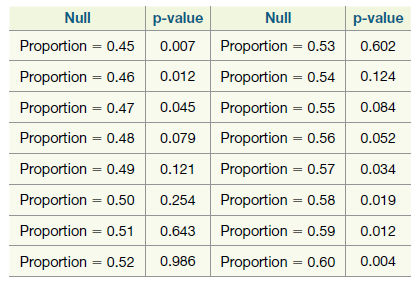
Construct a 95% confidence interval for a population proportion using repeated tests of significance to develop an interval of plausible values based on a sample proportion of 0.52 from a sample of 300. Use two-sided tests with the following values under the null hypothesis to fi nd the needed
In a May 2013 Gallup poll based on a representative sample of 1,535 adult Americans, 53% responded that they thought same-sex marriages should be legal and have the same rights as traditional marriages. Now suppose we test the null hypothesis π = 0.50 vs. the alternative hypothesis π ≠ 0.50.a.
The previous question gave the results of the Gallup poll where 53% of a sample of 1,535 adult Americans responded that they thought same-sex marriages should be legal and have the same rights as traditional marriages. Use the One Proportion applet, repeatedly testing possible values for π, to
Construct a 95% confidence interval for a population proportion using repeated tests of significance to develop an interval of plausible values based on a sample proportion of 0.52 from a sample of 600. Use two-sided tests with the following values under the null hypothesis to find the needed
Do you feel comfortable generalizing your conclusions to all cell phone users? If not, is there a population you feel you can generalize your conclusions to?
Was the sampling method unbiased?
Was the sample random?
Do you feel comfortable generalizing your conclusions to all cell phone users? If not, is there a population (broader than the sample) you feel you can generalize your conclusions to?
Was the sampling method unbiased?
Was the sample random?
Refer to Exercise 2.CE.9.a. Based on the test results found in Exercise 2.CE.9, part (b), if you are testing at a significance level of 5% and you have made an error, what type of error have you made? (Type I or Type II?)b. If you are testing at the 5% level of significance and you have made a Type
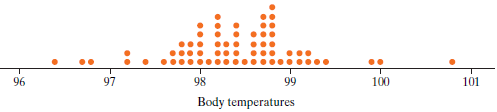
Body temperatures were measured on a random sample of 20 females and 20 males applying for health insurance. Together, their average temperature was 98.8°F with a standard deviation of 0.2°F.a. Are validity conditions met to carry out a theory-based test of significance to see if average adult
Biased samples either overestimate or underestimate the parameter of interest. List the samples from Exercise 2.CE.7 you think might overestimate the following parameters.a. Average student GPAb. Proportion of male studentsc. Proportion of female studentsd. Proportion of out-of-state students
Which samples do you think are nonbiased samples of the population of all students at a college/fouryear university? If it is a biased sample, is there a different population for which you believe the sample could be considered a nonbiased sample?a. A random sample of 100 students from the
Refer to Exercise 2.CE.5. Suppose you are testing to see if the population proportion of all brides who keep their own name is different from 15%.a. If testing at a significance level of 5%, would you find evidence for the population proportion of brides between 2001 and 2005 who kept their own
What percentage of U.S. brides keep their own names after marriage, as opposed to taking their husband’s name or using some modification (such as hyphenation) of her name and her husband’s? Researchers investigated this question by selecting a sample of wedding announcements in the New York
A study published in 2009 (Goldstein et al., 2009) involved a sample of 499 adults selected from various regions across the country of Israel. These adults were approached by interviewers in public gathering areas and asked to complete a survey about whether or not they read while using the toilet.
A reader wrote in to the “Ask Marilyn” column in Parade magazine to say that his grandfather told him that in three-fourths of all baseball games, the winning team scores more runs in one inning than the losing team scores in the entire game. (This phenomenon is known as a “big bang.”)
Suppose that you select a sample of students at your university by standing in front of the library and asking students who pass by to take a survey.a. Would this be a simple random sample from the population of all students at your university? Explain briefly.b. Name a variable for which you
Suppose that you select Major League Baseball (MLB) games played during the second week in April as a sample of all MLB games played in the upcoming season.a. Would this be a simple random sample? Explain briefly.b. Following up on part (a), consider two variables that you could record about each
Explain, as if to someone who doesn’t know much about statistics, why it’s dangerous to reach dramatically different conclusions for p-values of 0.04999 and 0.50001 obtained on the same dataset.
Reconsider Example 1.5 about whether trick-or treaters have an overall preference between Halloween toys or candy.a. Describe what Type I error means in this context.b. Describe what Type II error means in this context.c. Based on the p-value in that study (in which 148 trick-or treaters in the
Reconsider Example 1.4 about whether winners of elections can be predicted better than random chance simply by considering the faces of the candidates.a. Describe what Type I error means in this context.b. Describe what Type II error means in this context.c. Based on the p-value in that study
Example P.1 describes a study that compared proportions of people who agreed to become organ donors, depending on the type of default option used. The null hypothesis is that all three default options have the same probability of a person agreeing to become an organ donor. The alternative
Later in the book you will encounter hypotheses of the following type:H0: Men and women do not differ on average with regard to the variable of interest.Ha: Men and women do diff er on average with regard to the variable of interest.a. Describe what Type I error means in this context.b. Describe
Later in the book you will encounter many hypotheses of the following type:H0: New treatment is no better than current treatment.Ha: New treatment is better than current treatment.a. Describe what Type I error means in this context.b. Describe what Type II error means in this context.
Spam filters in an email program are similar to hypothesis tests in that there are two possible decisions and two possible realities and therefore two kinds of errors that can be made. The hypotheses can be considered as:H0: Incoming email message is legitimate.Ha: Incoming email message is spam.a.
Lie detector tests are similar to hypothesis tests in that there are two possible decisions and two possible realities and therefore two kinds of errors that can be made. The hypotheses can be considered as:H0: Subject is actually telling the truth.Ha: Subject is actually lying.a. Describe what
As with a jury trial, another analogy to hypothesis testing involves medical diagnostic tests. These tests aim to indicate whether or not the patient has a particular disease. But the tests are not infallible, so errors can be made. The null hypothesis can be regarded as the patient being healthy.
Suppose that you are considering whether to publish a weekly alternative newspaper on campus. You decide to survey a random sample of students on your campus to ask if they would be likely to read such a newspaper. Your plan is to proceed with publication only if the sample data provide strong
Recall that the two errors discussed in this chapter were regarded as “false alarm” and “missed opportunity.” In some fields, these errors are also regarded as “consumer’s risk” and “producer’s risk.” With regard to the previous exercise about the hypodermic needle manufacturing
Consider a manufacturing process that is producing hypodermic needles that will be used for blood donations. These needles need to have a diameter of 1.65 mm—too big and they would hurt the donor (even more than usual), too small and they would rupture the red blood cells, rendering the donated
The significance level α determines the probability of making a Type I error. Errors are bad. So, why don’t we always set ???? to be extremely small, such as 0.0001?
Reconsider Harley the dog from Exploration 1.1 and the previous exercise. We found that the observed data provided very strong evidence that Harley the dog was doing better than random chance. Which type of error (I or II) could we possibly be making with this conclusion? What does this type of
In Exploration 1.1, we looked at a study to investigate whether Harley the dog could select the correct cup more than 50% of the time in the long run.a. Describe what a Type I error would be in this study.b. Describe what a Type II error would be in this study.
Reconsider dolphins Buzz and Doris from Example 1.1 and the previous exercise. We found that the observed data provided very strong evidence that Doris and Buzz were actually communicating better than random chance. Which type of error (I or II) could we possibly be making with this conclusion?
In Example 1.1, we looked at a study to investigate whether dolphins could communicate. In doing so, we tested whether Buzz, one of the dolphins, could push the correct button more than 50% of the time in the long run.a. Describe what a Type I error would be in this study.b. Describe what a Type II
A researcher decides to set the significance level to 0.10.a. If the null hypothesis is true, what is the probability of a Type I error?b. If the researcher chooses a smaller significance level, what will be the impact on the probability of a Type II error, assuming the alternative hypothesis is
A researcher decides to set the significance level to 0.001.a. If the null hypothesis is true, what is the probability of a Type I error?b. If the researcher chooses a larger significance level, what will be the impact on the probability of a Type II error, assuming the alternative hypothesis is
Suppose that you perform a significance test and obtain a p-value of 0.036.a. For what significance levels α would you reject the null hypothesis?b. For what significance levels α would you fail to reject the null hypothesis?
Suppose that you perform a significance test using the α = 0.05 significance level.a. For what p-values would you reject the null hypothesis?b. For what p-values would you fail to reject the null hypothesis?
Suppose that you perform a significance test and, based on the p-value, decide to reject the null hypothesis at the α = 0.01 significance level. Th en suppose that your colleague decides to conduct the same test on the same data but using a different significance level. For each of the following
Suppose that you perform a significance test and, based on the p-value, decide to reject the null hypothesis at the α = 0.05 significance level. Then suppose that your colleague decides to conduct the same test on the same data but using a different significance level. For each of the following
Indicate whether or not you would reject the null hypothesis, with a p-value of 0.064, for the following significance levels.a. α = 0.05 b. α = 0.10c. α = 0.01 d. α = 0.065
Indicate whether or not you would reject the null hypothesis, at the α = 0.05 significance level, for the following p-values.a. p-value = 0.078 b. p-value = 0.045c. p-value = 0.001 d. p-value = 0.051
Suppose that we conduct a test of significance using 5% as our level of significance.a. What is the probability of making a Type I error (if the null hypothesis is true)?b. Suppose we conduct 10 different tests of significance each using a 5% significance level (and again where all the null
In your own words, explain the concept of degrees of freedom as it relates to t-distributions, including discussion of how a t-distribution begins to look like a normal distribution as the degrees of freedom change.
In your own words, explain why (mean − median)/SD is a good measure of skewness.
Normal (or average) body temperature of humans is often thought to be 98.6°F. Is that number really the average body temperature for human males? To test this, we will use the MaleTemps data set (available from the textbook website) from the previous exercise.a. Write out the null and alternative
The data set MaleTemps (found on the textbook website) consists of 65 body temperatures from healthy male volunteers aged 18 to 40 that were participating in vaccine trials. Put this data set into the Descriptive Statistics applet and answer the following questions.a. Is the distribution of
Consider the investigation of the manufacturing process that is producing hypodermic needles. Recall that the most recent random sample of 35 needles have an average diameter of 1.64 mm and a standard deviation of 0.07 mm.a. Use the Theory-Based Inference applet to find and report a standardized
According to a Pew Research Center report from 2012, the average commute time to work in California is 27.5 minutes. To investigate whether a different average is true for the small city that she lives in, a California high school student surveys 45 people she knows—her teachers, her parents and
In the same study as was mentioned in the previous two exercises, data were also collected on 65 healthy female volunteers aged 18 to 40 that were participating in the vaccine trials. Th e data set Female Temps consisting of body temperatures from the 65 females is available from the textbook
Consider the investigation of the manufacturing process that is producing hypodermic needles.a. Describe how you can conduct a simulation-based test of significance to investigate whether the data provide evidence that the average diameter of needles produced by this manufacturing process is
Consider a manufacturing process that is producing hypodermic needles that will be used for blood donations. These needles need to have a diameter of 1.65 mm—too big and they would hurt the donor (even more than usual), too small and they would rupture the red blood cells, rendering the donated
Reconsider the study about one of the authors wanting to find out whether the SPF of sunscreens used by students at her school (which is in a very sunny part of the U.S.) exceeds 30, on average.a. In the context of this study, is the theory-based approach (one-sample t-test) valid to find a p-value
Reconsider the study about one of the authors wanting to find out whether the SPF of sunscreens used by students at her school (which is in a very sunny part of the U.S.) exceeds 30, on average.a. Describe how you can conduct a simulation-based test of significance to investigate whether the data
According to a 2011 report by the U.S. Department of Labor, civilian Americans spend 2.75 hours per day watching television. A faculty researcher, Dr. Sameer, at California Polytechnic State University (Cal Poly) conducts a study to see whether a different average applies to Cal Poly students.a.
Most dermatologists recommend using sunscreens that have a sun protection factor (SPF) of at least 30. One of the authors wanted to find out whether the SPF of sunscreens used by students at her school (which is in a very sunny part of the U.S.) exceeds this value, on average?a. Identify the
Reconsider Dr. Sameer’s research question about how much time Cal Poly students spend on watching television, and recall that for the random sample of 100 Cal Poly students’ number of hours per day spent watching TV the mean and standard deviation turned out to be 3.01 hours and 1.97 hours,
a. Suppose that on analyzing the data from the survey of a random sample of 100 Cal Poly students, the p-value for Dr. Sameer’s study was computed to be 0.16. Interpret what this p-value means in the context of the study.b. Another faculty researcher, Dr. Elliot, had hypothesized that Cal Poly
Reconsider Dr. Sameer€™s research question about how much time Cal Poly students spend on watching television. Suppose that Dr. Sameer surveys a random sample of 100 Cal Poly students, and for this sample the mean number of hours per day spent watching TV turns out to be 3.01 hours.a. Is
Reconsider Dr. Sameer’s research question about how much time Cal Poly students spend on watching television. Suppose that for the random sample of 100 Cal Poly students the mean number of hours per day spent watching TV turns out to be 3.01 hours, and the standard deviation of the number of
Students in a statistics class were asked the cost of their last haircut. Th e data set can be found on the textbook website as HaircutCosts. Put this data set into the Descriptive Statistics applet and answer the following questions.a. Is the distribution of haircut costs symmetric, skewed tothe
In which scenario would you expect to see more variability in the data: heights of a random sample of 100 college students or heights of a random sample of 500 college students?A. Random sample of 100 college studentsB. Random sample of 500 college studentsC. Both samples will have similar
Suppose that birth weights of babies in the U.S. have a mean of 3250 grams and standard deviation of 550 grams. Based on this information, which of the following is more unlikely? Circle one.A. A randomly selected baby has a birth weight greater than 4000 grams.B. A random sample of 10 babies has
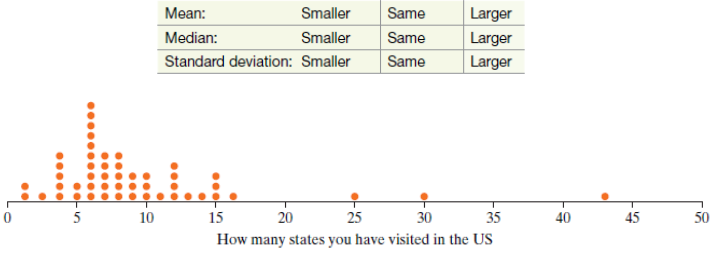
An instructor collected data on the number of states students in her class have visited in the U.S. A dotplot for the collected data is shown below.a. Identify the observational units.b. Identify the variable recorded and whether it is categorical or quantitative.c. Describe what the graph tells us
a. Suppose that an instructor decides to add five points to every student’s exam score in a class. What effect would this have on the mean exam score for the class? On the median exam score? What effect would this have on the standard deviation of exam scores? Explain.b. Suppose that an
Reconsider the previous exercise where the monthly salaries of the three people working in a small firm are $3500, $4000, and $4500. If instead of a $100 raise, everyone gets a 10% raise, how, if at all, would the standard deviation of the three salaries change?A. The standard deviation would stay
Reconsider the previous exercise. The monthly salaries of the three people working in a small firm are $3,500, $4,000, and $4,500. Suppose the firm makes a profit and everyone gets a $100 raise. How, if at all, would the standard deviation of the three salaries change?A. The standard deviation
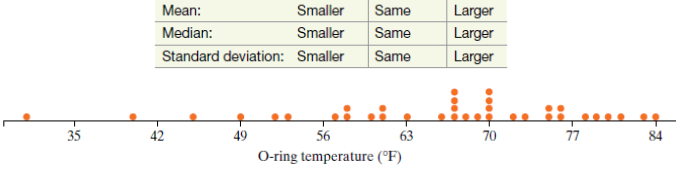
On January 28, 1986, the Space Shuttle Challenger broke apart 73 seconds into its flight, killing all seven astronauts on board. All investigations into reasons for the disaster pointed towards the failure of an O-ring in the rocket€™s engine. Given below is a dotplot and some descriptive
The monthly salaries of the three people working in a small firm are $3,500, $4,000, and $4,500. Suppose the firm makes a profit and everyone gets a $100 raise. How, if at all, would the average of the three salaries change?A. The average would stay the same.B. The average would increase.C. The
Referring to Example 1.1 about Doris and Buzz, explain where randomization occurs in your chance model but may not be truly random chance in the study.
Referring to Example 1.1. about Doris and Buzz, explain where randomization could come into play in the study design.
True or false? Increasing the sample size n, always helps improve the bias in the sample. Explain.
Explain, as if to someone who doesn’t know statistics, why taking a random sample of only 1500 people from a very large population is representative, even of rare subpopulations.
In the previous exercise, explain whether or not you believe the sample is representative of the population of interest and why.In order to understand reasons why consumers visit their store, a local business conducts a survey by asking the next 100 people who visit their store to fill out a short
Identify each of the following by describing it or stating its value (where possible).a. Population of interestb. Samplec. Parameter of interestd. StatisticIn order to understand reasons why consumers visit their store, a local business conducts a survey by asking the next 100 people who visit
In the previous exercise, explain whether or not you believe the sample is representative of the population of interest and why.In order to investigate how many hours a day students at their school tend to spend on course work outside of regularly scheduled class time, a statistics student takes a
Identify each of the following by describing it or stating its value (where possible).a. Population of interestb. Samplec. Parameter of interestd. StatisticIn order to investigate how many hours a day students at their school tend to spend on course work outside of regularly scheduled class time, a
Consider how the sample for the study was selected. If the study was conducted by taking a random sample, explain (in enough detail that someone could follow your directions to obtain the sample) how it could have been done. If the study was not conducted by taking a random sample, explain how you
Among the sample, the information for three particular sharks is given here:(i) Shark 1 had the disease and had a blood oxygen level of 1.2%.(ii) Shark 2 did not have the disease and had a blood oxygen level of 5.6%.(iii) Shark 3 did not have the disease and had a blood oxygen level of 6.2%.Use
Because the disease affects a shark’s ability to extract oxygen from the water, the zoologist also measures the shark’s blood oxygen content. Th e zoologist finds that, on average, shark’s blood oxygen content is 4.2%.a. Identify the variable measured on each shark.b. Is the variable
Evaluate the strength of evidence for the hypotheses in the previous question.a. Find the p-value for the hypotheses in the previous question using a simulation-based approach.b. Based on the p-value evaluate the strength of evidence and state a conclusion about diseased sharks.c. To which
The zoologist wishes to test whether there is evidence that less than one-fourth of the sharks in the aquarium are diseased.a. State the null and alternative hypotheses for this test.b. What is the value of the statistic?A zoologist at a large metropolitan zoo is concerned about a potential new
Use the previous information to answer the following questions about the study.a. Identify the variable measured on each shark.b. Is the variable categorical or quantitative?c. Identify at least one statistic that the zoologist could use to summarize the variable.d. Identify at least one graph that
Use the previous information to answer the following questions about the shark survey.a. Describe in words the parameter of interest.b. Identify the numeric value of the statistic corresponding to the above parameter.A zoologist at a large metropolitan zoo is concerned about a potential new disease
Use the previous information to answer the following questions.a. What is the population of interest?b. Do you believe that the proportion of diseased sharks in the sample is likely less than, similar to, or greater than the proportion of diseased sharks in the population? Why?A zoologist at a
Consider how the sample for the study was s elected. If the study was conducted by taking a random sample, explain (in enough detail that someone could follow your directions to obtain the sample) how it could have been done. If the study was not conducted by taking a random sample, explain how you
Showing 1300 - 1400
of 2042
First
7
8
9
10
11
12
13
14
15
16
17
18
19
20
21
Step by Step Answers