New Semester
Started
Get
50% OFF
Study Help!
--h --m --s
Claim Now
Question Answers
Textbooks
Find textbooks, questions and answers
Oops, something went wrong!
Change your search query and then try again
S
Books
FREE
Study Help
Expert Questions
Accounting
General Management
Mathematics
Finance
Organizational Behaviour
Law
Physics
Operating System
Management Leadership
Sociology
Programming
Marketing
Database
Computer Network
Economics
Textbooks Solutions
Accounting
Managerial Accounting
Management Leadership
Cost Accounting
Statistics
Business Law
Corporate Finance
Finance
Economics
Auditing
Tutors
Online Tutors
Find a Tutor
Hire a Tutor
Become a Tutor
AI Tutor
AI Study Planner
NEW
Sell Books
Search
Search
Sign In
Register
study help
mathematics
introduction to business statistics
Introduction To Statistical Investigations 1st Edition Beth L.Chance, George W.Cobb, Allan J.Rossman Nathan Tintle, Todd Swanson Soma Roy - Solutions
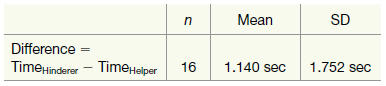
Researchers Hamlin et al. (Nature, 2007) conducted a study with 16 infants that involved an assessment of infants€™ expectations of a climber toy€™s attitude towards a €œhelper€ (a toy figure that helped the climber climb a hill) and a
Refer to the previous exercises about the study of parents’ perceptions of their children’s size. The researchers Kaufman et al. (Current Biology, 2013) also surveyed a sample of 38 parents about their eldest child’s height. The parents overestimated their eldest child’s height by 0.40 cm,
Refer to the previous exercise about the study of parents’ perceptions of their children’s size by researchers Kaufman et al. (Current Biology, 2013). Recall that the sample of 39 parents underestimated their youngest child’s height by 7.50 cm, on average; the standard deviation for the
In a study of parents’ perceptions of their children’s size, researchers Kaufman et al. (Current Biology, 2013) asked parents to estimate their youngest child’s height. The researchers hypothesized that parents tend to underestimate their youngest child’s size because the youngest child is
Refer to Exercise 7.2.12 where a student wanted to investigate whether or not people tend to marry spouses of similar ages and so gathered age data from a sample of 24 couples taken from marriage licenses filed in Cumberland County, PA, in June and July 1993.a. Define, in words, the appropriate
Design your own experiment: Develop the plan for the investigation of a research question that would be best answered using paired data.a. State the research question.b. Explain how pairing will be used.c. Identify the response and explanatory variables.d. Describe how randomization (random
Reconsider the previous exercises on handedness and reaction time. If you haven’t already done so, put the data file Reaction Times into the Matched Pairs applet and do at least 1,000 randomizations.a. Determine an approximate 95% confidence interval using the 2SD rule for the mean difference in
Reconsider the previous exercise on handedness and reaction time. If you haven’t already done so, put the data file Reaction Times into the Matched Pairs applet and do at least 1,000 randomizations.a. What is the standardized statistic in this study?b. Based on the standardized statistic is there
Student researchers wanted to see if a person’s reaction time is slower if they use their nondominant hand to click a computer mouse compared to using their dominant hand. The researchers had a computer program that would display a red circle. When it changed to yellow, the subjects were to click
Reconsider the previous exercises on memorization with and without a delay. If you haven’t already done so, put the data file MemorizationDelay into the Matched Pairs applet and do at least 1,000 randomizations.a. Determine an approximate 95% 2SD confidence interval for the mean difference in the
Reconsider the previous exercise on memorization with and without a delay. If you haven’t already done so, put the data file MemorizationDelay into the Matched Pairs applet and do at least 1,000 randomizations.a. What is the standardized statistic in this study?b. Based on the standardized
Student researchers wanted to see whether a short delay between seeing a list of words and when people were asked to recall them would hinder memorization. The subjects were shown a list of words to memorize for 1 minute and were then given 1 minute to recall as many words as they could. Each
Students wanted to see whether exercising (in particular doing jumping jacks) would help or hinder people’s ability to memorize a list of 10 words that were read to them. This would be compared to the same test of memorizing words while the subjects were sitting down. The number of words
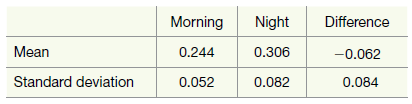
Reconsider the previous exercises about reaction times and time of day. The statistic used was the mean of the difference in reaction times (morning ˆ’ night). Explain how the following things would change (or not) if we used the mean of the (night ˆ’ morning) as the statistic
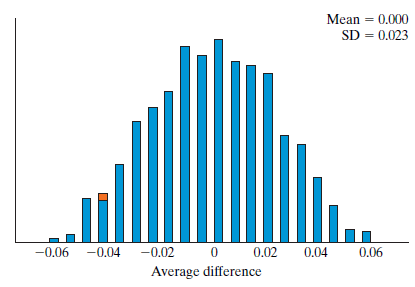
Reconsider the previous exercises about reaction times and time of day.a. Find an approximate 95% confidence interval for the mean difference in the reaction times (morning ˆ’ night) for the population of interest.b. Based on your confidence interval, from part (a), is there strong
Student researchers wanted to see whether a person€™s reaction time is affected by the time of day. They had a computer program that would display a red circle. When it changed to yellow, the subjects were to click the mouse as fast as they could and the computer would calculate the
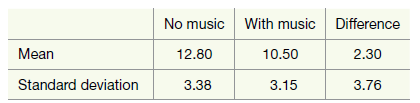
Reconsider the previous exercises about memorization with and without music. The statistic used was the mean of the difference in words memorized (no music ˆ’ music). Explain how the following things would change (or not) if we used the mean of the (music ˆ’ no music) as the
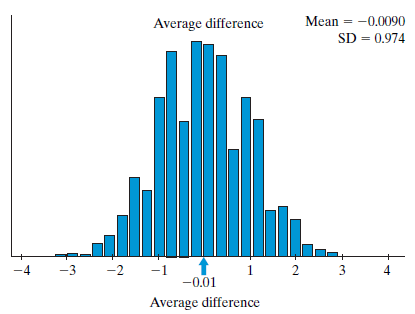
Reconsider the previous exercise about memorization with and without music.a. The standard deviation of the null distribution shown is 0.974. Use this to find an approximate 95% confidence interval for the mean difference in the number of words memorized (no music ˆ’ music) for the
Does listening to music affect how many words you can memorize? Student researchers tried to answer this question by having 20 subjects listen to music while trying to memorize words and also had the same 20 subjects try to memorize words when not listening to music. They randomly determined which
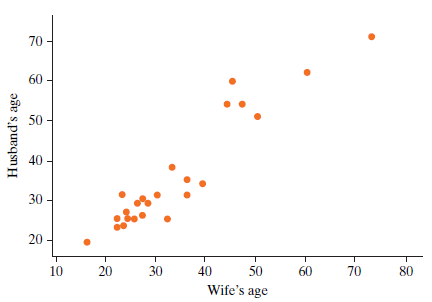
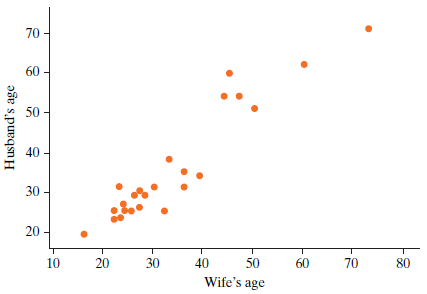
In the previous exercise the statistic used was the mean of the difference in ages (husband’s age − wife’s age). Explain how the following things would change (or not) if you used the mean of the wife’s ages − husband’s ages as your statistic when you conducted this test?a. Observed
To investigate whether or not people tend to marry spouses of similar ages or whether husbands tend to be older than their wives, a student gathered age data from a sample of 24 couples, taken from marriage licenses filed in Cumberland County, PA, in June and July 1993. The data file Marriage Ages
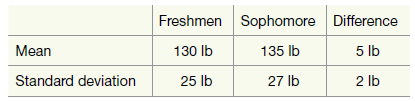
Suppose the table below represents statistics about the weights of female college students during their first two years of college. You are interested in trying to show that female college students gain weight between their first and second years in college. Explain what in this summary tells you
What is the coin flip accomplishing in the Matched Pairs applet and why is it doing it?
The Matched Pairs applet displays parallel dotplots of the response variable for two different conditions of a study. It also displays a dotplot for the differences. Which is the more useful dotplot to look at to help you determine whether the test of significance will give you significant results?
A researcher takes a sample of sibling-pairs from two-child families. All individuals are given a test of their impatience, hypothesizing that older siblings tend to have higher levels of impatience.a. State the null and alternative hypotheses.b. Identify the explanatory and response variables.c.
A researcher measures body flexibility in college students. She suspects that females will be more flexible than males.a. State the null and alternative hypotheses.b. Identify the explanatory and response variables.c. Identify whether the study uses an independent groups design or a paired study
Match the appropriate test of significance to each of the following research questions.1. Testing a single proportion2. Testing a single mean3. Comparing two proportions4. Comparing two means (independent)5. Testing a mean difference (paired data)a. Is the average body temperature higher than
Match the appropriate test of significance to each of the following research questions.1. Testing a single proportion2. Testing a single mean3. Comparing two proportions4. Comparing two means (independent)5. Testing a mean difference (paired data)a. Do a minority of males think cigars smell good?b.
In the matched pairs tests done in this section:A. The explanatory and response variables are categorical.B. The explanatory and response variables are quantitative.C. The explanatory variable is categorical and the response variable is quantitative.D. The explanatory variable is quantitative and
What does one outcome in a null distribution made by the Matched Pairs applet represent?A. It is a simulated mean difference under the assumption there is no association between the explanatory and response variables in the study.B. It is a simulated mean difference under the assumption there is an
Suppose you are testing the hypotheses H0: μd = 0 and Ha: μd ≠ 0 in a paired-design test and obtain a p-value of 0.02. Also suppose you computed confidence intervals for μd. Based on the p-value which of the following is true?A. Both a 95% confidence interval and a 99% confidence interval will
Suppose you are testing the hypotheses H0: μd = 0 and Ha: μd ≠ 0 in a paired-design and obtain a p-value of 0.21. Which one of the following could be a possible 95% confidence interval for μd?A. −2.30 to −0.70B. −1.20 to 0.90C. 1.50 to 3.80D. 4.50 to 6.90
Read FAQs 7.1.1 and 7.1.2 and then answer the following questions:a. Suppose I want to compare two blood pressure medicines with a paired design. Describe how to carry out the study using repeat observations on each subject.b. Suppose instead I decide to pair individuals. Do you recommend that I
Reconsider the caffeine and running time study in the previous questions.a. Describe how you would conduct this study with a paired design using matching?b. Which design, paired with repeated measures or paired with matching, would you say is more appropriate for this study? Explain why.Data from
Reconsider the caffeine and running time study in the previous question.a. Describe how you would conduct this study with an independent samples design?b. Which design, paired with repeated measures or independent samples, would you say is more appropriate for this study? Explain why.Data from
Researches wanted to see if using a caffeine supplement would make runners faster in a 5-kilometer run.a. Suppose you had 30 subjects participating in this study. Describe how you would conduct this study with a paired design with repeated measures.b. If you found a significant difference in
Reconsider the chewing gun and memorization study in the previous questions.a. Describe how you would conduct this study with a paired design using matching?b. Which design, paired with repeated measures or paired with matching, would you say is more appropriate for this study? Explain why.Data
Reconsider the chewing gum and memorization study in the previous question.a. Describe how you would conduct this study with an independent samples design?b. Which design, paired with repeated measures or independent samples, would you say is more appropriate for this study? Explain why.Data from
Students wanted to see if chewing gum would help people memorize words from a given list of 25 words compared to trying to memorize words when not chewing gum.a. Suppose you had 20 subjects participating in this study. Describe how you would conduct this study with a paired design with repeated
Reconsider the memorization and exercise study in the previous questions.a. Describe how you would conduct this study with a paired design using matching?b. Which design, paired with repeated measures or paired with matching, would you say is more appropriate for this study? Explain why.Data from
Reconsider the memorization and exercise study in the previous question.a. Describe how you would conduct this study with an independent samples design?b. Which design, paired with repeated measures or independent samples, would you say is more appropriate for this study? Explain why.Data from
Students wanted to see if exercising (in particular doing jumping jacks) would help people memorize a list of 10 words that were read to them. They wanted to compare this with the same test of memorizing words while the subjects were sitting down.a. Suppose you had 20 subjects participating in this
Reconsider the reaction time study in the previous questionsa. Describe how you would conduct this study with a paired design using matching?b. Which design, paired with repeated measures or paired with matching, would you say is more appropriate for this study? Explain why.Data from previous
Reconsider the reaction time study in the previous question.a. Describe how you would conduct this study with an independent samples design?b. Which design, paired with repeated measures or independent samples, would you say is more appropriate for this study? Explain why.Data from previous
To test reaction times, a computer program will display a red circle. When it changes to yellow, the users click the mouse as fast as they can. The program will then display the reaction time. Students want to compare reaction times between people using their dominant hand and nondominant hand on
Suppose an instructor wants to see if there is an association between the amount of sleep students get and their ability to memorize words. The instructor asks her students to suggest ways to collect data to investigate this question.For each of the suggestions, identify:• Whether the study is an
Suppose an instructor wants to study the association between caffeine intake and performance in the long jump. Th e instructor asks her students to suggest ways to collect data to investigate this question. For each of the suggestions, identify:• Whether the study is an experiment or an
Suppose that you want to determine whether there is a difference between the distances traveled by two different brands of golf balls. You use the 30 people on your golf league to participate in the study.a. Describe, in detail, the design of an experiment that does not utilize pairing.b. Next,
Suppose that you want to determine whether there is a difference between the distances traveled by an air-filled football and by a helium-filled football, and that you have managed to recruit 12 punters of varying abilities to participate in the study.a. Describe, in detail, the design of an
Which of the following is an example of a paired design?A. A teacher taught one class a lesson using technology and another class without technology. Their scores on a quiz were then compared.B. A teacher taught a lesson using technology and then compared the class scores on a quiz to the national
Which of the following is an example of a paired design?A. A teacher compares the pretest and posttest scores of a group of students.B. A teacher compares the scores of students using a computer based method of instruction with the scores of other students using a traditional method of
What is the difference between paired design using repeated measures and paired design using matching?
For each of the following, indicate whether or not a paired analysis would be appropriate.a. A school cafeteria offers a vegetarian and a nonvegetarian option for lunch every day. For a period of two weeks, you record how many calories are in the vegetarian option and how many calories are in the
For each of the following, indicate whether or not a paired analysis would be appropriate.a. To investigate the claim that first-year college students tend to gain weight during their first term, you take a random sample of 20 first-year students and weigh them at the beginning and end of their
For the following scenarios, determine whether or not they represent paired samples.a. Test scores for students in a biology class taught by Professor Quick are being compared to test scores in a different section of the biology class taught by Professor Quack.b. Pulse rates for students at the
Which of the following statements are true and which are false?a. In a paired design, each pair of observations always consists of measuring the same individual twice.b. In a paired design, each pair of observations often consists of measuring the same individual twice.c. In an independent groups
For the following scenarios, determine whether or not they represent paired designs.a. Reaction times for students taken at 8:00 a.m. compared to reaction times for the same students taken at 10:00 p.m.b. Change in weight for those on the Atkins diet compared to the change in weight for those on
Which of the following statements are true and which are false?a. After you collect the data, you can then decide whether or not to use a paired design or independent samples design.b. The simulations for paired design and independent groups design are the same. Just how the data are collected is
Provide a short paragraph (three- or four-sentence) summary of your findings. Make sure to include limitations of the study design. Also indicate at least one possible follow-up study that you now want to conduct.
Now, use the Theory-Based Inference applet to generate a test statistic, p-value, and confidence interval. Report these, and compare them to what you determined from the simulation analysis. Explain how they are similar or different in light of your answer to #14.
Explain whether a theoretical approach to computing the p-value and confidence interval would be valid for these data.
What broader population are you willing to generalize your findings to, if any? Explain.
If the evidence against the null were strong, would you be justified in concluding that you have found strong evidence of a cause-and-effect relationship between recognizable groupings and better memory performance for this study? Why?
Interpret the 95% confidence interval you obtained in #10.
Use the 2SD rule to generate a 95% confidence interval on the long-run difference in means between the two groups.
Conduct a simulation analysis with 1000 shuffles. Indicate how to determine the approximate p-value from the simulation results and report that p-value.
Report the following:Mean number of letters memorized in recognizable groups________SD of number of letters memorized in recognizable groups________Mean number of letters memorized when not in recognizable groups________SD of number of letters memorized when not in recognizable
Give a conclusion about the strength of evidence against the null, in context, based on the p-value you obtained in #8.
State the null and alternative hypotheses to be investigated with this study. (You can use the symbol μ to represent these parameters if you want.)
Is there an explanatory/response relationship for these variables? Classify the variable in this study as categorical or quantitative.Can people better memorize letters if they are presented in recognizable groupings than if they are not? Students in an introductory statistics class were the
What variables are measured/recorded on each observational unit?Can people better memorize letters if they are presented in recognizable groupings than if they are not? Students in an introductory statistics class were the subjects in a study that investigated this question. These students were
What are the observational units?Can people better memorize letters if they are presented in recognizable groupings than if they are not? Students in an introductory statistics class were the subjects in a study that investigated this question. These students were given a sequence of 30 letters to
Is this a randomized experiment or an observational study? Explain how you know.Can people better memorize letters if they are presented in recognizable groupings than if they are not? Students in an introductory statistics class were the subjects in a study that investigated this question. These
State the research question.Can people better memorize letters if they are presented in recognizable groupings than if they are not? Students in an introductory statistics class were the subjects in a study that investigated this question. These students were given a sequence of 30 letters to
Suppose that a professional baseball fan wants to investigate whether teams in one league (National or American) tend to score more runs on average than teams in the other league. The fan waits until the end of the season, records the number of runs scored by all 30 teams, and classifies the teams
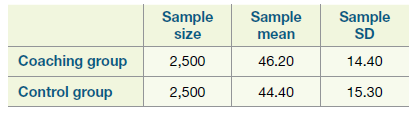
Suppose that 5,000 students are randomly assigned to either take an SAT coaching course or not, with the following results in their improvements in SAT scores:a. Use technology to conduct a test of whether the sample data provide evidence that SAT coaching is helpful. State the hypotheses and
a. Explain the difference between a two-sample test and a two-sided test.b. Is it legitimate to use a one-sided test with a two-sample test? If so, give an example. If not, why not?c. Is it legitimate to use a two-sided test with a one-sample test? If so, give an example. If not, why not?
Reconsider the previous question.a. State the appropriate null and alternative hypotheses for testing whether Grisham tends to use shorter sentences for his books aimed at teenage readers than in his books aimed at a general audience.b. Calculate the sample mean and SD of the sentence lengths for
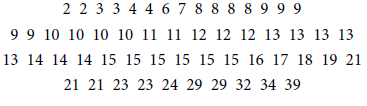
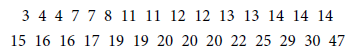
A student investigated whether popular novelist John Grisham uses shorter sentences in his books aimed at teenage readers than in his more general books. She took a sample of sentences from two of his books: The Confession, aimed at general readers, and Theodore Boone: Kid Lawyer, aimed at teenage
Reconsider the previous three exercises.a. Determine a 95% confidence interval for the difference in mean elasticity (as measured by distance dime is projected) between treated and untreated balsa wood. Use the theory-based approach to find the interval. Be sure to also include an interpretation of
Reconsider the previous two exercises.a. Use a theory-based method to determine the test statistic and p-value.b. Investigate and comment on whether the validity conditions of the theory-based method are satisfied.c. Does the p-value obtained using the simulation-based method agree with that
Reconsider the previous exercise.a. Give detailed, step-by-step instructions on how one could conduct a tactile simulation to generate a p-value to test the hypotheses stated in part (c). Be sure to include details n the following:• Would the simulation involve coins, dice, or index
Student researchers investigated whether balsa wood is less elastic aft er it has been immersed in water. They took 44 pieces of balsa wood and randomly assigned half to be immersed in water and the other half not to be. They measured the elasticity by seeing how far (in inches) the piece of wood
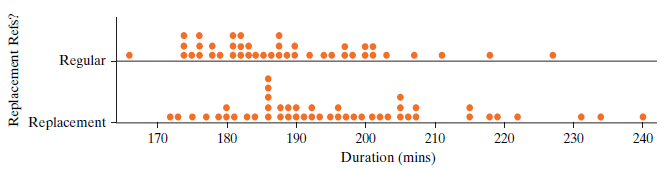
Recall from Exercise P.2.5 the data on duration of NFL football games in 2012 for the first three weeks of the season, when replacement referees officiated the games, and for the next three weeks when the regular referees returned to officiate the games. Dotplots of these data are reproduced in the
Suppose that a random sample of teenage boys and girls are asked how many Harry Potter books they have read. You conduct a two-sided test of the null hypothesis that μgirls − μboys = 0 and you also calculate a 95% confidence interval for μgirls − μboys.a. Describe (in words)
Data were gathered on 98 female college students and 81 male college students to see on average which sex was more flexible after participating in a physical wellness class and are available in the file Flexibility Post.a. State the research question.b. How is the study designed: observational
Read FAQ 6.3.1 and answer the following question: Explain how the validity conditions of ‘at least 20 in each group’ and ‘not strong skewness’ are not to be implemented as precise rules to follow in practice.
Reconsider the previous exercises.a. If the sample responses had shown more variability in each group (say, SD of 2 in each group) and all else had remained the same as originally, what impact would you expect this to have on the test statistic, p-value, and confidence interval?b. Make this change
As part of a survey of statistics students, they were asked if they had ever been in a car crash while they were driving and how many minutes of exercise they had on the previous day. The data file CarCrashExercise.txt has these results. Copy and paste this data set into the Descriptive Statistics
Reconsider the previous exercises.a. If the waitress had used larger sample sizes (say, 40 in each group) and the sample means and SDs had turned out the same as they did in the study originally, what impact would you expect this to have on the test statistic, p-value, and confidence interval?b.
Reconsider the previous two exercises about haircut prices. Th e sample mean prices were $21.85 for males and $54.05 for females, a difference of $32.20. Which are appropriate interpretations of the p-value of 0.0022? (Circle all that apply.)A. There’s a 0.22% chance that women in the population
Reconsider the previous exercise about haircut prices. The p-value for the appropriate test turns out to be 0.0022. What would you conclude? (Circle all that apply.)A. The sample data provide strong evidence that females in the population paid more on average than males for their most recent
Reconsider the bicycle commuting time study (Example 6.2) and the sleep deprivation study (Exploration 6.2).a. In what primary way do these studies diff er from the dolphin therapy and yawning studies from Chapter 5?b. Are both of these studies (sleep deprivation and bicycle commuting time)
In a survey of introductory statistics students, an instructor asked her students to report how many hours they spent studying in a typical week during the last term and their sex. Suppose that the intent is to compare reported study habits of male students to those of female students.a. Is this an
Reconsider the previous two exercises.a. If you change the confidence level to 98%, what impact would you expect this to have on the midpoint and width of the confi dence interval?b. Make this change, from part (a), and report the new confidence interval. Was the impact what you expected?Data from
Reconsider the previous exercise about the study of whether there is an association between number of Facebook friends and a person’s sex.a. Use the information available in the previous exercise to find a standardized statistic to test whether the average number of Facebook friends men have is
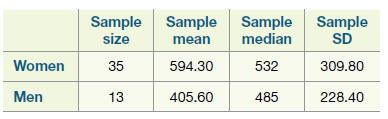
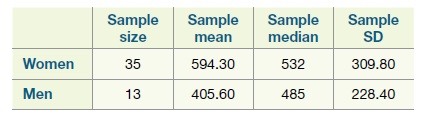
In a survey of introductory statistics students, an instructor asked her students to report how many Facebook friends they had. Suppose that the intent is to study whether there is an association between number of Facebook friends and a person€™s sex.a. Identify whether the study is an
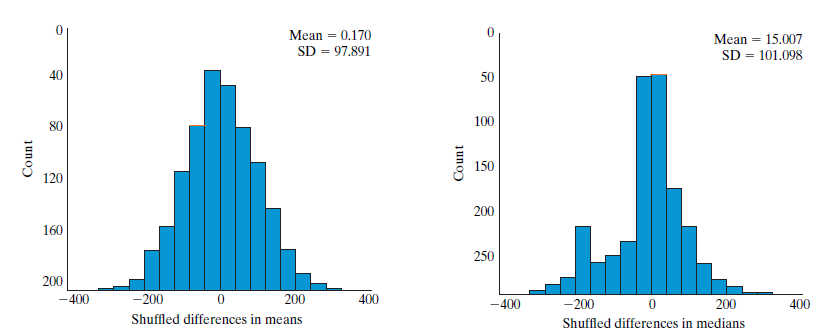
Reconsider the previous exercises about the study of whether there is an association between number of Facebook friends and a person’s sex. The p-value for the randomization-based test of whether the average number of Facebook friends men have is different from that of women turns out to be
Reconsider the previous exercises about the study of whether there is an association between number of Facebook friends and a person’s sex.a. Use the 2SD method and the information available in the previous exercises to find a 95% confidence interval for the difference in average number of
Reconsider the previous exercises about the study of whether there is an association between number of Facebook friends and a person€™s sex. The following is output from carrying out the randomization test using the Multiple Means applet.Recall that the summary statistics about the data
Showing 900 - 1000
of 2042
First
3
4
5
6
7
8
9
10
11
12
13
14
15
16
17
Last
Step by Step Answers