New Semester
Started
Get
50% OFF
Study Help!
--h --m --s
Claim Now
Question Answers
Textbooks
Find textbooks, questions and answers
Oops, something went wrong!
Change your search query and then try again
S
Books
FREE
Study Help
Expert Questions
Accounting
General Management
Mathematics
Finance
Organizational Behaviour
Law
Physics
Operating System
Management Leadership
Sociology
Programming
Marketing
Database
Computer Network
Economics
Textbooks Solutions
Accounting
Managerial Accounting
Management Leadership
Cost Accounting
Statistics
Business Law
Corporate Finance
Finance
Economics
Auditing
Tutors
Online Tutors
Find a Tutor
Hire a Tutor
Become a Tutor
AI Tutor
AI Study Planner
NEW
Sell Books
Search
Search
Sign In
Register
study help
mathematics
introduction to business statistics
Introduction To Statistical Investigations 1st Edition Beth L.Chance, George W.Cobb, Allan J.Rossman Nathan Tintle, Todd Swanson Soma Roy - Solutions
Match each scatterplot with its verbal description (a)€“(c). You may need to use some descriptions more than once, and others may not be needed.a. No big outliers, no influential points; strong linear relationshipb. No big outliers, no influential points; not convincing evidence of a
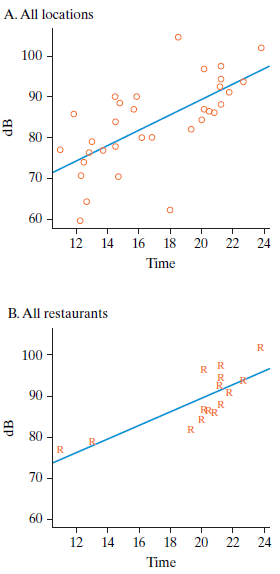
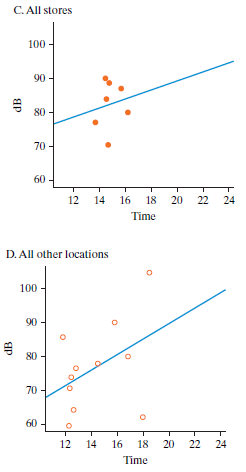
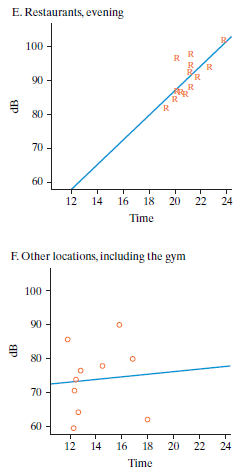
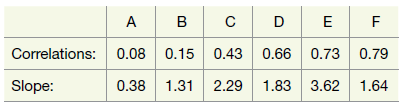
Match each scatterplot with its correlation and regression slope, choosing from A€“F: A BCDE 0.66 0.73 0.79 в Correlations: 0.08 0.15 0.43 0.38 1.31 2.29 Slope: 1.83 3.62 1.64
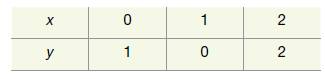
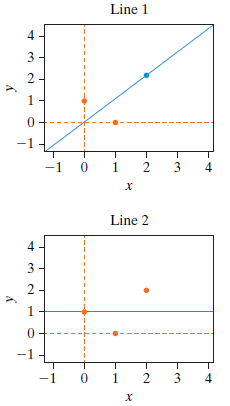
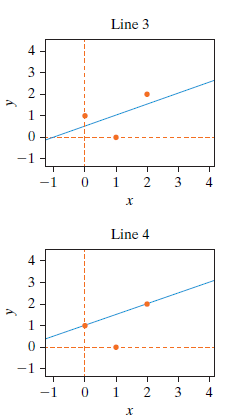
Consider a miniature data set:Four copies of the scatterplot are shown below, each with a fitted line. Find the residuals for each line and the sum of squares. Match the sum of squared residuals to the plots, choosing from 3/2, 2, 2, and 9/4. х 2 y 2. 2. Line 1 -1 -1 0 1 3 х Line 2 4 -1 3 4 х
Does having a professor show up late for class influence students to be late for class? Or when professors are early, do students tend to show up early? In the spring of 2008, some statistics students randomly chose 31 different classes and recorded how many minutes a professor was early or late
While a high school student in Texas, Andrea Axtell conducted a project in which she investigated how well blindfolded students can walk in a straight line. She recruited 30 subjects by randomly selecting students at her school. She put the subjects on the center hash mark of a football field’s
Repeat the previous exercise, replacing distance with elevation gain as the explanatory variable. The data on hiking time (in minutes) and elevation gain (in feet) can be found in the data file HikeElevations.Data from previous exercisea. Conduct a t-test to determine whether the data provide
Reconsider the data on day hikes in San Luis Obispo County from Exercises 10.3.21–10.3.23. The data on hiking time (in minutes) and distance (in miles) can be found in the data file HikeDistances.a. Conduct a t-test to determine whether the data provide strong evidence of a positive association
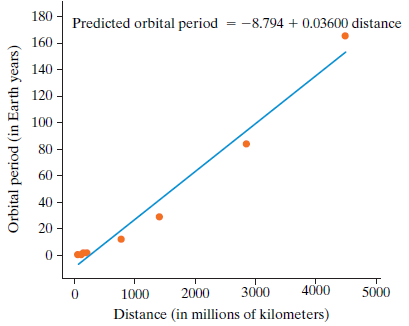
Reconsider the previous exercise. The accompanying graph displays the same data, with the least squares line superimposed:Would you feel comfortable using this line to make predictions? Explain. 180 Predicted orbital period = -8.794 + 0.03600 distance 160 - 140 - 120 100 80 - 60 40 20 - 4000 5000
Reconsider the previous two exercises and the data in TestTimes.a. Conduct a t-test of whether the slope coefficient differs significantly from zero. Report the value of the test statistic and p-value.b. Produce a 95% confidence interval for the population slope coefficient.c. Interpret this
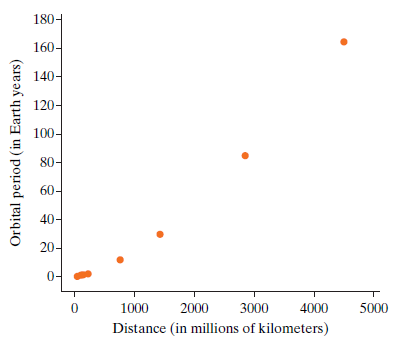
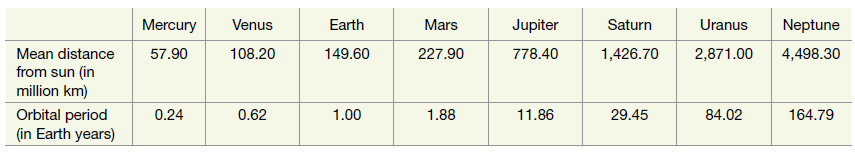
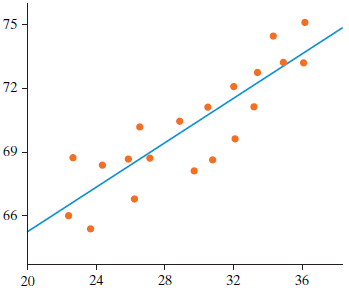
The following data shown in the table on the eight planets in our solar system were obtained from Wikipedia:a. Describe the association between these variables as described in the graph on the scatterplot below. Comment on direction, strength, and form of the association.b. The correlation
Reconsider the previous exercise and the data in TestTimes.a. Report the equation of the least squares line for reporting test score from time to take the test.b. Interpret the value of the slope coefficient.c. Interpret the value of the intercept coefficient. Does this make sense in this
The data file TestTimes contains data on the time (in minutes) taken by 33 students to complete a multiple choice exam and the students’ scores (as a percentage out of 100) on the exam. Investigate whether the data provide evidence of an association between the time to take the test and the score
Suppose that you record the following information about 15 Major League Baseball games played next Saturday:A. Total number of runs scored in the gameB. Whether or not the home team wins the gameC. Time (in minutes) required to play the gameD. Attendance (number of people) at the gameE. Whether the
Is there an association between a teacher’s age and how far he or she lives from school? For each of the following descriptions, draw a scatterplot of hypothetical data for a sample of 10 teachers that reveal what’s described. (Be sure to label and put a reasonable scale on both axes.)a. No
a. When calculating a correlation coefficient between two quantitative variables, does it matter which is considered explanatory and which response?b. When calculating a least squares line between two quantitative variables, does it matter which is considered explanatory and which response?c. When
a. Suppose that every student in your class scores 10 points higher on the final exam than on the midterm exam. What would the value of the correlation coefficient between the two exam scores equal? Explain.b. Suppose that every student in your class scores 10 points lower on the final exam than on
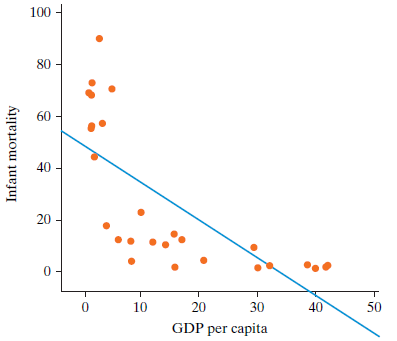
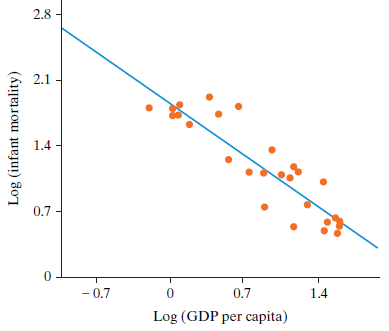
The accompanying scatterplot gives data from a random sample of 27 countries where the response variable is infant mortality (deaths per 1,000 live births) and the explanatory variable is the gross domestic product (GDP) per capita (in thousands of dollars). The gross domestic product per capita is
The data in the fi le GestationLifeExpectancy gives the gestation period (in days) and the life expectancy (in years) for a sample of mammals. We will consider this sample to be representative of all mammals for these two variables. Consider conducting an analysis to test whether the sample data
Reconsider the previous exercise on height and BMI.a. Determine a 95% confidence interval for the population slope coefficient and interpret what this interval represents.b. Based on your confidence interval, is there an association between height and BMI? Explain.Data from previous exerciseThe
The data in the file HeightBMI was obtained from a survey of statistics students. The variables recorded are the student’s heights (in inches) and their body mass index (BMI). Consider conducting an analysis to test whether the sample data provide strong evidence of an association between height
Two Cal Poly freshmen gathered data on a random sample of textbooks from the campus bookstore in November of 2006. Two of the variables recorded were the price of the book and the number of pages that it contained. These data are in the fi le TextbookPrices.a. Describe the population slope in the
Reconsider the previous exercise on Used Honda Civics.a. Determine a 95% confidence interval for the population slope coefficient and interpret what this interval represents.b. Based on your confidence interval, is there a negative association between age and price for used Honda Civics?
The data in the file UsedHondaCivics come from a sample of used Honda Civics listed for sale online in July 2006. Th e variables recorded are the car’s age (calculated as 2006 minus year of manufacture) and price. Consider conducting an analysis to test whether the sample data provide strong
Reconsider the previous exercise on age and BMI.a. Determine a 95% confidence interval for the population slope and interpret what this interval represents.b. Based on your confidence interval, is there strong evidence for a positive association between age and BMI? Explain.c. Based on a one-sided
Researchers in a clinical study collected information from their subjects at the beginning of the study. Two of the variables were body mass index (BMI) and age. We are interested in seeing if there is an association between these two variables. Th e data from the study can be found in the file
At the beginning of the semester, students in a statistics class were asked to give their estimates of how much their professor weighed (in pounds) and his height (in inches). We want to see if students who give large estimates for height will they also give large estimates for weight. In other
Reconsider the previous exercise on BMI and blood glucose levels.a. Determine a 95% confidence interval for the population slope coefficient and interpret what this interval represents.b. Based on your confidence interval, is there a positive association between BMI and blood glucose levels?
In a study to see if there was an association between weight loss and the amount of a certain protein in a person’s body fat, the researchers measured a number of different attributes in their 39 subjects at the beginning of the study. The article reported, “These subjects were clinically and
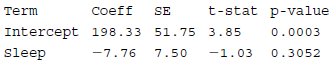
A regression table is shown based on data used to test an association between the amount of sleep someone had the previous night (in hours) and the time needed to complete a paper and pencil maze (in seconds). Sleep is the explanatory variable and time needed to complete the maze is the response.a.
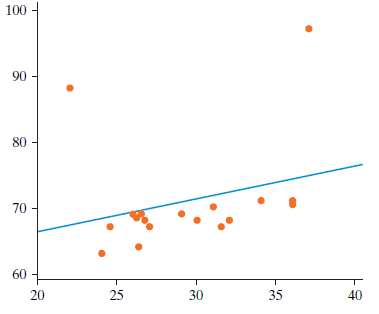
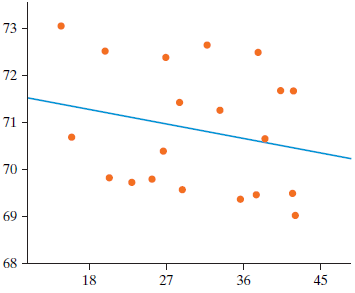
For the data in each of the following scatterplots, are the validity conditions met to run a theory-based test for regression? If the answer is no on any of them, explain why not.a.b.c.d. 100 90 80 70 60 + 40 35 25 20 73 - 72 - 71 70 69 68 18 27 36 45
If there are influential points or outliers in your data, why is it a good idea to run the analysis with those points removed?
To explore the relationship between the runtime and profit made by movies, data were collected on a random sample of 15 movies released in the last four years. The p-value corresponding to the two-sided test for the slope turned out to be 0.06.a. Based on the p-value, is it okay to conclude that
The theory-based p-value given in the regression table in the Corr/Regression applet is:A. A two-sided p-valueB. A one-sided p-valueC. Either a one-sided or two-sided p-value depending on how you count your samples (greater than, less than, or beyond) in the simulation part of the appletD. A
For a given data set, a test of association based on a slope is equivalent to a test of association based on a correlation coefficient. Being equivalent means which of the following is true?A. The confidence intervals for the population correlation and population slope will be the same.B. The
Which one of the following is a validity condition for theory-based tests for regression?A. The variability of the points around the regression line should not diff er as you slide along the x-axis.B. There should be at least 10 successes and 10 failures in the data.C. The variability of the
Read FAQ 10.4.1 and answer the following questions.a. What is the name of the point (x̅, y̅)?b. Why does every shuffled regression line go through the point (x̅, y̅)?
Use the data set HandSpan to calculate means, standard deviations, and the correlation coefficient.Is hand span a good predictor of how much candy you can grab? Using 45 college students as subjects, researchers set out to explore whether a linear relationship exists between hand span (cm) and the
Reconsider the previous exercise on the Stroop effect.a. There was one point in the scatterplot that was a clear outlier. One of the researcher’s great aunt, who was 87 years old, took 100.60 seconds to complete the task. This was almost three times as long as the next longest time. Remove that
You may have seen the test or puzzle where names of colors are written out in colors not denoted by the name. For example the word green might be written with red ink. The job of the person completing the test is to say the word and not the color. Th is interference in the reaction time of saying
In a survey of Hope College students, two of the questions asked were their current grade point average (GPA) and how much sleep they got (in hours) on the previous school night. The data can be found in the file Sleep- GPA. Let’s explore whether or not there is evidence of a strong
In a survey of statistics students at Hope College, two of the questions asked were their current grade point average (GPA) and how many classes they failed to attend during the past three weeks at the college. The data can be found in the file MissClassGPA. Let’s explore whether or not there is
Reconsider the previous exercise on age and BMI. We are interested in seeing if there is an association between BMI and age. Th e data from the study can be found in the file Age BMI.a. Conduct a new simulation analysis with 1,000 repetitions using slope as the statistic. What is your p-value?b.
Researchers in a clinical study collected information from their subjects at the beginning of the study. Two of the variables were body mass index (BMI) and age. We are interested in seeing if there is an association between BMI and age. Th e data from the study can be found in the file AgeBMI.a.
Reconsider the previous exercise on height and haircut price.a. Find the regression equation that predicts the haircut price based on height.b. Interpret the slope and intercept of the regression line.Data from previous exerciseIn a survey of statistics students at Hope College, two of the
This question is based on the 50 U.S. states. Each state is an observational unit, and the variables listed are measured separately for each of the 50 states. For each of the following pairs of variables, would you expect the correlation to be strong and positive, moderate and positive, weak or
What are the observational/experimental units?Is hand span a good predictor of how much candy you can grab? Using 45 college students as subjects, researchers set out to explore whether a linear relationship exists between hand span (cm) and the number of Tootsie Rolls* each subject could grab.
Is this a randomized experiment or an observational study? Explain how you know.Is hand span a good predictor of how much candy you can grab? Using 45 college students as subjects, researchers set out to explore whether a linear relationship exists between hand span (cm) and the number of Tootsie
State the two variables measured on each unit.Is hand span a good predictor of how much candy you can grab? Using 45 college students as subjects, researchers set out to explore whether a linear relationship exists between hand span (cm) and the number of Tootsie Rolls* each subject could grab.
Is there an explanatory/response relationship for these variables? Classify the variables in this study as categorical or quantitative.Is hand span a good predictor of how much candy you can grab? Using 45 college students as subjects, researchers set out to explore whether a linear relationship
State the null and alternative hypotheses to be investigated with this study.Is hand span a good predictor of how much candy you can grab? Using 45 college students as subjects, researchers set out to explore whether a linear relationship exists between hand span (cm) and the number of Tootsie
Use the data set HandSpan to calculate means, standard deviations, and the correlation coefficient.Is hand span a good predictor of how much candy you can grab? Using 45 college students as subjects, researchers set out to explore whether a linear relationship exists between hand span (cm) and the
Create a scatterplot of the data with hand span on the x-axis and number of Tootsie Rolls on the y-axis.Is hand span a good predictor of how much candy you can grab? Using 45 college students as subjects, researchers set out to explore whether a linear relationship exists between hand span (cm) and
Does there appear to be an association between hand span and number of Tootsie Rolls? Describe the direction, form, and strength of the association: Is it positive, negative, weak, strong, linear?Is hand span a good predictor of how much candy you can grab? Using 45 college students as subjects,
Are there any unusual observations?Is hand span a good predictor of how much candy you can grab? Using 45 college students as subjects, researchers set out to explore whether a linear relationship exists between hand span (cm) and the number of Tootsie Rolls* each subject could grab.
Find the least squares regression equation that predicts number of Tootsie Rolls based on hand span.Is hand span a good predictor of how much candy you can grab? Using 45 college students as subjects, researchers set out to explore whether a linear relationship exists between hand span (cm) and the
Interpret the slope of the least squares regression equation in terms of hand span and predicted number of Tootsie Rolls grabbed.Is hand span a good predictor of how much candy you can grab? Using 45 college students as subjects, researchers set out to explore whether a linear relationship exists
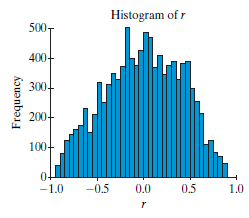
Use the appropriate applet to construct a simulated null distribution using the slope of the least squares regression line as the statistic. Mark the observed least squares slope on this graph.a. Paste a screenshot or draw your null distribution below with the observed slope marked and the
Are the validity conditions met to complete a theory-based t-test on these data? Explain. Whether the conditions are met or not, use a theory-based t-test to find a p-value. How does this p-value compare to the p-value your found using the randomization method?Is hand span a good predictor of how
Find a confidence interval for the slope that would describe the association between all hand spans and number of Tootsie Rolls grabbed. Is zero in this interval? Does this make sense based on the p-value from your test of significance?Is hand span a good predictor of how much candy you can grab?
Are you able to conclude that the association between hand span and number of Tootsie Rolls grabbed is causal? Explain.Is hand span a good predictor of how much candy you can grab? Using 45 college students as subjects, researchers set out to explore whether a linear relationship exists between
What generalizations are you willing to make? Explain.Is hand span a good predictor of how much candy you can grab? Using 45 college students as subjects, researchers set out to explore whether a linear relationship exists between hand span (cm) and the number of Tootsie Rolls* each subject could
Summarize the findings from the study. What worked well in this study design? What would you change? What are some follow-up research questions you would like to explore based on the findings from this study?Is hand span a good predictor of how much candy you can grab? Using 45 college students as
Is there an explanatory/response relationship for these variables? Classify the variables in this study as categorical or quantitative.Researchers from the University of California, Berkeley wondered whether upper-class individuals behave more unethically than lower-class individuals. To further
State the two variables measured on each unit.Researchers from the University of California, Berkeley wondered whether upper-class individuals behave more unethically than lower-class individuals. To further investigate this question, they studied behaviors of drivers in different makes and models
Is this a randomized experiment or an observational study? Explain how you know.Researchers from the University of California, Berkeley wondered whether upper-class individuals behave more unethically than lower-class individuals. To further investigate this question, they studied behaviors of
What are the observational/experimental units?Researchers from the University of California, Berkeley wondered whether upper-class individuals behave more unethically than lower-class individuals. To further investigate this question, they studied behaviors of drivers in different makes and models
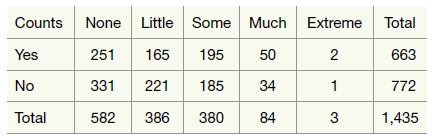
The study used for exercises in Sections 8.1 and 8.2 actually included a fifth degree of baldness, extreme. Here is a table that summarizes the full data set:What stands out about the new category is the tiny sample size: only three patients with extreme baldness. This exercise explores what can
Reconsider the previous exercise. In the article that appeared in the Journal of Behavioral Decision Making, the researchers did not report the sample size of each group. The following 2 × 2 table gives a set of observed counts that are consistent with the rest of the study data. This
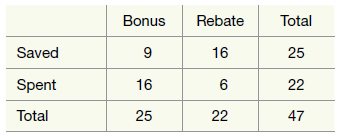
Do people tend to spend money differently based on perceived changes in wealth? In a study conducted by researchers Epley et al. (2006), 47 Harvard undergraduates were randomly assigned to receive either a bonus check of $50 or a rebate check of $50. A week later, each student was contacted and
Recall the previous exercises about social norms. Data were also collected on whether the experimenter was walking at a slow speed or was walking at a fast speed and are given in the data fi le SocialNormsSpeed. Is there an association between whether you collide with oncoming pedestrians and your
Recall the previous exercise about social norms. Data were also collected in a hallway inside a building and on a sidewalk outside in a park and are given in the data fi le SocialNormsLocation. Is there an association between whether you collide with oncoming pedestrians and location?a. State the
What happens when you break social norms? Pedestrians walking on sidewalks typically follow the same traffic patterns as cars driving in the streets. What happens if you walk on the wrong side of the sidewalk? Do sex, location, and speed of walker affect the number of people in the oncoming traffic
Reconsider the previous exercise. Carry out a theory-based test to investigate whether the sample data provide strong evidence of an association between the sex and goals of fourth to sixth graders. Follow up, if applicable, with confidence intervals for any differences you may find. Be sure to
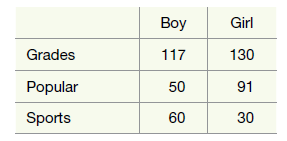
Students (grades 4€“6) in the Lansing, Michigan, area were asked, €œWhat is the most important goal in school: getting good grades, being popular, or excelling in sports.€ The data are tabled below. (The raw data is in the Goals file.)a. What proportion of boys
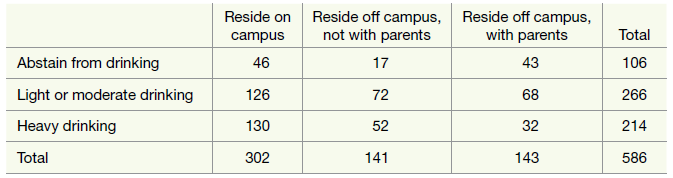
A study of drinking habits of college students at a particular college produced the two-way table of counts shown in the following table table .Analyze these data with appropriate descriptive and inferential methods. Write a short report summarizing and justifying your conclusions. Reside on campus
Reconsider the previous exercise. Conduct a theory-based analysis. Report the test statistic and p-value and summarize your conclusions. Also, compute 95% confidence intervals as a follow up, including these in your summary.Data from previous exerciseThe 2010 General Social Survey asked a random
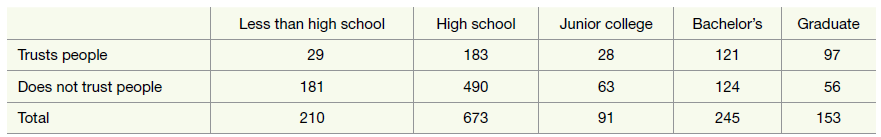
The 2010 General Social Survey asked a random sample of Americans about whether they generally trust people. The following table classifies responses by the highest educational degree achieved by the person:a. Identify the explanatory and response variables in this study.b. For each category of
Reconsider the data from the previous two exercises. Use what you learned in the first three chapters to address the following questions. Provide a complete analysis and summary of conclusions for both questions.a. Do the sample data provide convincing evidence that more than 10% of adult Americans
Reconsider the previous exercise. Conduct a theory-based analysis, including a check of validity conditions, and summarize your conclusion.
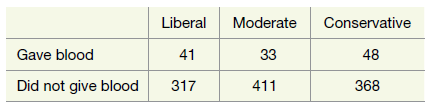
The General Social Survey asked a random sample of adult Americans about their political viewpoint and also about whether they had given blood in the previous year.The sample results for the 2012 survey are organized in the following two-way table of counts:a. For each political viewpoint,
Reconsider the data from the previous two exercises. Suppose that the sample size had been twice as large, with the counts for every cell in the table also being twice as large.a. What effect would this change have on the segmented bar graph?b. What effect would this change have on the p-value? (Do
Reconsider the data from the previous exercise. Check whether the validity conditions for a theory-based analysis are met. Regardless of your answer, conduct such a theory-based analysis. Report the test statistic and p-value. Summarize your conclusions.
Suppose that you want to investigate whether men and women differ with regard to coffee consumption. You plan to ask people to indicate their sex and also to say whether they drink coffee every day, sometimes, or almost never.a. Identify the two variables in this study. Also classify each variable
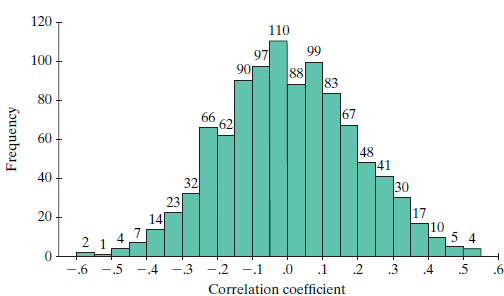
Read FAQ 8.2.1 and answer the following: True or false? When comparing many groups on a categorical response, the choice of statistic (p̂max – p̂min, MAD, and chi-square) has no bearing on the power of the test.
Read FAQ 8.2.1 and answer the following: True or false? When using a theory-based test to analyze data from 2 × 2 tables, the choice of statistic (p̂max – p̂min, MAD, and chi-square) doesn’t matter.
Read FAQ 8.2.1 and answer the following: True or false? When comparing more than two groups on a categorical response, the choice of statistic (p̂max – p̂min, MAD, and chi-square) doesn’t matter.
Read FAQ 8.2.1 and answer the following: True or false? When analyzing data from 2 × 2 tables, the choice of statistic (p̂max – p̂min, MAD, and chi-square) doesn’t matter.
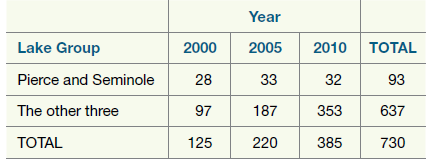
Referring to the previous exercise, what can you say about cause and effect and generalization based on the gator data?Data from previous exerciseAs we hope you agree, there seem to be two kinds of lakes. Two (Pierce and Seminole) have small harvests that don€™t show a time trend. Th e
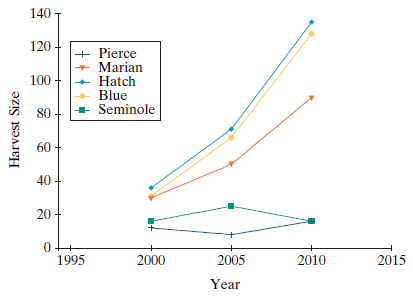
As we hope you agree, there seem to be two kinds of lakes. Two (Pierce and Seminole) have small harvests that don€™t show a time trend. Th e other three lakes have much bigger harvests that increase steeply (and similarly) over time. Use the Multiple Proportions applet to compare the two
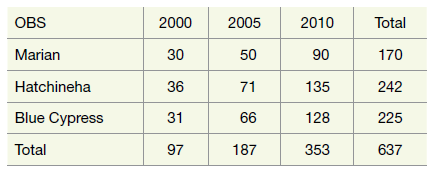
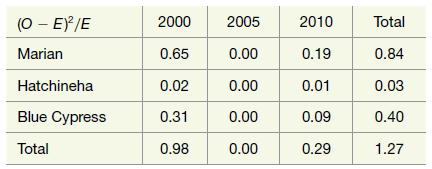
Referring to the previous exercises, the other three lakes have larger harvests that show steep increases over time:Here are values of (O ˆ’ E)2/E, the contribution to chi-square, for each cell.Based on these values, is it reasonable to regard the time trend for these three lakes as
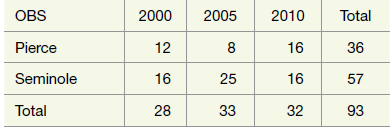
Referring to the previous exercises, lakes Pierce and Seminole have smaller harvests that show little or no evidence of a time trend.Is it reasonable to treat them as a group? Use the Multiple Proportions applet to compare the two lakes using segmented bar charts and to conduct an appropriate test
Referring to the previous exercises, sometimes a categorical variable comes from a quantitative variable. For the gator data, the year can be regarded as quantitative. Here€™s a plot that takes advantage of that quantitative underpinning. What do you see in this plot that was harder to
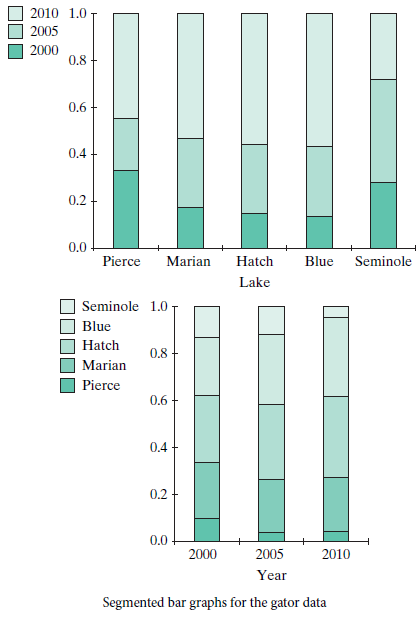
Referring to the previous exercises, If both variables are categorical, you have two choices for segmented bar graphs. Either one of the two variables can go on the x-axis, with percentages for the other on the y-axis. Here are both segmented bar graphs for the gator data. Tell what you learn from
Is random sampling or random assignment the more important consideration if the research question is whether Facebook users tend to have lower grade point averages than students who do not use Facebook?
Narrower confidence intervals are better than wider confidence intervals.a. What change to sample size produces a narrower confidence interval?b. What change to confidence level produces a narrower confidence interval?
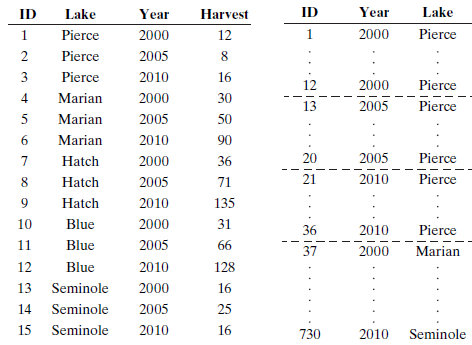
Referring to the previous exercise, two possible data tables are shown in the following table . Which one has the observational units right? Why?Data from previous exerciseAlligators have become a big concern in Florida. Here are some gator data.The rows are for five small Florida lakes. They
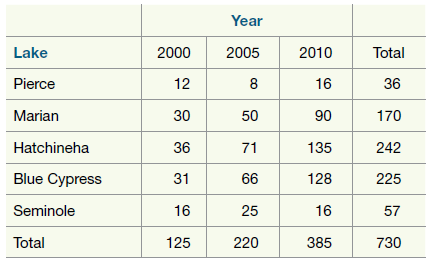
Alligators have become a big concern in Florida. Here are some gator data.The rows are for five small Florida lakes. They stretch along a line from the west coast near Tampa to the east coast. The columns are for years, spaced half a decade apart. The counts tell the numbers of alligators
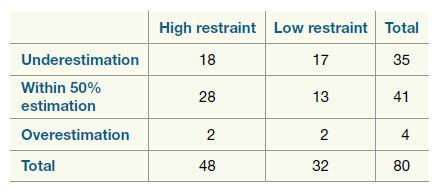
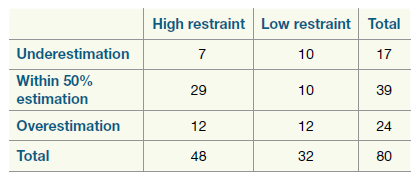
Refer to the previous exercise about the study of the relationship between dietary restraint and energy expenditure. Another response variable the researchers were interested in was the estimation of energy intake. After a session of exercising, each participant was given a meal and then asked how
How good are you at estimating how many calories you expend? Researchers Harris et al. (American Journal of Men€™s Health, 2010) conducted a study where 80 males (ages 21€“45 years) were first given a test to identify whether they had high or low dietary restraint. Dietary
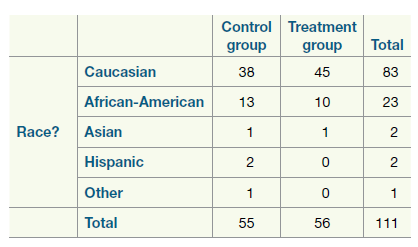
Often research articles include tables of comparisons for demographics of experimental groups. In one such article (Psycho-Oncology, 2006) reporting a study investigating the effect of art therapy on women diagnosed with cancer, researchers Monti et al. randomly assigned women to either the
Showing 500 - 600
of 2042
1
2
3
4
5
6
7
8
9
10
11
12
13
14
15
Last
Step by Step Answers