New Semester
Started
Get
50% OFF
Study Help!
--h --m --s
Claim Now
Question Answers
Textbooks
Find textbooks, questions and answers
Oops, something went wrong!
Change your search query and then try again
S
Books
FREE
Study Help
Expert Questions
Accounting
General Management
Mathematics
Finance
Organizational Behaviour
Law
Physics
Operating System
Management Leadership
Sociology
Programming
Marketing
Database
Computer Network
Economics
Textbooks Solutions
Accounting
Managerial Accounting
Management Leadership
Cost Accounting
Statistics
Business Law
Corporate Finance
Finance
Economics
Auditing
Tutors
Online Tutors
Find a Tutor
Hire a Tutor
Become a Tutor
AI Tutor
AI Study Planner
NEW
Sell Books
Search
Search
Sign In
Register
study help
mathematics
introduction to business statistics
Introduction To Statistical Investigations 1st Edition Beth L.Chance, George W.Cobb, Allan J.Rossman Nathan Tintle, Todd Swanson Soma Roy - Solutions
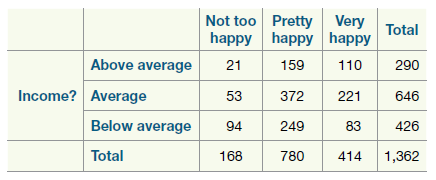
To investigate whether there is an association between happiness and income level, we will use data from the 2002 General Social Survey (GSS), cross-classifying a person€™s perceived happiness with their family income level. The GSS is a survey of randomly selected U.S. adults who are not
Researchers Gawin et al. (Journal of American Medical Association Psychiatry, 1989) reported a study where each of 72 cocaine abusers were randomly assigned to receive one of three treatments for six weeks: 24 subjects received the antidepressant drug desipramine hydrochloride, 24 subjects received
Design your own study: Develop the plan for the investigation of a research question that can be answered using a chi-square test.a. State the research question.b. Will you conduct an experiment or an observational study? How are you deciding? Also, describe how the randomization (random sampling,
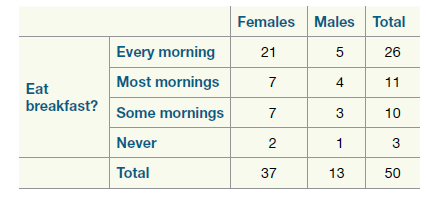
In a survey of 50 students in an introductory statistics students, data were collected on an individual€™s sex and breakfast eating habits. Here is a table of the summarized data:a. Is this an experiment or an observational study? How are you deciding?b. Identify the observational
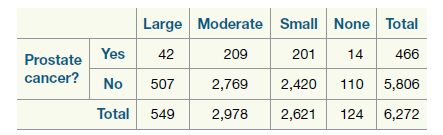
In an article published in Lancet (2001), researchers shared their findings from a study where they followed 6,272 Swedish men for 30 years to see whether there was an association between the amount of fish in the diet and likelihood of prostate cancer. The results are presented in the following
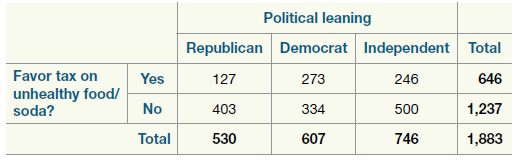
Given below is a table of summarized data from a 2013 study of a nationally representative sample of U.S. adults by the Gallup organization, where participants were asked about their political leaning as well as their opinionon whether there should be a tax on unhealthy food/soda. a. Is this
Refer to the previous exercise about the study of the relationship between level of physical activity and aging.Suppose that the observed cell counts were actually half as small as those reported in the original study.a. Without carrying out any extensive calculations, say whether the p-value would
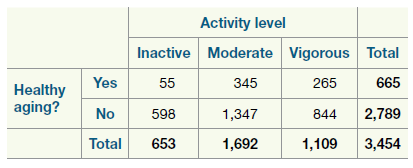
Refer to the previous exercise about the study of the relationship between level of physical activity and aging. Show how to calculate the chi-square statistic by setting up the formula with appropriate numbers.Data from previous exerciseAn eight-year cohort study of 3,454 initially disease-free
Refer to the previous exercise about the study of the relationship between level of physical activity and aging.a. Explain why it would be okay to use the theory-based method to find a p-value for this study.b. Use an appropriate applet (for example, the Multiple Proportions applet) to find and
An eight-year cohort study of 3,454 initially disease-free men and women (ages around 60 years or more) recorded the extent of physical activity the participants engaged in and whether or not they were showing signs of €œhealthy aging€ (British Journal of Sports Medicine,
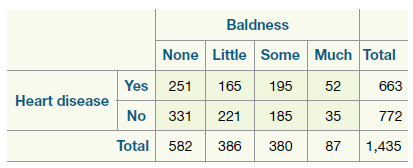
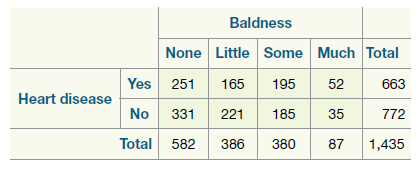
Refer to the previous exercise about the relationship between heart disease and baldness. The data are provided in the file HeartDiseaseAndBaldness.a. Compute the conditional proportions of heart disease given each degree of baldness.b. There are six pairwise differences. Which two are the largest?
Recall Exercise 8.1.15 about the relationship between heart disease and baldness. The data are provided in the file HeartDiseaseAndBaldness.a. Identify the observational units.b. Describe the parameter(s) of interest and assign appropriate symbol(s) to the parameter(s).c. State in words the
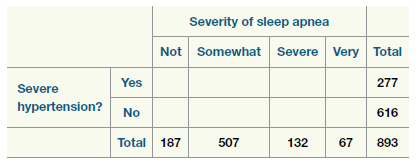
Refer to the previous exercise about the study of the relationship between sleep apnea and hypertension. Suppose that the observed cell counts were actually three times as big as those reported in the original study.For parts (a)€“(c): How, if at all, would the values of the following
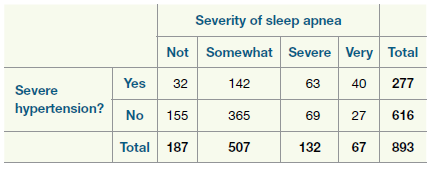
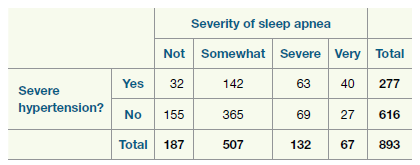
Refer to the previous exercise about the study of the relationship between sleep apnea and hypertension. Show how to calculate the chi-square statistic by setting up the formula with appropriate numbers.Data from previous exerciseIn a study of the relationship between sleep apnea and hypertension
Refer to the previous exercise about the study of the relationship between sleep apnea and hypertension.a. State the appropriate null and alternative hypotheses in words.b. Explain why it would be okay to use the theory-based method to find a p-value for this study.c. Use an appropriate applet (for
In a study of the relationship between sleep apnea and hypertension (New England Journal of Medicine, 2000), researchers Peppard et al. categorized the participants by the severity of sleep apnea at the beginning of the study, and four years later recorded whether or not the participant had
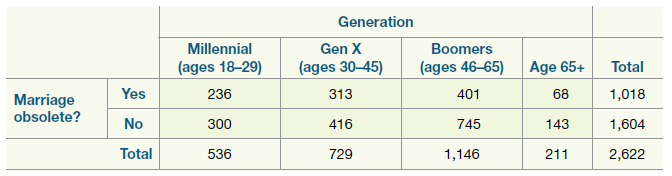
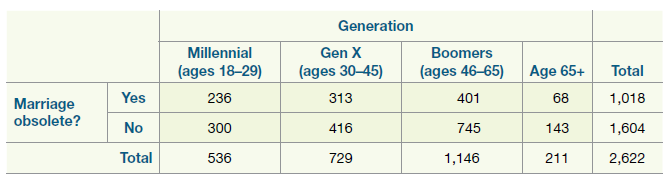
Recall Exercise 8.1.12 about whether different generations view marriage differently. The corresponding data are available in the file MarriageViews.a. State the appropriate null and alternative hypotheses in words.b. Explain why it would be okay to use the theory-based method to find a p-value for
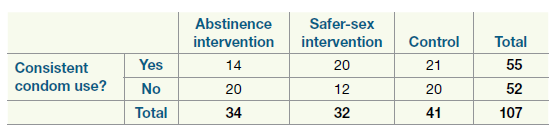
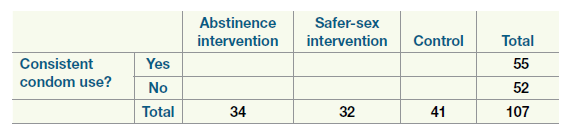
Refer to the previous exercise about the study of different HIV intervention programs. Suppose that the observed cell counts were actually twice as big as those reported in the original study. For parts (a)€“(c): How, if at all, would the values of the following change?a. The expected
Refer to the previous exercise about the study of different HIV intervention programs. Show how to calculate the chi-square statistic by setting up the formula with appropriate numbers.Data from previous exerciseResearchers Jemmott III et al. (Journal of American Medical Association, 1998) reported
Refer to the previous exercise about the study of different HIV intervention programs.a. State the appropriate null and alternative hypotheses in words.b. Explain why it would be okay to use the theory-based method to find a p-value for this study.c. Use an appropriate applet (for example, the
Researchers Jemmott III et al. (Journal of American Medical Association, 1998) reported a study in which a group of inner-city African American adolescents from Philadelphia were randomly divided into three groups as part of an experiment to assess the effectiveness of different HIV prevention
Consider the chi-square statistic.a. Can the value of this statistic be negative? Why or why not?b. When will the chi-square statistic be 0?c. Which of (A)–(C) describes the shape of the distribution of the chi-square statistic:A. SymmetricB. Skewed toward high values (long right tail)C. Skewed
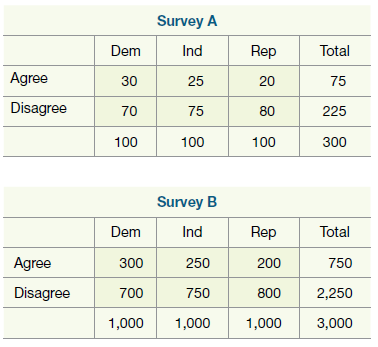
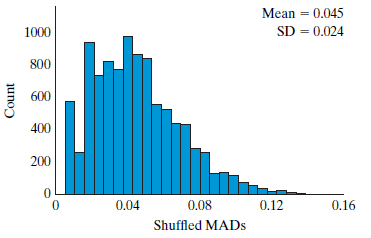
Suppose two surveys are done to see if Democrats, Independents, and Republicans differ on their agreement with a certain issue and the results are shown in the following two tables.a. Input the table for Survey A in the Multiple Proportions applet and report the MAD statistic.b. Do at least 1,000
Read FAQ 8.1.1 and then reconsider Exercise 8.1.12 about whether different generations view marriage differently.a. If you were to compare two generations at a time, how many separate comparisons would you need to make?b. Suppose that your chance of making a Type I error was 6% for each one of
Read FAQ 8.1.1 and then reconsider Exercise 8.1.29 based on Exploration 8.1, where you investigated whether there was evidence of an association between the type of default option and whether a person chooses to be an organ donor.a. What would be a danger of conducting three separate tests,
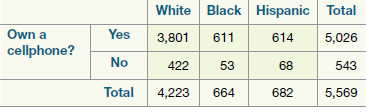
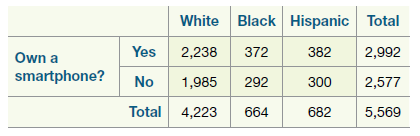
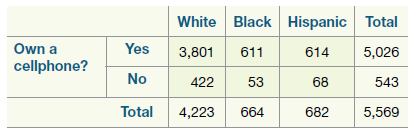
Reconsider Exercises 8.1.23 and 8.1.25 on cellphone and smartphone ownership. We considered our population to be that of all adults in the U.S. Now suppose we want the population to be all the cellphone users in the U.S.a. Combine the results in the tables from these two exercises so you have a new
In a September 2013 poll conducted by the Pew Research Center, they asked a random sample of U.S. adults if they owned a smart phone. The results are shown in the following table by race.a. What proportion in each race category owns a smartphone?b. Does there seem to be an association between race
Reconsider the previous problem on cellphone use. Complete a test of significance to determine if there is an association between race and whether or not someone owns a cellphone using p̂max − p̂min as the statistic. Make sure you give the hypotheses, your p-value, and a conclusion.
In a September 2013 poll conducted by the Pew Research Center, they asked a random sample of U.S. adults if they owned a cellphone. The results are shown in the following table by race.a. What proportion in each race category owns a cellphone?b. Does there seem to be an association between race and
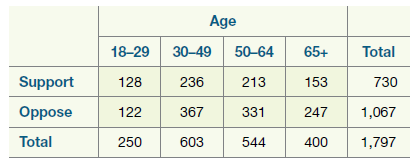
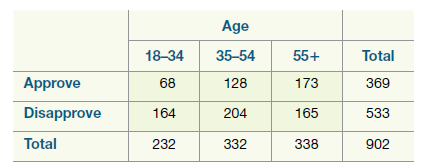
In a January 2014 Quinnipiac University poll the following question was asked to a random sample of U.S. voters: €œDo you support or oppose the health care law passed by Barack Obama and Congress in 2010?€ The results from the poll are shown in the following table by age
Reconsider the previous problem on approval of stop and frisk. Complete a test of significance to determine if there is an association between age category and whether or not someone approves or disapproves of the police practice known as stop and frisk using
In a February 2013 Quinnipiac University poll the following question about a typical practice of the New York Police Department was asked to a random sample of New York City voters: €œAs you may know, there is a police practice known as €˜stop and frisk€™, where police
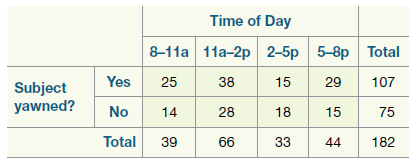
Reconsider the previous exercise about contagious yawning and time of day. Th e results of this test are not significant. If this study were redone, what suggestions do you have that would help make the results significant?Data from previous exerciseStudent researchers wanted to see if it there was
Student researchers wanted to see if it there was an association between the time of day and whether or not someone would yawn right aft er seeing another person yawn. To gather their data, they walked around campus at various times of day yawning at people and watched to see if the subjects
Researchers at the University of Pennsylvania studied the humor of late-night comedians Jon Stewart, Jay Leno, and David Letterman. Between July 15 and September 16, 2004, they performed a content analysis of the jokes made by Jon Stewart during the €œheadlines€ segment of The
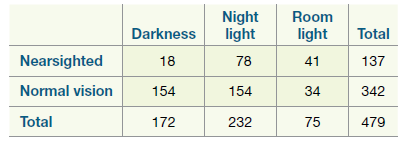
In Exploration 8.2B, we will look at a study that was done to determine if there is an association between the amount of light in infants€™ bedrooms at night (darkness, night light, room light) and whether or not the child was nearsighted when they were older. A summary of the data from
Many studies have been done to look at the relationship between heart disease and baldness. In one study, researchers selected a sample of 663 heart disease male patients and a control group of 772 male patients not suffering from heart disease from hospitals in eastern Massachusetts and Rhode
Reconsider the previous exercises. If the different generations did not view marriage differently what would you expect the cell counts in the 8.1.14 table to be? (That is, there is no association between the age groups and whether or not someone thinks marriage is obsolete.) Complete the
Reconsider the previous question on how different generations view marriage. The results are shown in thetable in the previous exercise and can also be found in the file MarriageViews.a. Identify the observational units.b. Identify the variables recorded. For each variable, identify the role
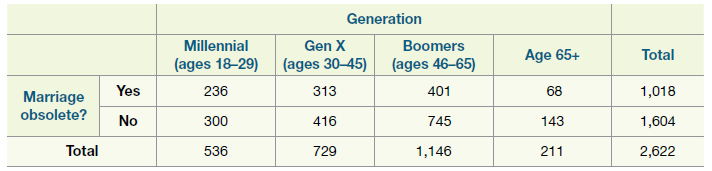
Do different generations view marriage differently? A 2010 survey of a random sample of adult Americans conducted by the Pew Research Center asked the following question of each participant: €œIs marriage becoming obsolete?€ Th e results from the survey are shown in the table
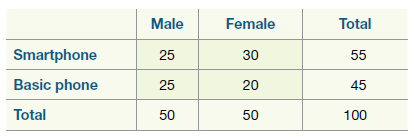
Suppose 100 students are asked if the cellphone they use is a smartphone or a basic phone and the 8.1.11 two-way table summarizes the results.a. Find the proportion of males that own smartphones and the proportion of females that own smartphones.b. Determine the MAD statistic.c. When comparing two
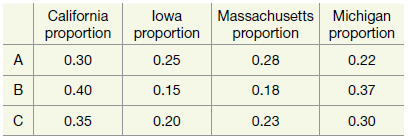
Suppose you want to compare proportions of adults who have donated blood within the past year among California, Iowa, Massachusetts, and Michigan residents. You take a random sample of 200 adults from each state.a. Which of the following sets of sample proportions (A, B, or C) would produce the
Suppose that you want to compare proportions of registered Democrats, Independents, and Republicans who have donated blood within the past year.a. Which would be appropriate for this study: random sampling, random assignment, both, or neither? Explain.b. If you find that the sample proportions who
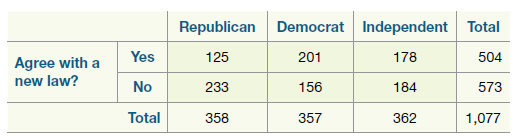
Suppose a poll is done to see if voters agree with a new law passed in Congress. The results are summarized in the 8.1.8 table along with the voters€™ party affiliation. You plan to test to see whether there is an association between party affiliation and agreement with the new law.a.
Consider the MAD statistic. What would happen if you did not take absolute values before calculating the sum of differences between group proportions? Why would this not be a useful calculation without taking absolute values?
Given the four sample proportions 0.66, 0.45, 0.73, and 0.44, determine the MAD statistic.
Given the three sample proportions 0.25, 0.30, and 0.35, determine the MAD statistic.
What has to be true about the observed proportions if the MAD statistic is zero?
Null distributions using the MAD statistic will be:A. Symmetric and centered at zero.B. Symmetric and centered at the MAD statistic.C. Skewed right.D. Skewed left
Is the sample large enough to use a theory-based test?As mentioned earlier, sand is used in the filter. Different filters had different amounts of sand.The students split the filters into two groups: those that had more than 2 inches of sand and those that had less. We will explore whether this
Identify the explanatory and response variables in this study. Classify the variables in this study as categorical or quantitative.As mentioned earlier, sand is used in the filter. Different filters had different amounts of sand.The students split the filters into two groups: those that had more
The “Reading the Mind in the Eyes Test” (RMET) measures the ability of a person to infer the mental state of another from looking at facial expressions. Researchers Domes et al. (Biological Psychiatry, 2007) conducted a study on the effect of oxytocin (a hormone oft en linked with bonding,
The Cholesterol Level data sets give cholesterol levels of heart attack patients. Cholesterol measures are taken 2, 4, and 14 days aft er a patient has suffered a heart attack. Is there a significant difference between day 4 cholesterol measures and day 14 cholesterol measures? Carry out a
The Cholesterol Level data sets give cholesterol levels of heart attack patients. Cholesterol measures are taken 2, 4, and 14 days aft er a patient has suffered a heart attack. Is there a significant difference between day 2 cholesterol measures and day 14 cholesterol measures? Carry out a
In June 2012, Time magazine ran an article titled “Do Family Dinners Really Reduce Teen Drug Use?” Answer the following questions in this context.a. Identify the observational units.b. Identify the explanatory and response variables.c. Identify a confounding variable that provides an
Based on a survey of almost 3,000 adults, researchers Wyatt et al. (Obesity Research, 2002) reported that those who ate breakfast regularly tended to be more successful at maintaining their weight loss.a. Identify the explanatory and response variables.b. Identify a confounding variable that
In a study published in Preventive Medicine (1991), researchers Stampfer and Colditz observed that women who underwent hormone replacement therapy (HRT) showed a lower risk of coronary heart disease (CHD).a. Identify the explanatory and response variables.b. Identify a confounding variable that
A Gallup poll conducted in December 2013 found that 74% of respondents who were 65 years or older owned a VCR compared to 41% of 18- to 29-year olds.a. Identify the explanatory variable.A. RespondentsB. Age groupC. Whether own a VCRD. Are older folks more likely to own a VCR?b. Identify the
Based on a four-year (2003–2007) study of over 30,000 people who were 45+ years, where all individuals were followed up regularly for diet and health changes, researchers Tsivgoulis et al. (Neurology, 2013) reported that the Mediterranean diet was linked to better memory and cognitive skills.a.
Regarding the previous question about number of TVs and life expectancy:a. Identify the observational units.A. PeopleB. Number of TVs per 1,000 peopleC. CountriesD. Life expectancyb. Identify the explanatory variable.A. PeopleB. Number of TVs per 1,000 peopleC. CountriesD. Life expectancyc. The
Based on this study, is it reasonable to conclude that by sending TVs to countries with lower life expectancies, we can increase their inhabitants’ lifetimes? If yes, explain how. If no, give an alternative explanation for the association between number of TVs and life expectancy.This question
Studies conducted in New York City and Boston have noticed that more heart attacks occur in December and January than in all other months. Some people have tried to conclude that holiday stress and overindulgence cause the increased risk of heart attack. Identify a confounding variable whose effect
Do different generations view marriage differently? A 2010 survey conducted by the Pew Research Center asked the following question of each participant: €œIs marriage becoming obsolete?€ Results of this study are shown in the table below.a. Identify the observational units.b.
In a study published in a 2007 issue of the journal Preventive Medicine, researchers found that smokers were more likely to have used candy cigarettes as children than nonsmokers were. When hearing about this study, John responded, “But isn’t the smoking status of the person’s parents a
Reconsider the previous exercise about the potential confounding variable that provides an alternative explanation for why the all-nighter group would have a significantly lower average GPA. Sketch a well-labeled diagram showing how this explanation works.Data from previous exerciseSuppose that the
Reconsider the previous study about GPAs and pulling all-nighters. Suppose that the difference between these two averages (3.1 vs. 2.9) is shown to be statistically significant. Which of the following is a potential confounding variable and provides an alternative explanation for why the
Researchers found that students who claimed to have never pulled an all-nighter had an average GPA of 3.1, compared to 2.9 for those students who do claim to have pulled all-nighters.a. In this context, what is the observational unit?A. ResearcherB. StudentC. GPAD. Whether or not have pulled an
Summarize your findings. If you were to repeat this study, are there any changes or improvements you would make? What additional questions might you be interested in asking?Let’s use our 3S strategy to help us investigate how much evidence the sample data provide to support our conjecture that a
Now, let’s step back a bit and think about the scope of our inference. What are the wider implications? Do you think that your conclusion holds true for people in general?
If you were to construct a 99% confidence interval like the 95% confidence interval you constructed in #18 by testing different values for π and seeing whether or not they are plausible, how would the width of the 99% confidence interval compare to that of the 95% confidence interval? Find this
What would happen to your 95% confidence intervals if the sample size had been 1,000 instead of 242 but still 52% of your sample stated they had talked on a cell phone while driving? Use the applet to confirm your answer.Let’s use our 3S strategy to help us investigate how much evidence the
Finally, use the Th eory-Based Inference applet to find a 95% confidence interval for the population proportion of drivers 16 to 17 who have ever talked on a cell phone while driving.a. What is the interval?b. How does this interval compare to the ones you found in Questions 18 and 19a? Why would
Now use the One Proportion applet to create an interval of plausible values with 95% confidence for the population proportion of drivers 16 to 17 who have ever talked on a cell phone while driving using the 2SD method with π = 0.50.a. What is the interval?b. How does your confidence interval using
Use the One Proportion applet to create an interval of plausible values with 95% confidence for the population proportion of drivers 16 to 17 who have ever talked on a cell phone while driving. Do this by putting different values in for π (and/or using the slider) and seeing whether or not each is
You should have seen that 0.50 is a plausible value for the true proportion of all 16- to 17-year-olds who have used their cell phones while driving. Does this prove that 0.50 is the true value?Let’s use our 3S strategy to help us investigate how much evidence the sample data provide to support
Summarize the conclusion that you draw from this study and your simulation analysis. Also explain the reasoning process behind your conclusion.Let’s use our 3S strategy to help us investigate how much evidence the sample data provide to support our conjecture that a majority of 16- to 17-year
Determine the approximate p-value from your simulation analysis. Also interpret what this p-value represents (i.e., the probability of what, assuming what?).Let’s use our 3S strategy to help us investigate how much evidence the sample data provide to support our conjecture that a majority of 16-
How do the actual study results compare to the null distribution obtained when simulating the chance model? Do you believe the study results provide convincing evidence against the “equally likely to talk on the cell phone as not” hypothesis? Why or why not?Let’s use our 3S strategy to help
Based on the dotplot generated using the 1,000 possible values of the statistic, what values would you consider typical values and what would you consider atypical values of the statistic when the chance model is true?Let’s use our 3S strategy to help us investigate how much evidence the sample
What is the center of your simulated null distribution? Does it make sense that this is the center? Explain.Let’s use our 3S strategy to help us investigate how much evidence the sample data provide to support our conjecture that a majority of 16- to 17-year olds have talked on their cell phone
Use the One Proportion applet to simulate 1,000 repetitions of this study, assuming that every driver is just as likely to talk on the cell phone as not while driving. Report what values you input into the applet.Let’s use our 3S strategy to help us investigate how much evidence the sample data
How many of the 16- to 17-year-olds in the sample have ever talked on their cell phone while driving?The survey found that 52% of the 242 16- to 17-year-olds had talked on the phone while driving.
State the appropriate null and alternative hypotheses to be tested.Th e survey found that 52% of the 242 16- to 17-year-olds had talked on the phone while driving.To help answer this question Pew Research(2009) conducted a survey of nationally representative 242 cell phone users ages 16 to 17 years
Is it possible that we could observe the statistic from this sample of 242 drivers even if all of the drivers were just as likely as not to have talked on the cell phone while driving? Why?Let’s use our 3S strategy to help us investigate how much evidence the sample data provide to support our
If we assume that each driver is equally as likely to have talked on the cell phone while driving as not, what is the chance that a randomly selected individual will have talked on the cell phone while driving?Let’s use our 3S strategy to help us investigate how much evidence the sample data
Is the sample proportion who have talked on their cell phone while driving greater than 0.50? (If not, there’s no need to conduct a simulation analysis. You will not have convincing evidence that a majority of drivers aged 16 to 17 have ever talked on the cell phone while driving.)Let’s use our
What is the statistic that you can use to summarize the data collected in the study?Let’s use our 3S strategy to help us investigate how much evidence the sample data provide to support our conjecture that a majority of 16- to 17-year olds have talked on their cell phone while driving.
Describe the parameter of interest in words. (You can use the symbol π to represent this parameter.)To help answer this question Pew Research(2009) conducted a survey of nationally representative 242 cell phone users ages 16 to 17 years and asked whether they had ever talked on the cell phone
What is the variable that is measured/recorded on each observational unit?To help answer this question Pew Research(2009) conducted a survey of nationally representative 242 cell phone users ages 16 to 17 years and asked whether they had ever talked on the cell phone while driving.
What are the observational units?To help answer this question Pew Research(2009) conducted a survey of nationally representative 242 cell phone users ages 16 to 17 years and asked whether they had ever talked on the cell phone while driving.
Identify the research question and state it as a conjecture.Drivers today have many more distractions to deal with than drivers of a century ago. Let’s focus on new drivers aged 16 to 17. Do you think a majority of drivers aged 16 to 17 have ever talked on the cell phone while driving?
In the mid-1980s, sociologist Shere Hite undertook a study of American women’s attitudes toward relationships, love, and sex by distributing 100,000 questionnaires in women’s groups. One of the questions was: Do you give more emotional support to your husband or boyfriend than you receive from
Suppose that you look up the diameters of the planets in our solar system and use the data to determine a 95% confidence interval. Would the resulting interval make any sense? Explain why or why not.
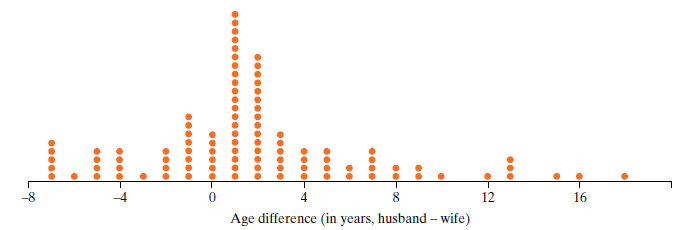
Reconsider the previous two exercises. A 95% confidence interval for the population mean difference in ages (husband–wife, in years) turns out to be (0.92, 2.92). For each of the following, indicate whether the conclusion is valid or invalid:a. We are 95% confident that at least 92% of husbands
Reconsider the previous exercise.a. Based on the dotplot, determine the sample proportion of married couples for whom the wife is older than the husband.b. Is it valid to use a theory-based procedure to estimate the population proportion of married couples for which the wife is older than the
Reconsider the previous exercise. Answer parts (a) to (e) with regard to margin of victory rather than total number of goals. Data can be found in the file called Hockey2 on the textbook website.Data from previous exerciseFeeling too lazy to take a simple random sample of games, one of the authors
A student went to the local county courthouse (in Cumberland County, Pennsylvania, in June and July of 1993) to gather data on ages of soon-to-be husbands and wives who had recently applied for marriage licenses. He gathered age data on a sample of 100 couples and calculated the difference in age
Suppose you have very little knowledge about professional ice hockey, but you want to get a sense of how many goals are scored per game on average and what a typical margin of victory is. You decide to select a sample of games from the current season and record the total number of goals and margin
Reconsider the previous exercise.a. Suppose the sample standard deviation of the expected spending amounts was $30. Determine and interpret a 95% confidence interval for the population mean.b. Now suppose the sample standard deviation was $50. Recalculate a 95% confidence interval for the
The National Retail Federation conducted a national survey of 8,526 consumers on September 1–9, 2009. Among the findings reported were that:• 29.6% of those surveyed said that the state of the U.S. economy would affect their Halloween spending plans;• the average amount that the respondents
Showing 600 - 700
of 2042
1
2
3
4
5
6
7
8
9
10
11
12
13
14
15
Last
Step by Step Answers