New Semester
Started
Get
50% OFF
Study Help!
--h --m --s
Claim Now
Question Answers
Textbooks
Find textbooks, questions and answers
Oops, something went wrong!
Change your search query and then try again
S
Books
FREE
Study Help
Expert Questions
Accounting
General Management
Mathematics
Finance
Organizational Behaviour
Law
Physics
Operating System
Management Leadership
Sociology
Programming
Marketing
Database
Computer Network
Economics
Textbooks Solutions
Accounting
Managerial Accounting
Management Leadership
Cost Accounting
Statistics
Business Law
Corporate Finance
Finance
Economics
Auditing
Tutors
Online Tutors
Find a Tutor
Hire a Tutor
Become a Tutor
AI Tutor
AI Study Planner
NEW
Sell Books
Search
Search
Sign In
Register
study help
mathematics
introduction to business statistics
Introduction To Statistical Investigations 1st Edition Beth L.Chance, George W.Cobb, Allan J.Rossman Nathan Tintle, Todd Swanson Soma Roy - Solutions
Refer to the previous exercise. The report from the Pew Research Center also provided survey results for different age groups:• Among those aged 18 to 29, 89% of 395 used social networking sites.• Among those aged 30 to 49, 78% of 542 used social networking sites.• Among those aged 50 to 64,
In May of 2013, the Pew Research Center’s Internet and American Life Project conducted a survey with a random sample of American adults. Of the 1,895 Internet users in the sample, 72% reported that they used social networking sites.a. Identify the population of interest for this study.b. Identify
An instructor wants to find the proportion of international students at his school. He contacts the registrar’s office and obtains enrollment data for the year 2011. Using these data, he reports that “I am 95% confident that the proportion of international students at our school during 2011 is
Suppose that Elsa and Frank determine confidence intervals based on the same sample proportion and sample size. This time, Elsa uses a larger confidence level than Frank. How will midpoint and width of confidence intervals compare?A. Same midpoint and same widthB. Same midpoint, Elsa has wider
Suppose that Elsa and Frank determine confidence intervals using the same confidence level, based on the same sample proportion. Elsa uses a larger sample size than Frank. How will midpoint and width of confidence intervals compare?A. Same midpoint and same widthB. Same midpoint, Elsa has wider
A Pew Research (2009) survey of nationally representative 242 cell phone users, ages 16 to 17 years, found that 52% had talked on the phone while driving.a. Use these data to estimate, with 95% confidence, the proportion of all 16- to 17-year-old cell phone users who talk on the phone while
An article, “Foul drinking water aboard airlines worsens,” in The Seattle Times (January 2005) reported that 29 out of 169 water specimens from randomly selected passenger aircraft carrying domestic and international passengers tested positive for the presence of bacteria, thus failing to meet
Reconsider the previous three exercises. Now suppose that the player has actually become a .400 hitter. Make this change to the alternative value (with a significance level of 0.10 and a sample size of 100 at-bats), and answer Questions (a) to (d). Then describe the effect of increasing the
Reconsider the previous two exercises. Change the significance level to 0.10 (with a sample size of 100 at-bats), and answer Questions (a) to (d). Then describe the effect of decreasing the significance level on the power of the test.Date from previous exercisea. Open the Power Simulation applet.
Reconsider the previous exercise. Change the sample size to 100 at-bats, and answer questions (a) to (d). Th en describe the eff ect of increasing the sample size on the power of the test.Date from previous exerciseSuppose that a baseball player has been a .250 hitter for his career, which means
Suppose that a baseball player has been a .250 hitter for his career, which means that his probability of a hit (success) has been 0.250. Then during one winter the player genuinely improves to the point that his probability of success improves to 0.333. You will investigate how likely the player
The website www.popvssoda.com invites people to indicate whether they refer to carbonated beverages as €œpop€ or €œsoda€ or €œcoke€ or something else. As of December 30, 2013, the website had received 350,847 responses from the United
Refer to the previous two exercises. Professor Lock’s students also “tipped” pennies by standing them on edge and then banging the table to see which way they would fall. The students found 10,087 heads in 14,611 tips. Answer parts (a) to (g) of the previous question with regard to penny
Refer to the previous exercise. Professor Lock’s students also spun pennies on their side. The students found 9,197 heads in 20,422 spins. Answer parts (a) to (g) of the previous question with regard to penny spinning rather than flipping.Data from previous exerciseOver several years, students of
Over several years, students of Professor Robin Lock have flipped a large number of coins and recorded whether the flip landed heads or tails. As reported in a 2002 issue of Chance News, these students had observed 14,709 heads in a total of 29,015 flips.a. What proportion of these flips resulted
When is the distinction between statistical significance and practical importance more important to consider: with a large sample size, with a small sample size, or is sample size not relevant to the issue?
Answer the following questions about statistical significance and practical importance:a. Which is more appropriate to the issue of statistical significance: p-value or confidence interval?b. Which is more appropriate to the issue of practical importance: p-value or confidence interval?c. Explain
For each of the following variables, indicate whether you think students at your school would generally be truthful or would tend to over- or understate their honest responses. Briefly explain your answer for each.a. Amount of sleep per nightb. Time spent on charity/volunteer workc. Church
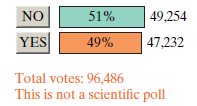
On January 29, 2011, visitors to the CNN.com website were invited to answer a poll question. The results are shown below:Are you exercising more in 2011?A 99.9% confidence interval for the population proportion (of €œyes€ responses) turns out to be (0.484, 0.495).a. Explain
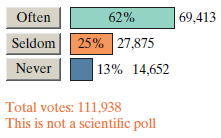
The news website CNN.com regularly posts a poll question that people who view the website can respond to. The following results were posted on January 10, 2012:Do you surf the web while on the job?a. Are the percentages reported in this graphic (62%, 25%, 13%) parameters or statistics? Justify your
If a survey is being conducted on the issue of whether to enact a smoking ban in a public place, how might responses be biased depending on whether or not the interviewer is smoking while asking the questions?
Suggest a variable or issue for which you suspect that respondents might give different responses depending on the clothing worn by the interviewer. Justify your answer.
Refer to the previous exercise. The article also cited a study which found that female interviewers tended to obtain higher percentages of respondents reporting psychiatric symptoms. Suggest another variable or issue for which you suspect that respondents might give diff erent responses depending
In an article titled “Interviewer Effects in Public Health Surveys,” Davis et al. (2010) argue that effects of interviewers on survey participant responses can be especially problematic when dealing with public health issues. For example, the article cited a study which found that black
Think of a controversial issue about which you might be interested in asking people’s opinions. Describe how you could ask a survey question about that issue in as clear and unbiased a manner as possible. Then describe how you could ask the question to bias responses in one direction, and then
If you support President Obama’s health care policy, would you prefer to phrase a survey question in terms of “ObamaCare” or in terms of “Affordable Care Act”? Explain.
Answer the following about how questions can be worded in order to bias the results:a. How might you word a question about attitudes toward the government’s relationship with abortion if the goal were to bias the results in favor of making abortions more accessible?b. How might you word a
One version of a survey question asked whether subjects agree or disagree with the statement that “the best way to ensure peace is through military strength.” Another version asked subjects to choose which of two choices they agree with: “the best way to ensure peace is through military
A survey question could ask for respondents’ opinions about “welfare” or about “assistance to the poor.” Do you think that the wording used could influence people’s responses? If so, which wording would you expect to produce a higher percentage of favorable responses towards these
Refer to the previous question. The results from the 1994 sample of 991 adults were that 91% answered that they were certain the Holocaust happened, 8% did not know, and 1% thought it possible that it never happened.a. Produce an appropriate graph for comparing the results between the 1992 and 1994
Refer to the previous exercise. When the Roper Organization conducted another survey in March of 1994, they asked, “Does it seem possible to you that the Nazi extermination of the Jews never happened, or do you feel certain that it happened?” Do you think the wording of this question is clearer
In a November 1992 survey, the Roper Organization asked American adults, “Does it seem possible or does it seem impossible to you that the Nazi extermination of the Jews never happened?” Th e results were very surprising and widely discussed. Of the 992 adults surveyed, 22% responded that
Recall from Exploration 3.5A that the Literary Digest magazine conducted a very extensive public opinion poll in 1936 in order to predict the outcome of that year’s presidential election. They mailed out over 10 million questionnaires to people whose names and addresses they obtained from
Suppose you want to compare waiting times, from getting in line to receiving the order, at two coffee bars on campus.a. Describe what might be wrong with looking at the first 40 people who come to each of the coffee bars on a Tuesday morning.b. Describe how you might find a more representative
To cut the margin of error of a confidence interval in half one mustA. Increase the sample size by a factor of 2B. Increase the ample size by a factor of 4C. Increase the sample size by a factor of 10D. Increase the sample size by a factor of 100
True or false? The standard error formulas for x̅ and p̂ both have √n in the denominator.
Suppose a random sample of 50 college students are asked to measure the length of their right foot in centimeters. A 95% confidence interval for the mean foot length for students at the college is found to be 21.709 to 25.091 cm. If a 99% confidence interval were calculated instead, how would it
A 95% confidence interval is computed to estimate the mean household income for a city. Which of the following values will definitely be within the limits of this confidence interval? Circle all that apply.A. The population meanB. The sample meanC. The sample standard deviationD. The p-valueE. All
Suppose we have a collection of the heights of all students at your college. Each of the 250 people taking statistics randomly takes a sample of 40 of these heights and constructs a 95% confidence interval for mean height of all students at the college. Which of the following statements about the
If you took repeated samples of size 100 and constructed a 99% confidence interval for the population proportion who would shop at the store because of the coat sale from each sample, what percentage of these intervals would capture the population proportion?
If you took repeated samples of size 100 and constructed a 95% confidence interval for the population proportion who would shop at the store because of the coat sale from each sample, what percentage of these intervals would capture the population proportion?
If the sample size were 1,000 instead of 100, the width of a 95% confidence interval would (increase/decrease).
If the sample size were 10 instead of 100, the width of a 95% confidence interval would (increase/decrease).
Instead of 40, if 60 of the 100 people had stated that the main reason they had visited the store was because the store is running a sale on coats that weeka. The width of the 95% confidence interval would ( increase/ decrease/remain same).b. The center of the 95% confidence interval would (
Instead of 40, if 50 of the 100 people had stated that the main reason they had visited the store was because the store is running a sale on coats that week, the width of a 95% confidence interval would (increase/decrease).
Instead of 40, if 30 of the 100 people had stated that the main reason they had visited the store was because the store is running a sale on coats that week, the width of a 95% confidence interval would (increase/decrease).
Which confidence interval would be the narrowest?A. 99% B. 95%C. 90% D. 85%
A confidence interval is constructed for the population proportion of consumers who would visit the store because of the coat sale. Which confidence interval would be the widest?A. 99% B. 95%C. 90% D. 85%
If you took repeated samples of size 150 and constructed a 99% confidence interval for the population mean of hours slept from each sample, what percentage of these intervals would capture the population mean of hours slept?
If you took repeated samples of size 150 and constructed a 95% confidence interval for the population mean of hours slept from each sample, what percentage of these intervals would capture the population mean of hours slept?
If the sample size were 1,500 instead of 150, the width of a 95% confidence interval would (increase/decrease).
If the sample size were 15 instead of 150, the width of a 95% confidence interval would (increase/decrease).
Using the formula p̂ ± 1.96√p̂ (1 − p̂ )/n, compute a 95% confidence interval for a population proportion given the sample proportion is 0.65 and the sample size is 500.
Using the formula p̂ ± 1.96√{ p̂ (1 − p̂ )/n}, compute a 95% confidence interval for a population proportion given the sample proportion is 0.35 and the sample size is 1000.
A sample of students that had stuff y or runny noses were blindly given a single Skittles candy to put in their mouth. They were told the five possible flavors and then were asked which flavor they had. Of the 118 students tested, 44 gave the correct answer. Find a 95% confidence interval for the
A sample of healthy students were blindly given a single Skittles candy to put in their mouth. They were told the five possible flavors and then were asked which flavor they had. Of the 154 students tested, 78 gave the correct answer. Find a 95% confidence interval for the proportion of all healthy
In order to determine who would accept a Facebook friend request from someone they didn’t know, a student researcher made up a phony Facebook profile that represented a male student at her college. She then sent out 101 friend requests and 18 of these accepted the request. Find a 95% confidence
In order to determine who would accept a Facebook friend request from someone they didn’t know, a student researcher made up a phony Facebook profile that represented a female student at her college. She then sent out 118 friend requests and 61 of these accepted the request. Find a 95% confidence
From a random sample of 92 female students at Hope College, 10 were left -handed. Determine a 99% confidence interval for the proportion of all female students at Hope College that are left -handed.
From a random sample of 97 male students at Hope College, 12 were left -handed. Determine a 99% confidence interval for the proportion of all male students at Hope College that are left -handed.
Statistics students conducted a test to see if people could taste the difference between Coke and Pepsi. They fill two cups with Coke and a third with Pepsi. They then asked their subjects which tasted different than the other two. Of the 64 people they tested, 22 were able to correctly identify
Statistics students were conducting a test to see if people could taste the difference between Coke and Pepsi. They fill two cups with Coke and a third with Pepsi. They then asked their subjects which cola tasted different than the other two. Of the 64 people they tested, 22 were able to correctly
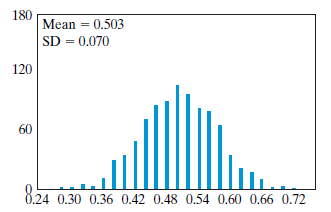
In a July 2012 Gallup poll that surveyed 1014 randomly selected U.S. adults, 5% said that they considered themselves vegetarians.a. Describe what the parameter is in this context.b. The standard deviation (SD) from the simulated null distribution is 0.007. Use the 2SD method to find a 95%
Refer to the data in the previous question. Use the 2SD rule to find the 95% confidence interval. Why is it similar to the one you obtained in part (a) of the previous question?Data from previous questionStudents at Hope College were tested to see if they could determine the difference between tap
Students at Hope College were tested to see if they could determine the difference between tap water and bottled water. Of the 63 students tested, 42 correctly identified which was which. We will assume the students tested are representative of all students at Hope College.a. Find a theory-based
Recall that researchers also conducted a follow-up study predicting the outcomes of races in the House of Representatives with 189 correct predictions out of 279.a. Use a simulation and the 2SD method to compute a 95% confidence interval.b. Use a theory-based approach to generate the 95% confidence
In Example 1.4 we looked to see whether the competent- face method could be used to predict the results of Senate races. We found this method worked in 23 out of 32 races. When testing to see if the probability of this method working is more than 0.50, we obtained a null distribution similar to
Using the sample proportion of 30 out of 50 students that saw the spinning dancer spin clockwise (see Exercise 3.2.11), answer the following:a. Using the Theory-Based Inference applet, determine a 95% confidence interval for the probability a randomly chosen student would see the woman spinning
The spinning dancer (or silhouette illusion) is a moving image of a woman that appears to be spinning. Some people see her spinning clockwise and some see her spinning counterclockwise. A student showed other students this and found that 30 out of 50 (or 60%) of them saw her spinning clockwise. The
A recent study examined hearing loss data for 1,771 U.S. teenagers. In this sample, 333 were found to have some level of hearing loss. News of this study spread quickly, with many news articles blaming the prevalence of hearing losson the higher use of ear buds by teens. At MSNBC.com (8/17/2010),
Th e 2011 Statistical Abstract of the United States includes a table reporting that a national survey in the fall of 2009 found that 18.2% of American adults played a board game in the past year. We can use this sample result to estimate the proportion of all adult Americans who had played a board
To estimate the proportion of city voters who will vote for the Republican candidate in the election, two students, Manny and Nina, each decide to conduct polls in the city. Manny selects a random sample of 50 voters, while Nina selects a random sample of 100 voters. Suppose both samples result in
Suppose a 95% confidence interval for a population proportion is (0.27, 0.49). Rewrite this interval in the form of p̂ ± margin of error .
Suppose a 95% confidence interval for a population proportion is (0.30, 0.60). Rewrite this interval in the form of p̂ ± margin of error .
Which of the following is NOT true about theory based confidence intervals for a population proportion?A. They should only be used when you have at least 10 successes and 10 failures in your sample data.B. The process used to construct the interval relies on a normal distribution.C. They can be
Which of the following is true of a 2SD confidence interval?A. They are approximate 95% confidence intervals.B. They can be used for any confidence level.C. They give exactly the same results as a theory-based interval.D. The SD represents the standard deviation of the sample data.
Suppose a 95% confidence interval for a population proportion is found using the 2SD or theory-based method.Which of the following will definitely be contained in that interval?A. The population proportionB. The sample proportionC. The p-valueD. All of the above
A recent Gallup poll showed the president’s approval rating at 60%. Some friends use this information (along with the sample size from the poll) and find theory-based confidence intervals for the proportion of all adult Americans that approve of the presidents performance. Of the following four
A Gallup survey of 1001 randomly selected U.S. adults conducted May 2011 asked, “In your opinion, which one of the following is the main reason why students get education beyond high school?” Fifty three percent chose “to earn more money.” Based on these data, I found the 95% confidence
True or false? A confidence interval informs on all parameter values that are plausible, the test of significance only tells us about one parameter value.
True or false? You can find the strength of evidence of a test by looking at the confidence interval.
Reporting a confidence interval is more informative than a test of significance.A. Always.B. Only if you are concerned with a reject or fail to reject test outcome, rather than measuring strength of evidence.C. Never, the test of significance is always more informative.
In a July 2012 Gallup poll based on a representative sample of 1014 adult Americans, 48% reported drinking at least one glass of soda pop on a typical day. Now suppose that we test the null hypothesis π = 0.50 vs. the alternative hypothesis π ≠ 0.50.a. Describe (in words) what the symbol
What proportion of San Luis Obispo (SLO) residents dine at restaurants at least once a week? To investigate, a local high school student, Deidre, decides to conduct a survey. She selects a random sample of adult residents of SLO, asks each participant whether he/she dines at restaurants at least
Are there any values of simulated sample proportions that are less than 0.10? Are there any values of simulated sample proportions that are greater than 0.10? What does that tell you?
What is the center of your simulated null distribution? Does it make sense that this is the center? Explain.
Use the One Proportion applet to simulate 1,000 repetitions of a random process, assuming that the proportion of cell phone users who fake calls is 0.10. Report what values you input into the applet.
If we assume that the population proportion of cell phone users who fake cell phone calls is actually 0.10, is it possible that we could observe the statistic we did from this sample of 1,858 cell phone users? Why?
What is the statistic that you can use to summarize the data collected in the study?Let’s use the 3S strategy to help us investigate how much evidence the sample data provide to support the conjecture that more than 1 in 10 cell phone users fake cell phone calls.
Is the 13% a statistic or a parameter? How are you deciding?
If another sample of 1,858 American cell phone users were surveyed, could the percentage admitting to faking cell phone calls in the past 30 days change? Explain your reasoning.A reporter for International Business Times took the Pew survey results and wrote that more than 1 in 10 cell phone users
State the appropriate null and alternative hypotheses to be tested.A reporter for International Business Times took the Pew survey results and wrote that more than 1 in 10 cell phone users in the U.S. has engaged in such fake cell phone use in the past 30 days. Notice that the reporter’s claim is
Describe the parameter of interest in words. (You can use the symbol π to represent this parameter.)A reporter for International Business Times took the Pew survey results and wrote that more than 1 in 10 cell phone users in the U.S. has engaged in such fake cell phone use in the past 30
What is the variable that is measured/recorded on each observational unit?A reporter for International Business Times took the Pew survey results and wrote that more than 1 in 10 cell phone users in the U.S. has engaged in such fake cell phone use in the past 30 days. Notice that the reporter’s
What are the observational units?A reporter for International Business Times took the Pew survey results and wrote that more than 1 in 10 cell phone users in the U.S. has engaged in such fake cell phone use in the past 30 days. Notice that the reporter’s claim is about the population of all cell
What is our research question?A reporter for International Business Times took the Pew survey results and wrote that more than 1 in 10 cell phone users in the U.S. has engaged in such fake cell phone use in the past 30 days. Notice that the reporter’s claim is about the population of all cell
Do you feel comfortable generalizing your conclusions to all cell phone users? If not, is there a population you feel you can generalize your conclusions to?
Was the sampling method unbiased?
Was the sample random?
Use the previous information to answer the following questions.a. What is the population of interest?b. Do you believe that the average hours of television per day in the sample is likely less than, similar to, or greater than the average hours of television watched per day in the population? Why?
Showing 700 - 800
of 2042
1
2
3
4
5
6
7
8
9
10
11
12
13
14
15
Last
Step by Step Answers