New Semester
Started
Get
50% OFF
Study Help!
--h --m --s
Claim Now
Question Answers
Textbooks
Find textbooks, questions and answers
Oops, something went wrong!
Change your search query and then try again
S
Books
FREE
Study Help
Expert Questions
Accounting
General Management
Mathematics
Finance
Organizational Behaviour
Law
Physics
Operating System
Management Leadership
Sociology
Programming
Marketing
Database
Computer Network
Economics
Textbooks Solutions
Accounting
Managerial Accounting
Management Leadership
Cost Accounting
Statistics
Business Law
Corporate Finance
Finance
Economics
Auditing
Tutors
Online Tutors
Find a Tutor
Hire a Tutor
Become a Tutor
AI Tutor
AI Study Planner
NEW
Sell Books
Search
Search
Sign In
Register
study help
mathematics
introduction to business statistics
Introduction To Statistical Investigations 1st Edition Beth L.Chance, George W.Cobb, Allan J.Rossman Nathan Tintle, Todd Swanson Soma Roy - Solutions
Among the sample, the information for three particular respondents is given here:(i) Respondent 1 reported spending 240 minutes in the last three days reading/watching news coverage about the trial and not being happy with the verdict.(ii) Respondent 2 reported spending 90 minutes in the last three
The survey also asked participants to report the time the respondent spent reading or watching news coverage about the trial during the last three days. The poll found that, on average, respondents had spent 92 minutes reading or watching news coverage about the trial during the last three days.a.
Evaluate the strength of evidence for the hypotheses in the previous question.a. Find the p-value for the hypotheses in the previous question using a simulation-based approach.b. Based on the p-value evaluate the strength of evidence and state a conclusion about the opinions of U.S. adults about
The news program wishes to test whether there is evidence that more than three-quarters of U.S. adults are opposed to the verdict. Five hundred and sixty two participants participated in the survey, of which 82% said that they were unhappy with the verdict.a. State the null and alternative
Use the previous information to answer the following questions about the news program.a. Identify the variable measured on each participant in the survey.b. Is the variable categorical or quantitative?c. Identify at least one statistic that the news program could use to summarize the variable.d.
Use the previous information to answer the following questions about the news program survey.a. Describe in words the parameter of interest.b. Identify the numeric value of the statistic corresponding to the above parameter, as found in the television news survey.In order to understand more about
Use the previous information to answer the following questions.a. What is the population of interest?b. Do you believe that the proportion of people unhappy with the verdict in the sample is likely less than, similar to, or greater than the proportion of individuals unhappy with the verdict
Consider how the sample was selected for the study. If the study was conducted by taking a random sample, explain (in enough detail that someone could follow your directions to obtain the sample) how it could have been done. If the study was not conducted by taking a random sample, explain how you
Among the sample, the information for three particular likely voters is given here:(i) Likely voter 1 reported spending 0 minutes in the last week learning/reading about local politics and likely voting for the incumbent.(ii) Likely voter 2 reported spending 0 minutes in the last week
Th e poll also asked voters to report the amount of time that the respondent spent reading or learning about local politics over the last week. Th e poll finds that, on average, respondents have spent 42 minutes learning or reading about local politics over the last week.a. Identify the variable
Evaluate the strength of evidence for the hypotheses in the previous question.a. Find the p-value for the hypotheses in the previous question using a simulation-based approach.b. Based on the p-value evaluate the strength of evidence and state a conclusion about the likely voting outcome in the
The polling agency wishes to test whether there is evidence that more than 50% of likely voters will likely vote for the incumbent.a. State the null and alternative hypotheses for this test.b. What is the value of the statistic?In order to estimate the proportion of all likely voters who will
Use the previous information to answer the following questions about the political survey.a. Identify the variable measured on each likely voter.b. Is the variable categorical or quantitative?c. Identify at least one statistic that the polling agency could use to summarize the variable.d. Identify
Use the previous information to answer the following questions about the political survey.a. Describe in words the parameter of interest.b. Identify the numeric value of the statistic corresponding to the above parameter.In order to estimate the proportion of all likely voters who will likely vote
Use the previous information to answer the following questions.a. What is the population of interest?b. Do you believe that the proportion of likely voters for the incumbent in the sample is likely less than, similar to, or greater than the proportion of likely voters who would say they will vote
Consider how the student obtained her sample for her study. If her study was conducted by taking a random sample, explain (in enough detail that someone could follow your directions to obtain the sample) how it could have been done. If her study was not conducted by taking a random sample, explain
Among the students in her class, the information for three particular students is given here:(i) Alejandra reported watching 2 hours of TV a day, but not watching TV yesterday.(ii) Ben reported watching 4 hours of TV a day and watching TV yesterday.(iii) Cassie reported watching 30 minutes of TV a
Evaluate the strength of evidence for the hypotheses in the previous question.a. Find the p-value for the hypotheses in the previous question using a simulation-based approach.b. Based on the p-value evaluate the strength of evidence and state a conclusion about the TV watching among students
Using the information from the previous question, the student wishes to test whether there is evidence that more than 50% of students at the school watched at least 10 minutes of TV yesterday.a. State the null and alternative hypotheses for this test.b. Describe the parameter of interest for this
In the survey the student also asked students whether or not they watched at least 10 minutes of TV yesterday. Th e student found that 21 of 30 students reported watching at least 10 minutes of TV yesterday.a. Identify the variable measured on each student.b. Is the variable categorical or
Use the previous information to answer the following questions about the class survey.a. Describe in words the parameter of interest.b. Identify the numeric value of the statistic corresponding to the above parameter.
Use the previous information to answer the following questions about the class survey.a. Identify the variable measured on each student.b. Is the variable categorical or quantitative?c. Identify at least two statistics that the student could use to summarize the variable.d. Identify at least one
Argue whether or not you believe using a sample of birds which visit a bird feeder in your yard (the next 50 birds that visit) may or may not yield biased estimates based on the variable being measured/research question being investigated in each of the following situations.a. Using the proportion
Argue whether or not you believe using a sample of students from your school’s cafeteria (you recruit the next 100 people to visit the cafeteria to participate) may or may not yield biased estimates based on the variable being measured/research question being investigated in each of the following
When using simulation- or theory-based methods to test hypotheses about a proportion, the process of computing a p-value is:A. Different if the sample is from a process instead of from a finite populationB. The same if the sample is from a process instead of from a finite populationC. Sometimes
When stating null and alternative hypotheses, the hypotheses are:A. Always about the parameter onlyB. Always about the statistic onlyC. Always about both the statistic and the parameterD. Sometimes about the statistic and sometimes about the parameter
True or false?A. Random samples only generate unbiased estimates of long-run proportions, not long-run means.B. Nonrandom samples are always biased.C. Th ere is no way that a sample of 100 people can be representative of all adults living in the United States.
True or false?A. Larger samples are always better than smaller samples, regardless of how the sample was collected.B. Larger random samples are always better than smaller random samples.C. You shouldn’t take a random sample of more than 5% of the population size.
The reason for taking a random sample instead of a convenience sample is:A. Random samples tend to be smaller and so take less time to collect.B. Random samples tend to represent the population of interest.C. Random samples always have 100% participation rates.D. Random samples tend to be easier to
In most statistical studies the _______________ is unknown and the ________________ is known.A. Parameter/statisticB. Statistic/parameter
The population will always be _______________ the sample.A. At least as large asB. Smaller than
Do you have strong evidence that the long-run proportion of times a student will choose the right front tire is different than 1/4?
Use a theory-based test to find the p-value. How does this compare with the p-value you obtained back in Question 11c.Suppose we didn’t have a preconceived notion that the right front tire would be chosen more oft en, but just wanted to find out if it was chosen at a rate that was different than
Write the null and alternative hypotheses for this new question.Suppose we didn’t have a preconceived notion that the right front tire would be chosen more oft en, but just wanted to find out if it was chosen at a rate that was different than 1/4. Let’s use our original data where 14 out of 28
Conduct a simulation analysis to produce a simulated p-value. How does it compare to the p-value from the study of the class with 28 students? Is this what you expected? Explain.
Before you analyze the data, would you expect to find stronger evidence for the research conjecture (that people pick the right front tire more than one fourth of the time), weaker evidence, or the same strength of evidence? Explain your thinking.
If you were to repeat this study, what improvements might you make? What further research might you propose related to this topic in the future?
Now, let’s step back a bit and think about the scope of our inference. What are the wider implications? Do you think that your conclusion holds true for people in general? (These are extremely important questions that we’ll discuss more when we talk about the scope of inference in Chapter 2.)
Summarize the conclusion that you draw from this study and your simulation analysis. Also explain the reasoning process behind your conclusion.
What is the statistic that you can use to summarize the data collected in the study and what symbol is associated with this statistic?
Is there strong evidence against the null hypothesis for all three of the methods used in Question 11? Explain.
Let’s examine the strength of evidence with the three ways we used in Chapter 1.a. Determine the p-value from your simulation analysis. Also interpret what this p-value represents (i.e., the probability of what, assuming what?).b. Determine the standardized statistic from your simulation
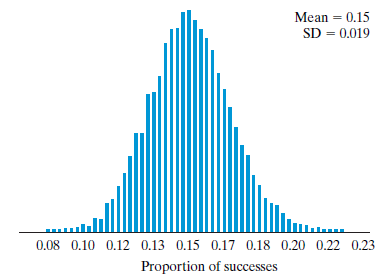
Using the proportion of successes for the values on the horizontal axis, what is the center of your null distribution? Does it make sense that this is the center? Explain.
Use the One Proportion applet to simulate 1,000 repetitions of this study, assuming that every student in class selects randomly (equally) among the four tires. Report what values you input into the applet.Probability of success (π)_________Sample size (n) _____________Number of samples ___________
Is it possible that we could observe 14 students from this class of 28 students even if all of the students were just selecting randomly among the four tires?To test this conjecture about the right front tire, a recent class of 28 students was asked, if they were in this situation, which tire would
What percentage of the students picked the right front tire? Is this more than you would expect if students randomly pick one of the four tires?To test this conjecture about the right front tire, a recent class of 28 students was asked, if they were in this situation, which tire would they say had
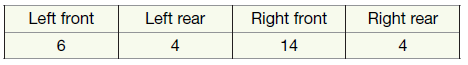
State the appropriate null and alternative hypotheses to be tested.To test this conjecture about the right front tire, a recent class of 28 students was asked, if they were in this situation, which tire would they say had gone fl at. We obtained the following results: Left front Right front 14 Left
Describe the parameter of interest in words. (You can use the symbol π to represent this parameter.)To test this conjecture about the right front tire, a recent class of 28 students was asked, if they were in this situation, which tire would they say had gone fl at. We obtained the
What is the variable that is measured/recorded on each observational unit?To test this conjecture about the right front tire, a recent class of 28 students was asked, if they were in this situation, which tire would they say had gone fl at. We obtained the following results: Left front Right front
Reconsider the previous exercise. Notice that three different decimal numbers appear: 0.46, 0.484, and 0.50. Identify which is the null-hypothesized probability, which is the observed value of the statistic, and which is the p-value.Date from previous exerciseOne of the authors once spun his tennis
One of the authors once spun his tennis racquet 100 times and found that it landed with the label up for 46 of those 100 spins (0.46). For testing whether the probability (that a spun tennis racquet lands with the label up) differs from 0.50, he calculated the p-value to be 0.484.a. Summarize the
Refer to the previous exercise. Th e researchers also found that 503 of the 1,770 people thought of the number 7. Do these data provide strong evidence that people have a tendency to select the number 7 disproportionately oft en? Investigate this question by answering parts (a) to (g) of the
a. Describe the relevant parameter of interest.b. State the appropriate hypotheses to be tested.c. Calculate the observed value of the appropriate statistic.d. Check whether a theory-based approach is appropriatefor these data and hypotheses.e. Calculate the standardized value of the statistic.f.
Lorena is a golfer who wants to investigate whether she successfully makes more than 60% of her 10-foot putts.a. Define (in words) the relevant parameter of interest for Lorena.b. State (in words and in symbols) the appropriate hypotheses to be tested by Lorena.
Rick is a basketball player who wants to investigate whether he successfully makes more than 90% of his free throws by shooting with an underhand style.a. Define (in words) the relevant parameter of interest for Rick.b. State (in words and in symbols) the appropriate hypotheses to be tested by Rick.
Alfonso wants to investigate whether fewer than one-fourth of families with two children have two girls, so he collects data for 25 two-child families. Describe how he could use coins to perform a physical (by hand, without using a computer) simulation to approximate the null distribution.
Josephine wants to investigate whether more than one-third of families with two children have one child of each sex, so she collects data for 50 two-child families. Describe how she could use a die to perform a physical (by hand, without using a computer) simulation to approximate the null
Suppose that Sasha and Jayla both collect data to investigate whether people tend to call “heads” more often than “tails” when they are asked to call the result of a coin flip. If Sasha has a smaller p-value than Jayla, which of the following would you conclude? (There may be more than one
Suppose that Jose and Roberto both collect data to investigate whether people tend to call “heads” more oft en than “tails” when they are asked to call the result of a coin flip. If Jose uses a larger sample size than Roberto, is Jose guaranteed to have a smaller p-value than Roberto?
Reconsider the previous exercise. Suppose that you were to define the parameter π, not as the probability that a New Zealand student would associate the name Tim with the face on the left , but as the probability that a New Zealand student would associate the name Bob with the face on the left .
a. Express the appropriate null and alternative hypotheses, in symbols and in words, for testing whether New Zealand students have a tendency to associate the name Tim with the face on the left.b. Conduct a simulation analysis to test these hypotheses with data from Mr. Judkins’s students.
Additional information supplied in the Sports Illustrated article was that 34.6% of all professional baseball players are from Latin-American countries, but 368 of the 595 (61.8%) players suspended for PED use between 2005 and 2013 are from Latin-American countries. Answer parts (a) to (c) of the
a. One question is whether 0.346, the observed proportion of PED-suspended players from the U.S., is (statistically) significantly less than 0.573, the proportion of all players from the U.S. Before you attempt to answer this question, explain what the question means (i.e., what statistical
On the television show Mythbusters, the hosts Jamie and Adam wanted to investigate which side buttered toast prefers to land on when it falls through the air. To replicate a piece of toast falling through the air, they set up a specially designed rig on the roof of the Mythbusters’ headquarters.
A statistics professor is in a fantasy golf league with four friends. Each week one of the five people in the league is the winner of that week’s tournament. During the 2010 season, this particular professor was the winner in 7 of the first 12 weeks of the season. Does this constitute strong
The standard deviation of a null distribution is calculated using which value: the probability value in the null hypothesis or the observed value of the sample proportion?
A p-value is calculated assuming that which hypothesis is true: null or alternative?
Suppose two brothers named Mario and Luigi like to compete by playing a certain video game. Mario thinks he is better at this game than Luigi and sets out to prove it by keeping track of who wins. Aft er playing the game 30 times, Mario won 18 of them (or 60%). Mario then declares that this proves
It also seemed to the author that ones showed up less often than what they should if the dice were fair and he wanted to test this. In his 500 dice rolls, 72 resulted in ones.a. Describe what the parameter is in the context of this problem.b. State the appropriate null and alternative hypotheses in
It seemed to the author that sixes showed up more than what they should if the dice were fair and he wanted to test this. He had the machine roll 500 dice and obtained 92 sixes.a. Describe what the parameter is in the context of this problem.b. State the appropriate null and alternative hypotheses
The researchers found that of the 272 boxing matches, the competitor in red won 150 times.a. State the appropriate null and alternative hypotheses in the context of this study.b. Using an appropriate applet, find the p-value using a theory-based test (one-proportion z-test; normal approximation).c.
The researchers found that of the 457 matches, the competitor in red won 248 times.a. State the appropriate null and alternative hypotheses in the context of this study.b. Using an appropriate applet, find the p-value using a theory-based test (one-proportion z-test; normal approximation).c.
In Example 1.4, we explored whether voters make decisions based on a candidate’s facial appearance. The researchers described how they had people determine which of two candidates for the U.S. House of Representatives in 2004 had the more competent face. They then looked to see if the one with
Reconsider Exploration 1.3, where we explored whether the long-run proportion that students in a class would correctly assign the names Bob and Tim to the pictures. We tested to see if this long-run proportion is more than 0.50.a. State the appropriate null and alternative hypotheses in the context
Based on the statistics from the previous question where people were playing rock-paper-scissors, we want to see if players start with rock with a probability that is different than 1/3.a. State the appropriate null and alternative hypotheses in the context of this study, first in words and then in
a. State the appropriate null and alternative hypotheses in the context of this study, first in words and then in symbols.b. Using an appropriate applet, find the p-value using a theory-based test (one-proportion z-test; normal approximation).c. Summarize your conclusion from your p-value.
Recall Exercise 1.2.19, where researchers investigated whether rhesus monkeys have some ability to understand gestures made by humans. In one part of the study, they found that 31 of 40 monkeys correctly went to one of two boxes that researchers pointed towards.a. State the appropriate null and
Recall Exercise 1.2.16, in which researchers asked 40 heterosexual couples which person said “I love you first.”They found that the man said “I love you” in 28 of the 40 couples before the woman did. Since previous research indicated that the man tends to say “I love you” before the
In the same research article, Utts (1995) also cites research from Morris et al. (1995) where, out of 97 Ganzfeld sessions, the receiver could correctly identify the image sent 2 times. You would like to know whether these data provide evidence that in Ganzfeld studies receivers will do
a. Describe what the symbol π stands for in this context.b. State your null and alternative hypotheses.c. If the subjects in these studies have no psychic ability, approximately what proportion will identify the correct image? Is this the null hypothesis or the alternative hypothesis?d. Use an
Recall that, to explore more deeply, the researchers went on to look at data from the most recent 361 heart transplantations at St. George€™s and found that 71 had resulted in deaths within 30 days of the heart transplant procedure. Once again, one can use the One Proportion applet to
a. According to the dotplot produced by the applet, what is the mean of the null distribution? Explain how you could have anticipated this.b. According to the dotplot produced by the applet, is the overall shape of the null distribution bell-shaped? Th at is, can the null distribution be described
According to researchers, a coin fl ip may not have a 50% chance of landing heads and a 50% chance of landing tails. In fact, they believe that a coin is more likely to land the same way it started. So if it starts out heads up, it is more likely to land heads up. Suppose someone tests this
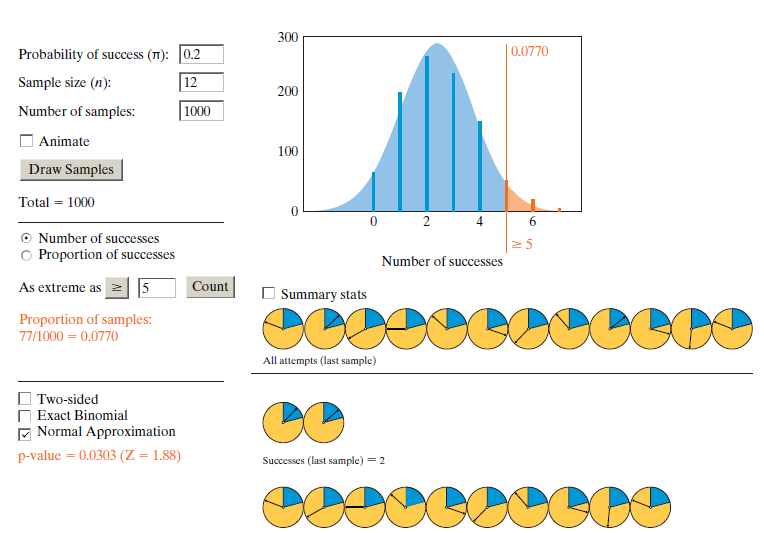
According to statistician Persi Diaconis, the probability of a penny landing heads when it is spun on its edge is only about 0.20. Suppose you doubt this claim and think that it should be more than 0.20. To test this, you spin a penny 12 times and it lands heads side up 5 times. You put this
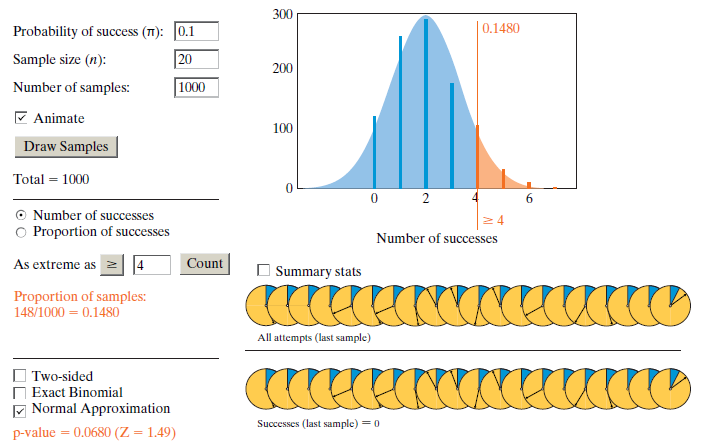
Suppose you ride to school with a friend and often arrive at a certain stop light when it is red. One day she states, €œIt seems like this light is green only 10% of the time when we get here.€ You think it is more oft en than 10% and want to test this. You keep track of the
What is a z-statistic?
Suppose you are using theory-based techniques (e.g., a one-proportion z-test) to determine p-values. How will a two-sided p-value compare to a one-sided p-value (assuming the one-sided p-value is less than 0.50)?A. The two-sided p-value will be about the same as the one-sided.B. The two-sided
What is calculated using the formula (statistic − mean of null distr.)/(SD of null distr.)?
What is calculated using the formula √{π(1 − π)/n}?
Which sample size, n, gives the smallest standard deviation of the null distribution where the long-run proportion, π, is 0.25?A. 30 B. 40C. 50 D. 60
Would your answer change in Exercise 1.5.1 if the sample size were 100?In exercise 1.5.1Which long-run proportion of success, π, gives the largest standard deviation of the null distribution when the sample size is 10?A. 0.05B. 0.25C. 0.50D. 0.90
Which long-run proportion of success, π, gives the largest standard deviation of the null distribution when the sample size is 10?A. 0.05B. 0.25C. 0.50D. 0.90
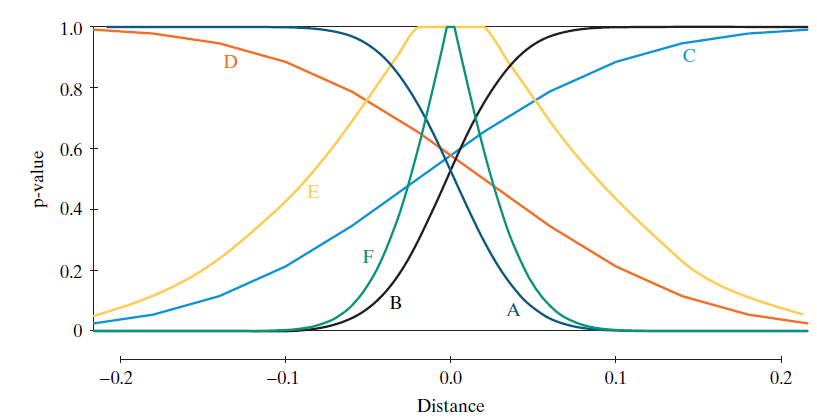
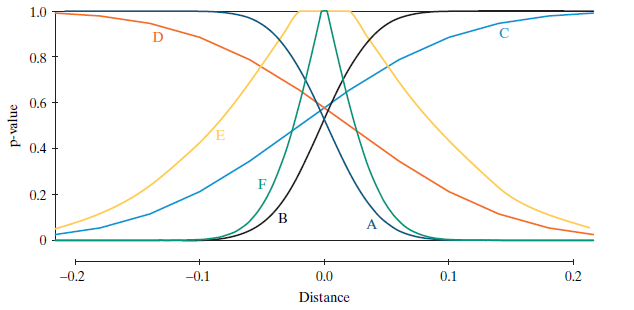
Look at the figure long enough to follow each curve with your eye and recognize its shape and steepness. Keep these two facts in mind€”three shapes, two curves of each shape€”and try to relate them to the three main influences on p-values: distance, sample size, and one- versus
The six graphs are for two different sample sizes: one small (25) and one large (225). Your challenge in this exercise is to figure out how to tell the difference between a small-sample curve and a large-sample curve. Exercise 1.4.33 illustrates that the form of the alternative hypothesis
Try to relate the shape of the curve to the alternate hypothesis.a. Suppose Buzz really wants to earn his fish and tries to guess right. Your alternative hypothesis is that π > 0.50. Th e better Buzz does, the _____ (smaller, larger) the p-value. The graph should be _________
Notice that the distance pˆ − π (x-axis) can tell you percent correct. Recall Example 1.1. For Buzz and Doris:a. A distance of 0.50 means Buzz is right _____% of the time.b. A distance of 0.00 means Buzz is right _____% of the time.c. A distance of −0.50 means Buzz is right _____% of the time.
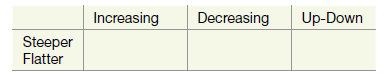
Notice that there are three basic shapes for the curves: increasing, decreasing, and €œup-down.€ Tell the letters for each shape:a. Increasing:b. Decreasing:c. Up-down: 1.0 D 0.8 0.6 0.4 F 0.2 A -0.1 0.0 -0.2 0.1 0.2 Distance p-value
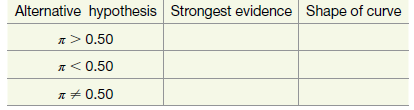
The graph below shows six different curves labeled A€“F. Each curve shows the relationship between the p-value (y-axis) and the distance pˆ ˆ’ Ï€ (x-axis) for testing the null hypothesis Ï€ = 0.50.Match each curve A€“F with one of the
In this exercise, as in the one before, we eliminate elections with more than two major party candidates as well as elections with two candidates of the same height. In addition, we eliminate the two elections in which George Washington was unopposed and fi ve elections with missing data. Consider
In the first election of the 20th century, The odore Roosevelt (178 cm) defeated Alton B. Parker (175 cm). There have been 27 additional elections since then, for a total of 28.Of these, 25 elections had only two major party candidates with one taller than the other. In 19 of the 25
Showing 1400 - 1500
of 2042
First
7
8
9
10
11
12
13
14
15
16
17
18
19
20
21
Step by Step Answers