New Semester
Started
Get
50% OFF
Study Help!
--h --m --s
Claim Now
Question Answers
Textbooks
Find textbooks, questions and answers
Oops, something went wrong!
Change your search query and then try again
S
Books
FREE
Study Help
Expert Questions
Accounting
General Management
Mathematics
Finance
Organizational Behaviour
Law
Physics
Operating System
Management Leadership
Sociology
Programming
Marketing
Database
Computer Network
Economics
Textbooks Solutions
Accounting
Managerial Accounting
Management Leadership
Cost Accounting
Statistics
Business Law
Corporate Finance
Finance
Economics
Auditing
Tutors
Online Tutors
Find a Tutor
Hire a Tutor
Become a Tutor
AI Tutor
AI Study Planner
NEW
Sell Books
Search
Search
Sign In
Register
study help
mathematics
mathematical applications for the management
Mathematical Interest Theory 3rd Edition Leslie Jane, James Daniel, Federer Vaaler - Solutions
When Mendel conducted his famous genetics experiments with peas, one sample of offspring consisted of 428 green peas and 152 yellow peas. Use a 0.01 significance level to test Mendel’s claim that under the same circumstances, 25% of offspring peas will be yellow. What can we conclude about
In a study of cell phone use and brain hemispheric dominance, an Internet survey was e-mailed to 5000 subjects randomly selected from an online group involved with ears. 717 surveys were returned. Use a 0.01 significance level to test the claim that the return rate is less than 15%.Identify the
In a study of 1228 randomly selected medical malpractice lawsuits, it was found that 856 of them were dropped or dismissed (based on data from the Physicians Insurers Association of America). Use a 0.01 significance level to test the claim that most medical malpractice lawsuits are dropped or
The drug Eliquis (apixaban) is used to help prevent blood clots in certain patients. In clinical trials, among 5924 patients treated with Eliquis, 153 developed the adverse reaction of nausea (based on data from Bristol-Myers Squibb Co.). Use a 0.05 significance level to test the claim that 3% of
In a study of the accuracy of fast food drive-through orders, McDonald’s had 33 orders that were not accurate among 362 orders observed (based on data from QSR magazine). Use a 0.05 significance level to test the claim that the rate of inaccurate orders is equal to 10%. Does the accuracy rate
Identify the null hypothesis and alternative hypothesis.Use these results from a USA Today survey in which 510 people chose to respond to this question that was posted on the USA Today website: “Should Americans replace passwords with biometric security (fingerprints, etc)?” Among the
Chantix (varenicline) tablets are used as an aid to help people stop smoking. In a clinical trial, 129 subjects were treated with Chantix twice a day for 12 weeks, and 16 subjects experienced abdominal pain (based on data from Pfizer, Inc.). If someone claims that more than 8% of Chantix users
The proportion of people who write with their left hand is equal to 0.1.Provide statements that identify the type I error and the type II error that correspond to the given claim. (Although conclusions are usually expressed in verbal form, the answers here can be expressed with statements that
Exercise 20Refer to the information in the given exercise and do the following.a. Find the critical value(s).b. Using a significance level of α = 0.05, should we reject H0 or should we fail to reject H0?The test statistic of z = -1.94 is obtained when testing the claim that p = 3/8.
Exercise 19Refer to the information in the given exercise and do the following.a. Find the critical value(s).b. Using a significance level of α = 0.05, should we reject H0 or should we fail to reject H0?The test statistic of z = 2.01 is obtained when testing the claim that p ≠ 0.345?
Exercise 18Refer to the information in the given exercise and do the following.a. Find the critical value(s).b. Using a significance level of α = 0.05, should we reject H0 or should we fail to reject H0?The test statistic of z = -2.50 is obtained when testing the claim that ( < 0.75.
Exercise 17Refer to the information in the given exercise and do the following.a. Find the critical value(s).b. Using a significance level of α = 0.05, should we reject H0 or should we fail to reject H0?The test statistic of z = 1.00 is obtained when testing the claim that ( > 0.3?
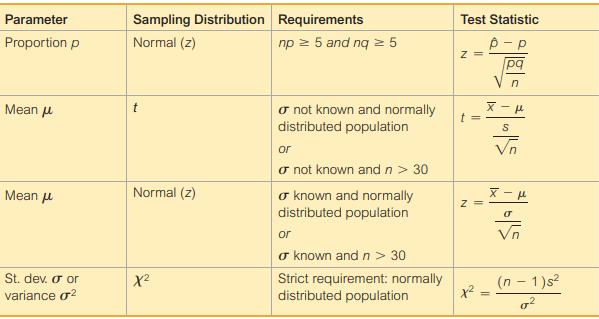
Exercise 5 “Online Data”Refer to the exercise identified and find the value of the test statistic. (Refer to Table 8-2 on page 362 to select the correct expression for evaluating the test statistic.)Data From Exercise 6:Claim: Most adults would erase all of their personal information online if
Exercise 6 “Cell Phone”Refer to the exercise identified and find the value of the test statistic. (Refer to Table 8-2 on page 362 to select the correct expression for evaluating the test statistic.)Data From Exercise 6:Claim: Fewer than 95% of adults have a cell phone. In a Marist poll of 1128
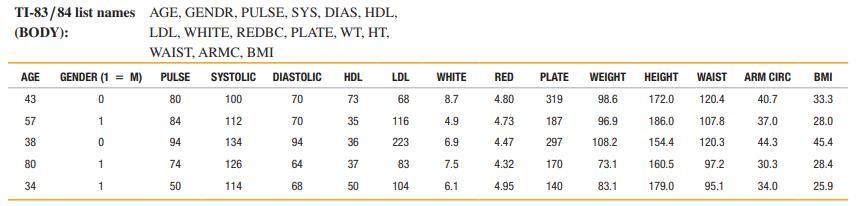
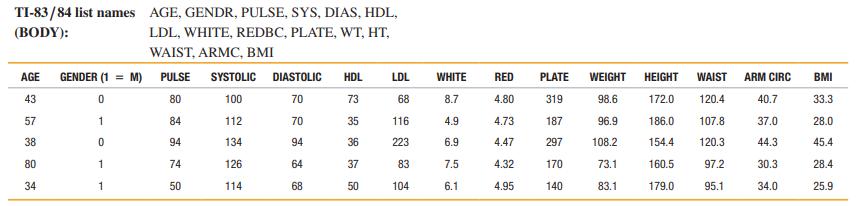
Exercise 7 “Pulse Rates”Refer to the exercise identified and find the value of the test statistic. (Refer to Table 8-2 on page 362 to select the correct expression for evaluating the test statistic.)Data From Exercise 7:Claim: The mean pulse rate (in beats per minute, or bpm) of adult males is
Exercise 8 “Pulse Rates”Refer to the exercise identified and find the value of the test statistic. (Refer to Table 8-2 on page 362 to select the correct expression for evaluating the test statistic.)Data From Exercise 8:Claim: The standard deviation of pulse rates of adult males is more than 11
Exercise 8 “Pulse Rates”Refer to the exercise identified and find the value of the test statistic. (Refer to Table 8-2 on page 362 to select the correct expression for evaluating the test statistic.)Data From Exercise 8:Claim: The standard deviation of pulse rates of adult males is more than 11
Exercise 8 “Pulse Rates”Refer to the exercise identified and find the value of the test statistic. (Refer to Table 8-2 on page 362 to select the correct expression for evaluating the test statistic.)Data From Exercise 8:Claim: The standard deviation of pulse rates of adult males is more than 11
Exercise 8 “Pulse Rates”Refer to the exercise identified and find the value of the test statistic. (Refer to Table 8-2 on page 362 to select the correct expression for evaluating the test statistic.)Data From Exercise 8:Claim: The standard deviation of pulse rates of adult males is more than 11
Exercise 8 “Pulse Rates”Refer to the exercise identified. Make subjective estimates to decide whether results are significantly low or significantly high, then state a conclusion about the original claim. For example, if the claim is that a coin favors heads and sample results consist of 11
Exercise 7 “Pulse Rates”Refer to the exercise identified. Make subjective estimates to decide whether results are significantly low or significantly high, then state a conclusion about the original claim. For example, if the claim is that a coin favors heads and sample results consist of 11
Exercise 5 “Online Data”Refer to the exercise identified. Make subjective estimates to decide whether results are significantly low or significantly high, then state a conclusion about the original claim. For example, if the claim is that a coin favors heads and sample results consist of 11
Claim: The standard deviation of pulse rates of adult males is more than 11 bpm. For the random sample of 153 adult males in Data Set 1 “Body Data” in Appendix B, the pulse rates have a standard deviation of 11.3 bpm.Do the following:a. Express the original claim in symbolic form.b. Identify
Claim: The mean pulse rate (in beats per minute, or bpm) of adult males is equal to 69 bpm. For the random sample of 153 adult males in Data Set 1 “Body Data” in Appendix B, the mean pulse rate is 69.6 bpm and the standard deviation is 11.3 bpm.Do the following:a. Express the original claim in
Claim: Fewer than 95% of adults have a cell phone. In a Marist poll of 1128 adults, 87% said that they have a cell phone.Do the following:a. Express the original claim in symbolic form.b. Identify the null and alternative hypotheses.
Claim: Most adults would erase all of their personal information online if they could. A GFI Software survey of 565 randomly selected adults showed that 59% of them would erase all of their personal information online if they could.Do the following:a. Express the original claim in symbolic form.b.
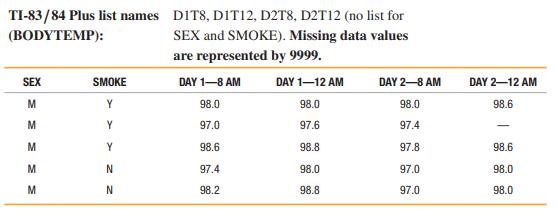
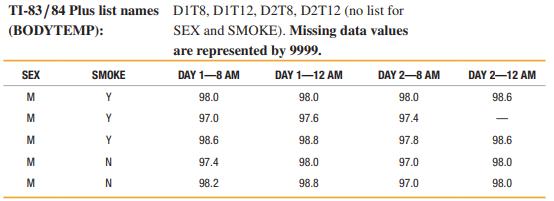
Data Set 3 “Body Temperatures” in Appendix B includes sample body temperatures. We could use methods of Chapter 7 for making an estimate, or we could use those values to test the common belief that the mean body temperature is 98.6°F. What is the difference between estimating and hypothesis
Assume that a method of gender selection can affect the probability of a baby being a girl, so that the probability becomes 1/4. Each student should simulate 20 births by drawing 20 cards from a shuffled deck. Replace each card after it has been drawn, then reshuffle. Consider the hearts to be
Surveys have become an integral part of our lives. Because it is so important that every citizen has the ability to interpret survey results, surveys are the focus of this project.The Pew Research Center recently conducted a survey of 1007 U.S. adults and found that 85% of those surveyed know what
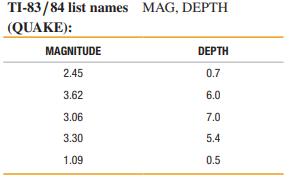
Data Set 21 “Earthquakes” in Appendix B includes the depths (km) of the sources of 600 earthquakes. Use technology for the following.a. Find the mean and standard deviation of the 600 depths.b. Generate a histogram and normal quantile plot of the 600 depths. Does it appear that the depths are
Find the sample size necessary to estimate the mean arrival delay time for all American Airlines flights from JFK to LAX. Assume that we want 95% confidence that the sample mean is in error by no more than 5 min. Based on a larger sample than the one given for Exercises 1–4, assume that all
Repeat Exercise 7 “Wristwatch Accuracy” using 1000 bootstrap samples.Data from Exercise 7:Students of the author collected data measuring the accuracy of wristwatches. The times (sec) below show the discrepancy between the real time and the time indicated on the wristwatch. Negative values
Students of the author collected data measuring the accuracy of wristwatches. The times (sec) below show the discrepancy between the real time and the time indicated on the wristwatch. Negative values correspond to watches that are running ahead of the actual time. The data appear to be from a
Identify the distribution (normal, Student t, chi-square) that should be used in each of the following situations. If none of the three distributions can be used, what other method could be used?a. In constructing a confidence interval of m, you have 75 sample values and they appear to be from a
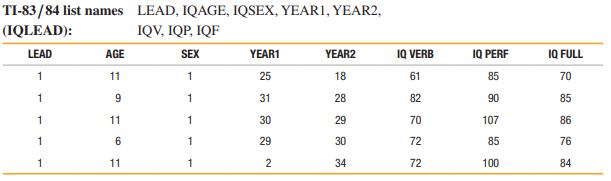
There have been several studies conducted in an attempt to identify ways in which left-handed people are different from those who are right handed. Assume that you want to estimate the mean IQ of all left-handed adults. How many random left-handed adults must be tested in order to be 99% confident
Listed below are measured amounts of caffeine (mg per 12 oz of drink) obtained in one can from each of 20 brands. Using the bootstrap method with 1000 bootstrap samples, construct a 99% confidence interval estimate of m. How does the result compare to the confidence interval found in Exercise 22
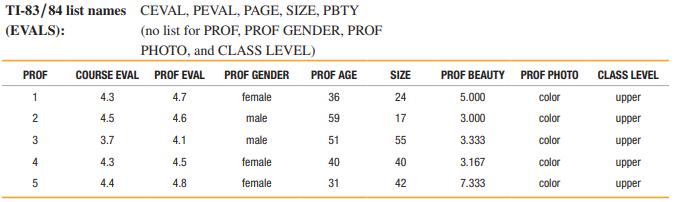
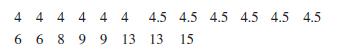
Listed below are student evaluation ratings of courses, where a rating of 5 is for “excellent.” The ratings were obtained at the University of Texas at Austin. (See Data Set 17 “Course Evaluations” in Appendix B.) Using the bootstrap method with 1000 bootstrap samples, construct a 90%
In a study of 1228 randomly selected medical malpractice lawsuits, it was found that 856 of them were dropped or dismissed (based on data from the Physicians Insurers Association of America). Use the bootstrap method to construct a 95% confidence interval estimate of the proportion of lawsuits that
Repeat Exercise 8 “Cell Phone Radiation” using a confidence level of 90% for parts (a) and (b) and using 1000 bootstrap samples instead of the 10 that were given in Exercise 8.Data From Exercise 8:Here is a sample of measured radiation emissions (cW/kg) for cell phones (based on data from the
Here is a random sample of taxi-out times (min) for American Airlines flights leaving JFK airport: 12, 19, 13, 43, 15. For this sample, what is a bootstrap sample?
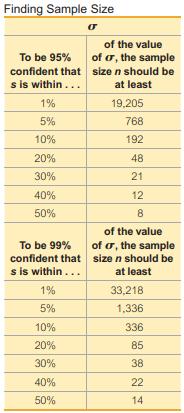
You want to estimate σ for the population of IQ scores of statistics professors. Find the minimum sample size needed to be 95% confident that the sample standard deviation s is within 1% of σ. Is this sample size practical?Assume that each sample is a simple random sample obtained from a normally
You want to estimate σ for the population of IQ scores of statistics professors. Find the minimum sample size needed to be 95% confident that the sample standard deviation s is within 1% of σ. Is this sample size practical?Assume that each sample is a simple random sample obtained from a normally
Example 2 showed how the statistics of n = 22 and s = 14.3 result in this 95% confidence interval estimate of σ: 11.0 < σ < 20.4. That confidence interval can also be expressed as (11.0, 20.4), but it cannot be expressed as 15.7 ± 4.7. Given that 15.7 ± 4.7 results in values of 11.0 and 20.4,
Data Set 3 “Body Temperatures” in Appendix B includes a sample of 106 body temperatures having a mean of 98.20°F and a standard deviation of 0.62°F. Construct a 95% confidence interval estimate of the mean body temperature for the entire population. What does the result suggest about the
Data Set 1 “Body Data” in Appendix B includes ages of 147 randomly selected adult females, and those ages have a standard deviation of 17.7 years. Assume that ages of female statistics students have less variation than ages of females in the general population, so let σ = 17.7 years for the
Assume that all grade-point averages are to be standardized on a scale between 0 and 4. How many grade-point averages must be obtained so that the sample mean is within 0.01 of the population mean? Assume that a 95% confidence level is desired. If we use the range rule of thumb, we can estimate σ
Assume that all grade-point averages are to be standardized on a scale between 0 and 4. How many grade-point averages must be obtained so that the sample mean is within 0.01 of the population mean? Assume that a 95% confidence level is desired. If we use the range rule of thumb, we can estimate σ
See the preceding exercise, in which we can assume that α = 15 for the IQ scores. Attorneys are a group with IQ scores that vary less than the IQ scores of the general population. Find the sample size needed to estimate the mean IQ of attorneys, given that we want 98% confidence that the sample
Listed below are the numbers of years it took for a random sample of college students to earn bachelor’s degrees (based on data from the National Center for Education Statistics). Construct a 95% confidence interval estimate of the mean time required for all college students to earn bachelor’s
A clinical trial was conducted to test the effectiveness of the drug zopiclone for treating insomnia in older subjects. Before treatment with zopiclone, 16 subjects had a mean wake time of 102.8 min. After treatment with zopiclone, the 16 subjects had a mean wake time of 98.9 min and a standard
A clinical trial was conducted to test the effectiveness of the drug zopiclone for treating insomnia in older subjects. Before treatment with zopiclone, 16 subjects had a mean wake time of 102.8 min. After treatment with zopiclone, the 16 subjects had a mean wake time of 98.9 min and a standard
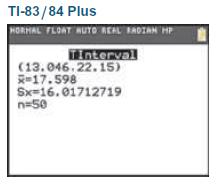
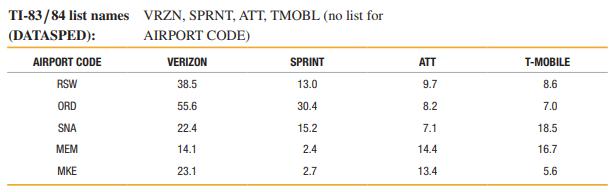
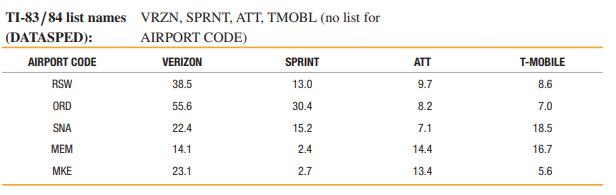
What does it mean when we say that the confidence interval methods of this section are robust against departures from normality?Refer to the accompanying screen display that results from the Verizon airport data speeds (Mbps) from Data Set 32 “Airport Data Speeds” in Appendix B. The confidence
What does it mean when we say that the confidence interval methods of this section are robust against departures from normality?Refer to the accompanying screen display that results from the Verizon airport data speeds (Mbps) from Data Set 32 “Airport Data Speeds” in Appendix B. The confidence
A one-sided claim about a population proportion is a claim that the proportion is less than (or greater than) some specific value. Such a claim can be formally addressed using a one-sided confidence interval for p, which can be expressed as p < p̂ + E or p > p̂ - E, where the margin of error E is
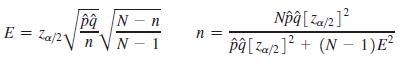
For Formulas 7-2 and 7-3 we assume that the population is infinite or very large and that we are sampling with replacement. When we sample without replacement from a relatively small population with size N, we modify E to include the finite population correction factor shown here, and we can solve
For Formulas 7-2 and 7-3 we assume that the population is infinite or very large and that we are sampling with replacement. When we sample without replacement from a relatively small population with size N, we modify E to include the finite population correction factor shown here, and we can solve
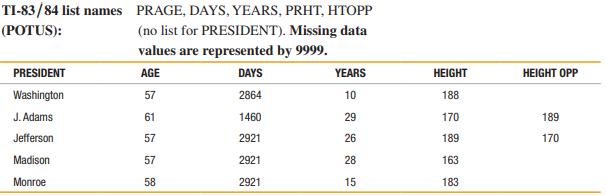
Refer to Data Set 15 “Presidents” in Appendix B. Treat the data as a sample and find the proportion of presidents who were taller than their opponents. Use that result to construct a 95% confidence interval estimate of the population percentage. Based on the result, does it appear that greater
Refer to Data Set 15 “Presidents” in Appendix B. Treat the data as a sample and find the proportion of presidents who were taller than their opponents. Use that result to construct a 95% confidence interval estimate of the population percentage. Based on the result, does it appear that greater
In a study of 1228 randomly selected medical malpractice lawsuits, it was found that 856 of them were dropped or dismissed (based on data from the Physicians Insurers Association of America). Construct a 95% confidence interval for the proportion of medical malpractice lawsuits that are dropped or
98%Find the critical value zA,2 that corresponds to the given confidence level.
99.5%Find the critical value zA,2 that corresponds to the given confidence level.
99%Find the critical value zA,2 that corresponds to the given confidence level.
99%Find the critical value zA,2 that corresponds to the given confidence level.
For the poll described in Exercise 1, what values do p̂, q̂, n, E, and p represent? If the confidence level is 95%, what is the value of a?Data From Exercise 1:USA Today provided results from a poll of 1000 adults who were asked to identify their favorite pie. Among the 1000 respondents, 14%
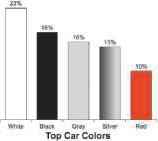
Divide into groups of three or four students. Each student should obtain a sample of cars and record the number of cars that are white. Combine the results and use methods of this chapter to compare the results to those expected from the graph of top car colors that accompanies Exercises 9–12 in
Divide into groups of three or four students. Select a set of data from one of these data sets in Appendix B: 2, 3, 4, 5, 6, 7, 13, 16, 17, 18, 19, 20, 24, 27, 30, 32. (These are the data sets that were not used in in examples or exercises in Section 6-5). Use the methods of Section 6-5 to
Divide into groups of three or four students and address these issues affecting the design of manhole covers.• Which of the following is most relevant for determining whether a manhole cover diameter of 24 in. is large enough: weights of men, weights of women, heights of men, heights of women,
Divide into groups of three or four students and address these issues affecting the design of manhole covers.
Some methods in this chapter are easy with technology but very difficult without it. The two projects that follow illustrate how easy it is to use technology for assessing normality and finding binomial probabilities.1. Assessing Normality It is often necessary to determine whether sample data
The Mark VI monorail used at Disney World has doors with a height of 72 in. Heights of men are normally distributed with a mean of 68.6 in. and a standard deviation of 2.8 in. (based on Data Set 1 “Body Data” in Appendix B).a. What percentage of adult men can fit through the doors without
The Mark VI monorail used at Disney World has doors with a height of 72 in. Heights of men are normally distributed with a mean of 68.6 in. and a standard deviation of 2.8 in. (based on Data Set 1 “Body Data” in Appendix B).a. What percentage of adult men can fit through the doors without
Scores on the Gilliam Autism Rating Scale (GARS) are normally distributed with a mean of 100 and a standard deviation of 15. A sample of 64 GARS scores is randomly selected and the sample mean is computed.a. Describe the distribution of such sample means.b. What is the mean of all such sample
In a study of 420,095 cell phone users in Denmark, it was found that 135 developed cancer of the brain or nervous system. For those not using cell phones, there is a 0.000340 probability of a person developing cancer of the brain or nervous system. We therefore expect about 143 cases of such
In a survey of 1002 people, 701 said that they voted in a recent presidential election (based on data from ICR Research Group). Voting records showed that 61% of eligible voters actually did vote.a. Given that 61% of eligible voters actually did vote, find the probability that among 1002 randomly
In the year that this exercise was written, there were 879 challenges made to referee calls in professional tennis singles play. Among those challenges, 231 challenges were upheld with the call overturned. Assume that in general, 25% of the challenges are successfully upheld with the call
With n = 8 births and p = 0.512 for a boy, find P(exactly 5 boys).Do the following: If the requirements of np ≥ 5 and nq ≥ 5 are both satisfied, estimate the indicated probability by using the normal distribution as an approximation to the binomial distribution; if np < 5 or nq < 5, then state
The heights (in inches) of men listed in Data Set 1 “Body Data” in Appendix B have a distribution that is approximately normal, so it appears that those heights are from a normally distributed population.a. If 2 inches is added to each height, are the new heights also normally distributed?b. If
The Boeing 757-200 ER airliner carries 200 passengers and has doors with a height of 72 in. Heights of men are normally distributed with a mean of 68.6 in. and a standard deviation of 2.8 in. (based on Data Set 1 “Body Data” in Appendix B).a. If a male passenger is randomly selected, find the
The Boeing 757-200 ER airliner carries 200 passengers and has doors with a height of 72 in. Heights of men are normally distributed with a mean of 68.6 in. and a standard deviation of 2.8 in. (based on Data Set 1 “Body Data” in Appendix B).a. If a male passenger is randomly selected, find the
When women were finally allowed to become pilots of fighter jets, engineers needed to redesign the ejection seats because they had been originally designed for men only. The ACES-II ejection seats were designed for men weighing between 140 lb and 211 lb. Weights of women are now normally
Assume that cans of Coke are filled so that the actual amounts have a mean of 12.00 oz and a standard deviation of 0.11 oz.a. Find the probability that a single can of Coke has at least 12.19 oz.b. The 36 cans of Coke in Data Set 26 “Cola Weights and Volumes” in Appendix B have a mean of 12.19
Passengers died when a water taxi sank in Baltimore's Inner Harbor. Men are typically heavier than women and children, so when loading a water taxi, assume a worst-case scenario in which all passengers are men. Assume that weights of men are normally distributed with a mean of 189 lb and a standard
Passengers died when a water taxi sank in Baltimore's Inner Harbor. Men are typically heavier than women and children, so when loading a water taxi, assume a worst-case scenario in which all passengers are men. Assume that weights of men are normally distributed with a mean of 189 lb and a standard
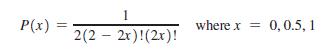
Exercise 15 “Births” requires the construction of a table that describes the sampling distribution of the proportions of girls from two births. Consider the formula shown here, and evaluate that formula using sample proportions (represented by x) of 0, 0.5, and 1. Based on the results, does the
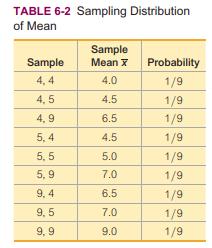
Repeat Exercise 11 using ranges instead of means.Data From Exercise 11:a. After identifying the 16 different possible samples, find the mean of each sample, then construct a table representing the sampling distribution of the sample mean. In the table, combine values of the sample mean that are the
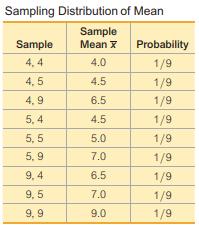
a. After identifying the 16 different possible samples, find the mean of each sample, then construct a table representing the sampling distribution of the sample mean. In the table, combine values of the sample mean that are the same.b. Compare the mean of the population 34, 36, 41, 51 to the mean
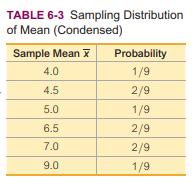
a. Find the value of the population median.b. Table 6-2 describes the sampling distribution of the sample mean. Construct a similar table representing the sampling distribution of the sample median. Then combine values of the median that are the same, as in Table 6-3.c. Find the mean of the
For the following, round results to three decimal places.a. Find the value of the population standard deviation s.b. Table 6-2 describes the sampling distribution of the sample mean. Construct a similar table representing the sampling distribution of the sample standard deviation s. Then combine
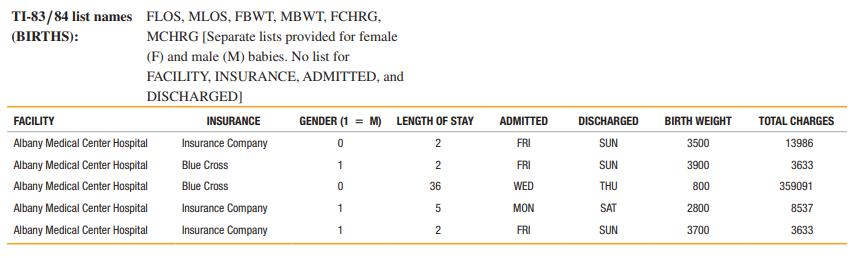
Data Set 4 “Births” in Appendix B includes a sample of birth weights. If we explore this sample of 400 birth weights by constructing a histogram and finding the mean and standard deviation, do those results describe the sampling distribution of the mean? Why or why not?Data Set 4: BirthsData
For the purposes of constructing modified boxplots as described in Section 3-3, outliers are defined as data values that are above Q3 by an amount greater than 1.5 × IQR or below Q1 by an amount greater than 1.5 × IQR, where IQR is the interquartile range. Using this definition of outliers, find
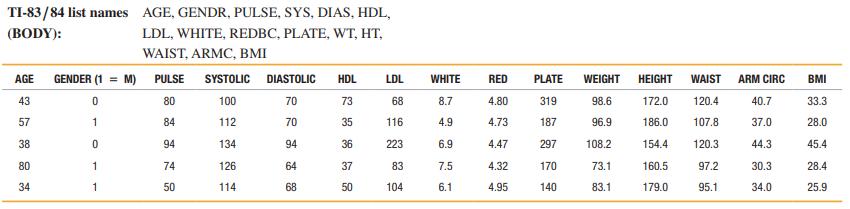
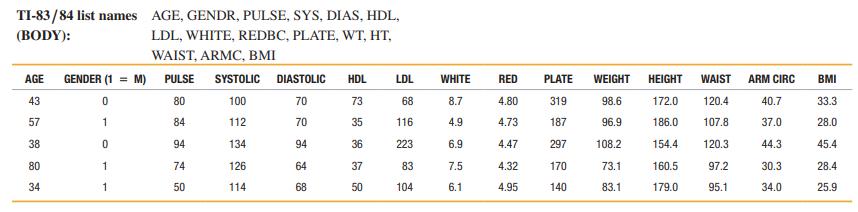
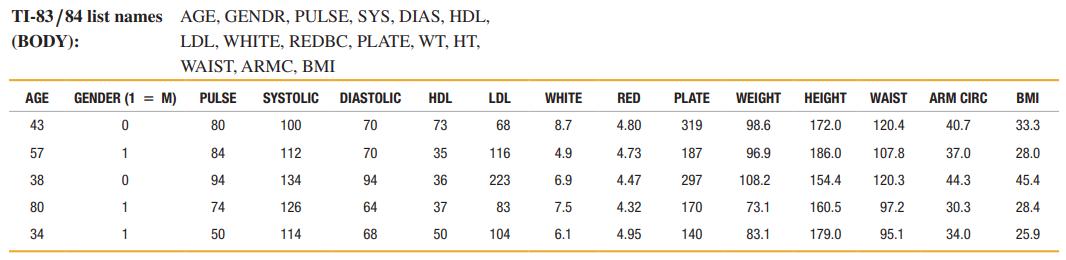
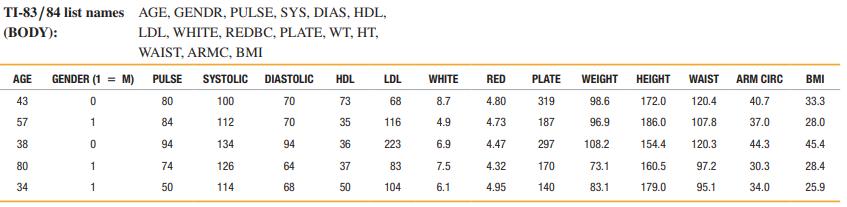
Refer to Data Set 1 “Body Data” in Appendix B and use the pulse rates of males.a. Find the mean and standard deviation, and verify that the pulse rates have a distribution that is roughly normal.b. Treating the unrounded values of the mean and standard deviation as parameters, and assuming that
When a water taxi sank in Baltimore’s Inner Harbor, an investigation revealed that the safe passenger load for the water taxi was 3500 lb. It was also noted that the mean weight of a passenger was assumed to be 140 lb. Assume a “worst-case” scenario in which all of the passengers are adult
The lengths of pregnancies are normally distributed with a mean of 268 days and a standard deviation of 15 days.a. In a letter to “Dear Abby,” a wife claimed to have given birth 308 days after a brief visit from her husband, who was working in another country. Find the probability of a
Based on the sample results in Data Set 3 “Body Temperatures” in Appendix B, assume that human body temperatures are normally distributed with a mean of 98.20°F and a standard deviation of 0.62°F.a. According to emedicinehealth.com, a body temperature of 100.4°F or above is considered to be
After 1964, quarters were manufactured so that their weights have a mean of 5.67 g and a standard deviation of 0.06 g. Some vending machines are designed so that you can adjust the weights of quarters that are accepted. If many counterfeit coins are found, you can narrow the range of acceptable
The Gulfstream 100 is an executive jet that seats six, and it has a doorway height of 51.6 in.a. What percentage of adult men can fit through the door without bending?b. Does the door design with a height of 51.6 in. appear to be adequate? Why didn’t the engineers design a larger door?c. What
The U.S. Navy requires that fighter pilots have heights between 62 in. and 78 in.a. Find the percentage of women meeting the height requirement. Are many women not qualifie because they are too short or too tall?b. If the Navy changes the height requirements so that all women are eligible except
The U.S. Navy requires that fighter pilots have heights between 62 in. and 78 in.a. Find the percentage of women meeting the height requirement. Are many women not qualifie because they are too short or too tall?b. If the Navy changes the height requirements so that all women are eligible except
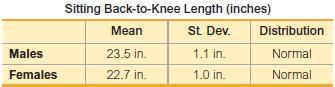
For females, find the first quartile Q1, which is the length separating the bottom 25% from the top 75%.Use the data in the table below for sitting adult males and females (based on anthropometric survey data from Gordon, Churchill, et al.). These data are used often in the design of different
For females, find the first quartile Q1, which is the length separating the bottom 25% from the top 75%.Use the data in the table below for sitting adult males and females (based on anthropometric survey data from Gordon, Churchill, et al.). These data are used often in the design of different
Showing 300 - 400
of 2634
1
2
3
4
5
6
7
8
9
10
11
12
13
14
15
Last
Step by Step Answers